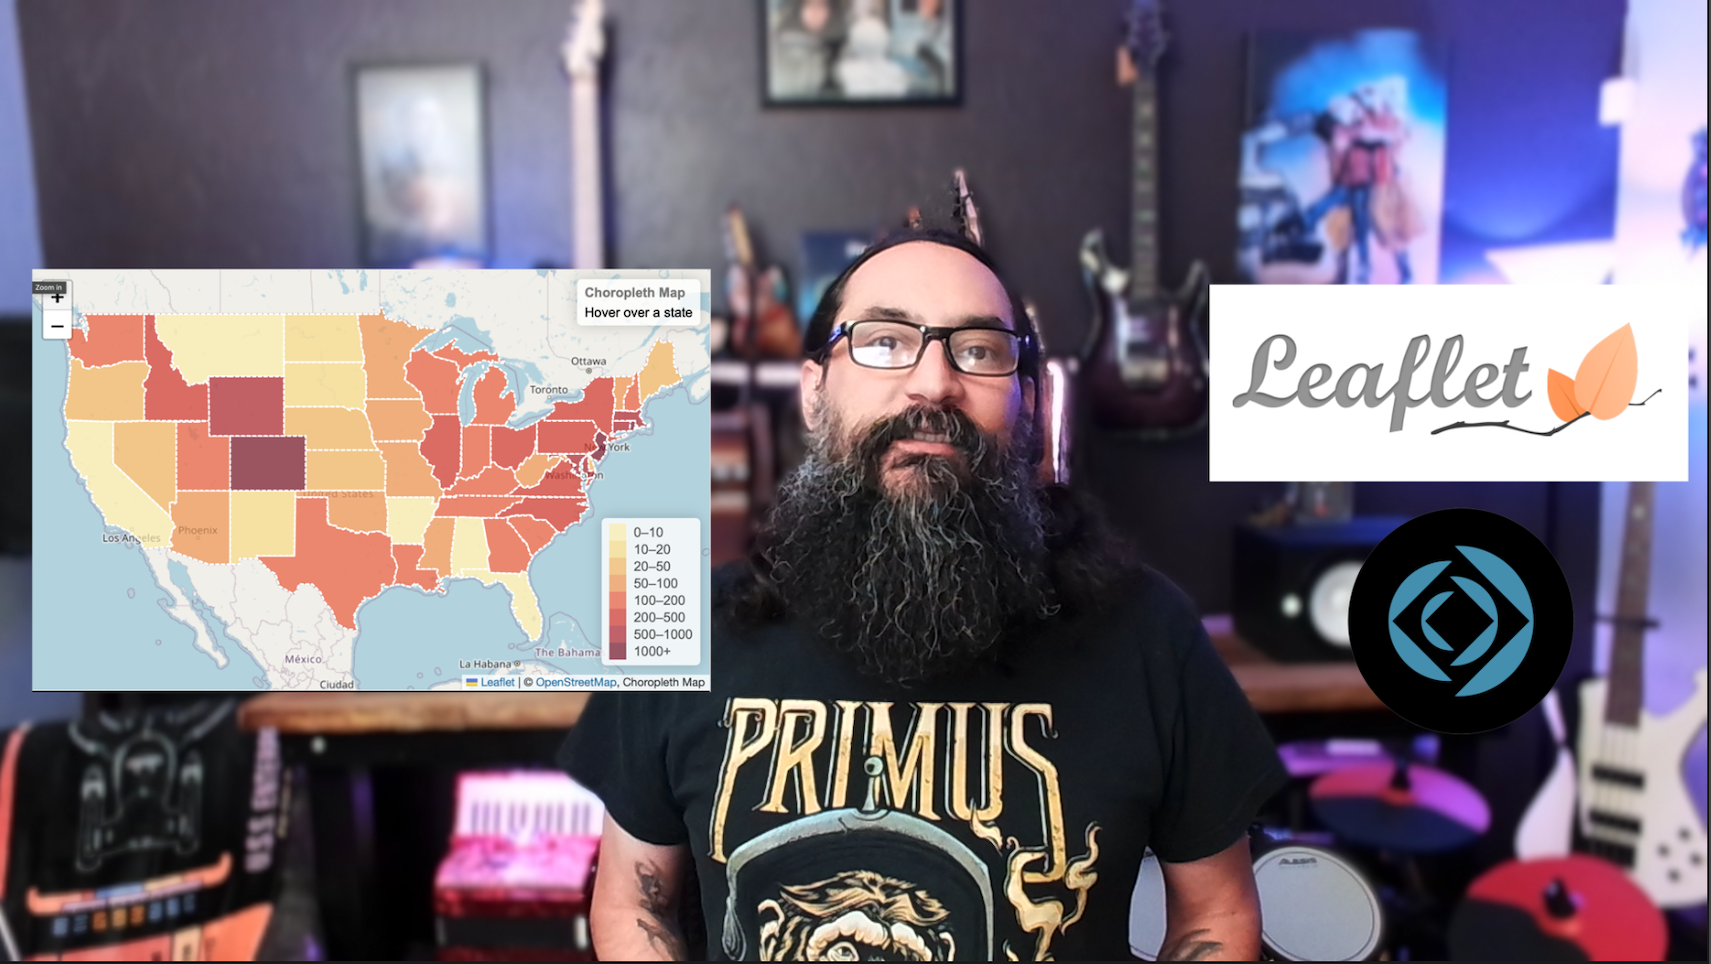
Choropleth Map in FileMaker Pro Web Viewer With Leaflet.JS
 GreenFlux
Choropleth maps are similar to heat maps, but with regions defined by geometry, rather than a grid. These maps are useful for displaying aggregate values for each region, like census or voting totals, average income or home cost per state, and other demographics. One of the most popular JavaScript libraries for creating Choropleth maps is Leaflet.js.
In this guide, I'll show you how to use Leaflet.js in a FileMaker web viewer to build a Choropleth map that's driven by your data.
WATCH ON YOUTUBE:
https://youtu.be/Op6UZmh-20g
Download the demo app:
https://github.com/GreenFluxLLC/FileMaker-Experiments
Subscribe to my newsletter
Read articles from GreenFlux directly inside your inbox. Subscribe to the newsletter, and don't miss out.
Written by

GreenFlux
GreenFlux
NO LONGER ON HASHNODE: Follow at: https://news.greenflux.us/ Nuclear Plant Operator (US Navy), Turned Freelancer, Turned Developer Advocate. Head of Developer Relations @ Appsmith, Inc Founder/ Freelancer @ GreenFlux, LLC GREENFLUX, LLC WE'VE GOT YOUR APP COVERED. Veteran Owned & Operated Since 2016 - Tallahassee, FL