Day 36/40 Days of K8s: Kubernetes Logging and Monitoring !!
 Gopi Vivek Manne
In a Kubernetes (K8s) cluster, effective monitoring and logging are important for understanding the overall health and performance of the system. However, K8s does not have built-in monitoring capabilities. To address this, you need to install additional add-ons to the cluster(metrics-server).
The Horizontal Pod Auto Scalar(HPA) and Vertical Pod Auto Scalar(VPA) uses the data from the metrics API to adjust workload replicas and resources to meet customer demand.
❇ Deploying Metrics Server
One of the add-ons for monitoring in K8s is the Metrics Server. The Metrics Server is responsible for collecting and exposing resource metrics, such as CPU and memory usage, for pods and nodes. You can deploy the Metrics Server using a manifest or a Helm chart.

❇ How Metrics Exposure Works
Once the Metrics Server pods are up and running, the process of exposing metrics works as follows:
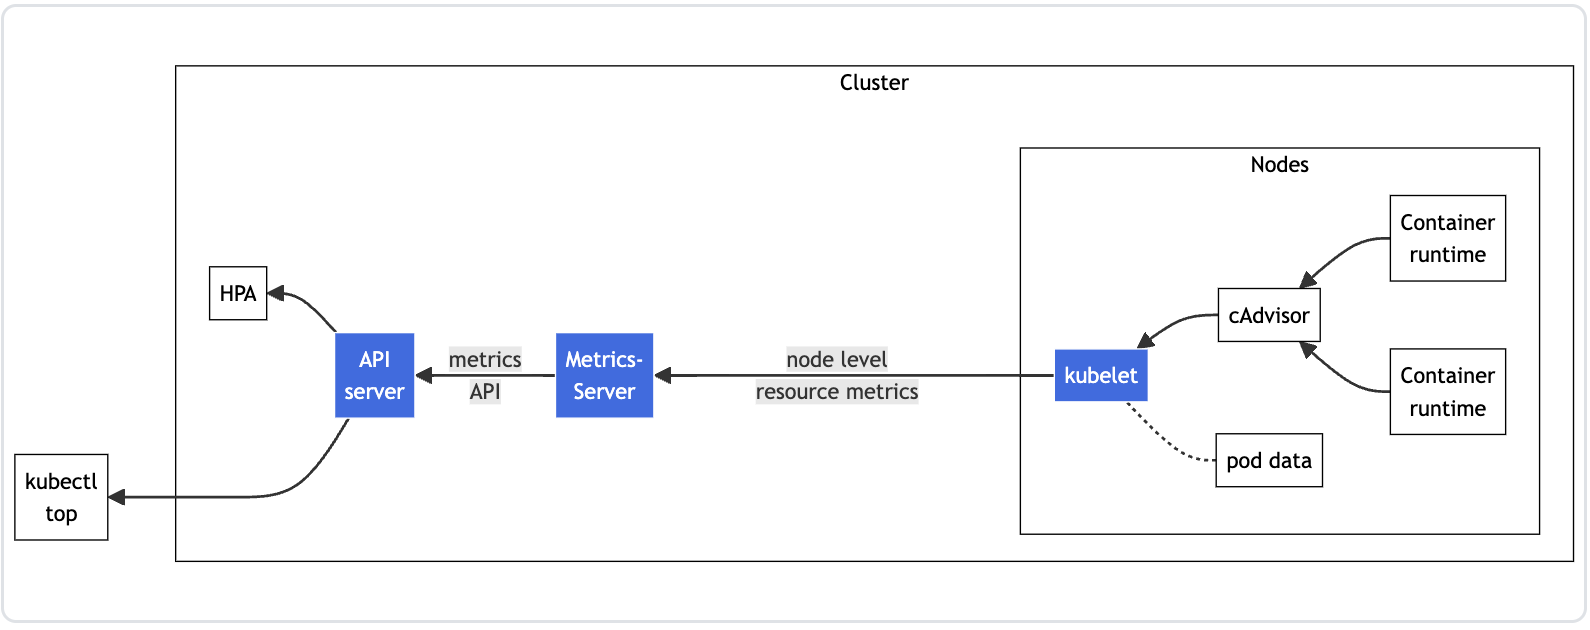
On each node, the Kubelet agent manages the lifecycle of pods and ensures the requests received from the API server are set up. The Kubelet also facilitates communication between the master and worker nodes.
The
CAdvisorcomponent collects and aggregates the resource metrics (node-level and pod-level) and sends them to the Kubelet.The Kubelet then forwards the metrics data to the Metrics Server.
The Metrics Server exposes the metrics via the Metrics Server API endpoint, which is accessible through the API server.
When you run the
kubectl topcommand, it queries the API server, which in turn fetches the data from the Metrics Server.
❇ Importance of Monitoring and Logging
Effective monitoring and logging are essential in a K8s cluster for several reasons:
Advanced Monitoring and Alerting: By exposing the metrics through the Metrics Server, you can integrate with third-party monitoring tools like Prometheus and Grafana. This allows you to configure alerts and create dashboards for data visualization, enhancing the overall observability of the K8s cluster.
Troubleshooting: In the event of API server downtime, the
kubectl topcommand will not work. In such cases, you can use thecrictlutility to debug the static pods, including the API server, and access the logs to identify and resolve issues.
❇ Troubleshooting Tips
When troubleshooting pods in a K8s cluster, you can use the following commands:
Check the logs of the pod using
kubectl logs <pod-name>.Describe the pod using
kubectl describe pod <pod-name>to view the events associated with the pod.Use
crictl(Container Runtime Interface Control) to debug the containers running on the node, as the default container runtime has changed from Docker toContainerdin Kubernetes v1.24 and later.Check the logs of the container using
crictl logs -f <container-id>.
By following these steps and using the Metrics Server and other monitoring tools, you can effectively monitor, log, and troubleshoot your Kubernetes cluster, ensuring its overall health and performance.
❇ Hands on
Verify all node are up and running

Deploy the metrics server using manifest if not already and verify metrics server pod is up and running
apiVersion: v1
kind: ServiceAccount
metadata:
  labels:
    k8s-app: metrics-server
  name: metrics-server
  namespace: kube-system
---
apiVersion: rbac.authorization.k8s.io/v1
kind: ClusterRole
metadata:
  labels:
    k8s-app: metrics-server
    rbac.authorization.k8s.io/aggregate-to-admin: "true"
    rbac.authorization.k8s.io/aggregate-to-edit: "true"
    rbac.authorization.k8s.io/aggregate-to-view: "true"
  name: system:aggregated-metrics-reader
rules:
- apiGroups:
  - metrics.k8s.io
  resources:
  - pods
  - nodes
  verbs:
  - get
  - list
  - watch
---
apiVersion: rbac.authorization.k8s.io/v1
kind: ClusterRole
metadata:
  labels:
    k8s-app: metrics-server
  name: system:metrics-server
rules:
- apiGroups:
  - ""
  resources:
  - nodes/metrics
  verbs:
  - get
- apiGroups:
  - ""
  resources:
  - pods
  - nodes
  verbs:
  - get
  - list
  - watch
---
apiVersion: rbac.authorization.k8s.io/v1
kind: RoleBinding
metadata:
  labels:
    k8s-app: metrics-server
  name: metrics-server-auth-reader
  namespace: kube-system
roleRef:
  apiGroup: rbac.authorization.k8s.io
  kind: Role
  name: extension-apiserver-authentication-reader
subjects:
- kind: ServiceAccount
  name: metrics-server
  namespace: kube-system
---
apiVersion: rbac.authorization.k8s.io/v1
kind: ClusterRoleBinding
metadata:
  labels:
    k8s-app: metrics-server
  name: metrics-server:system:auth-delegator
roleRef:
  apiGroup: rbac.authorization.k8s.io
  kind: ClusterRole
  name: system:auth-delegator
subjects:
- kind: ServiceAccount
  name: metrics-server
  namespace: kube-system
---
apiVersion: rbac.authorization.k8s.io/v1
kind: ClusterRoleBinding
metadata:
  labels:
    k8s-app: metrics-server
  name: system:metrics-server
roleRef:
  apiGroup: rbac.authorization.k8s.io
  kind: ClusterRole
  name: system:metrics-server
subjects:
- kind: ServiceAccount
  name: metrics-server
  namespace: kube-system
---
apiVersion: v1
kind: Service
metadata:
  labels:
    k8s-app: metrics-server
  name: metrics-server
  namespace: kube-system
spec:
  ports:
  - name: https
    port: 443
    protocol: TCP
    targetPort: https
  selector:
    k8s-app: metrics-server
---
apiVersion: apps/v1
kind: Deployment
metadata:
  labels:
    k8s-app: metrics-server
  name: metrics-server
  namespace: kube-system
spec:
  selector:
    matchLabels:
      k8s-app: metrics-server
  strategy:
    rollingUpdate:
      maxUnavailable: 0
  template:
    metadata:
      labels:
        k8s-app: metrics-server
    spec:
      containers:
      - args:
        - --cert-dir=/tmp
        - --secure-port=10250
        - --kubelet-preferred-address-types=InternalIP,ExternalIP,Hostname
        - --kubelet-use-node-status-port
        - --kubelet-insecure-tls
        - --metric-resolution=15s
        image: registry.k8s.io/metrics-server/metrics-server:v0.7.1
        imagePullPolicy: IfNotPresent
        livenessProbe:
          failureThreshold: 3
          httpGet:
            path: /livez
            port: https
            scheme: HTTPS
          periodSeconds: 10
        name: metrics-server
        ports:
        - containerPort: 10250
          name: https
          protocol: TCP
        readinessProbe:
          failureThreshold: 3
          httpGet:
            path: /readyz
            port: https
            scheme: HTTPS
          initialDelaySeconds: 20
          periodSeconds: 10
        resources:
          requests:
            cpu: 100m
            memory: 200Mi
        securityContext:
          allowPrivilegeEscalation: false
          capabilities:
            drop:
            - ALL
          readOnlyRootFilesystem: true
          runAsNonRoot: true
          runAsUser: 1000
          seccompProfile:
            type: RuntimeDefault
        volumeMounts:
        - mountPath: /tmp
          name: tmp-dir
      nodeSelector:
        kubernetes.io/os: linux
      priorityClassName: system-cluster-critical
      serviceAccountName: metrics-server
      volumes:
      - emptyDir: {}
        name: tmp-dir
---
apiVersion: apiregistration.k8s.io/v1
kind: APIService
metadata:
  labels:
    k8s-app: metrics-server
  name: v1beta1.metrics.k8s.io
spec:
  group: metrics.k8s.io
  groupPriorityMinimum: 100
  insecureSkipTLSVerify: true
  service:
    name: metrics-server
    namespace: kube-system
  version: v1beta1
  versionPriority: 100

NOTE: Make sure the metrics-server has
--kubelet-insecure-tlsas argument as we are using self signed certificate but ideally this certificate should be signed by the cluster CA Authority. so, we are instructing to skip verifying the Kubelet's TLS certificate.
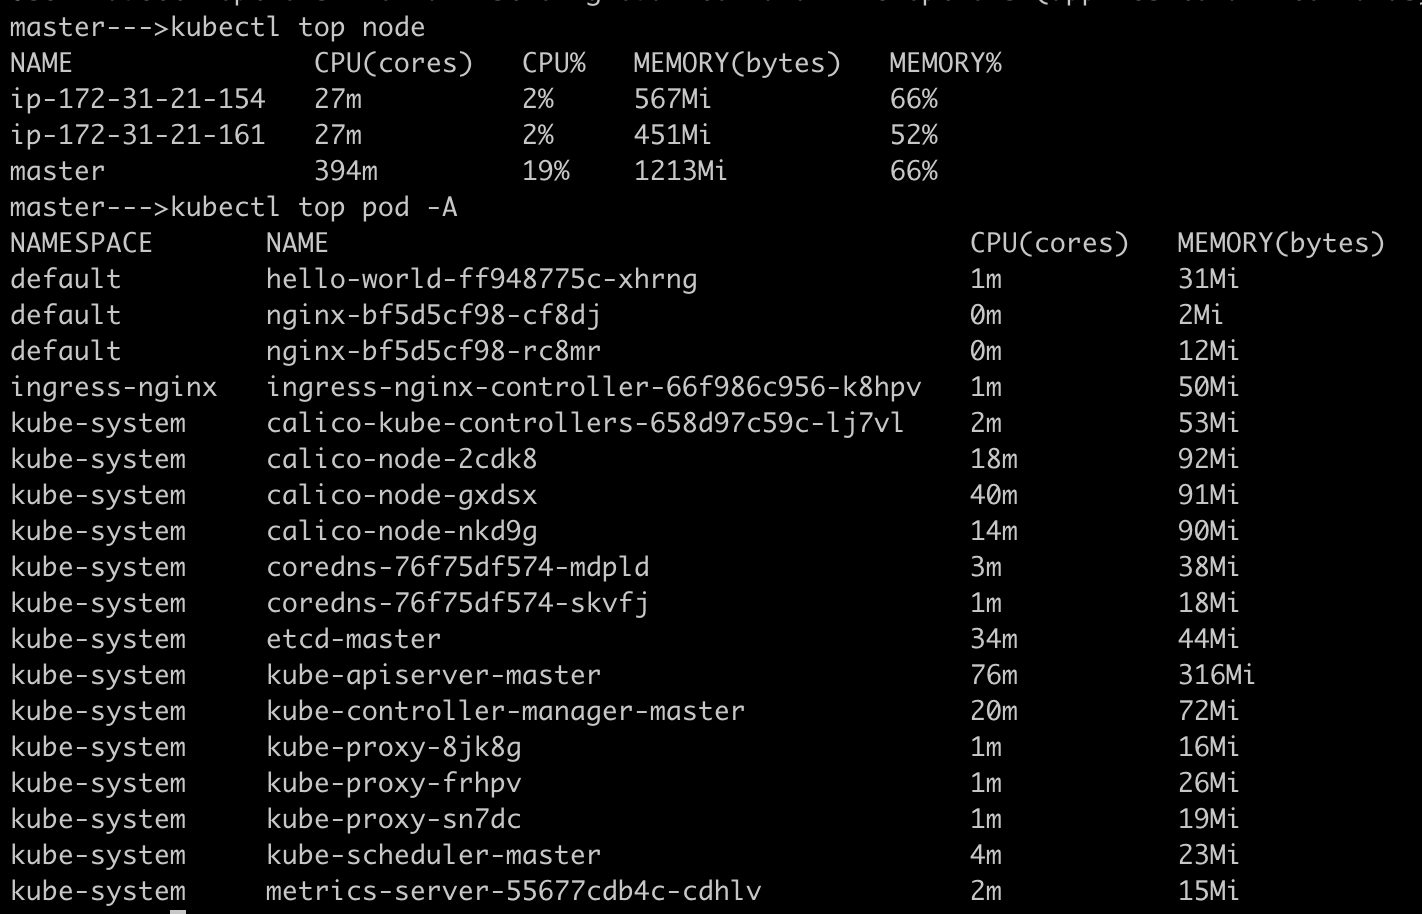
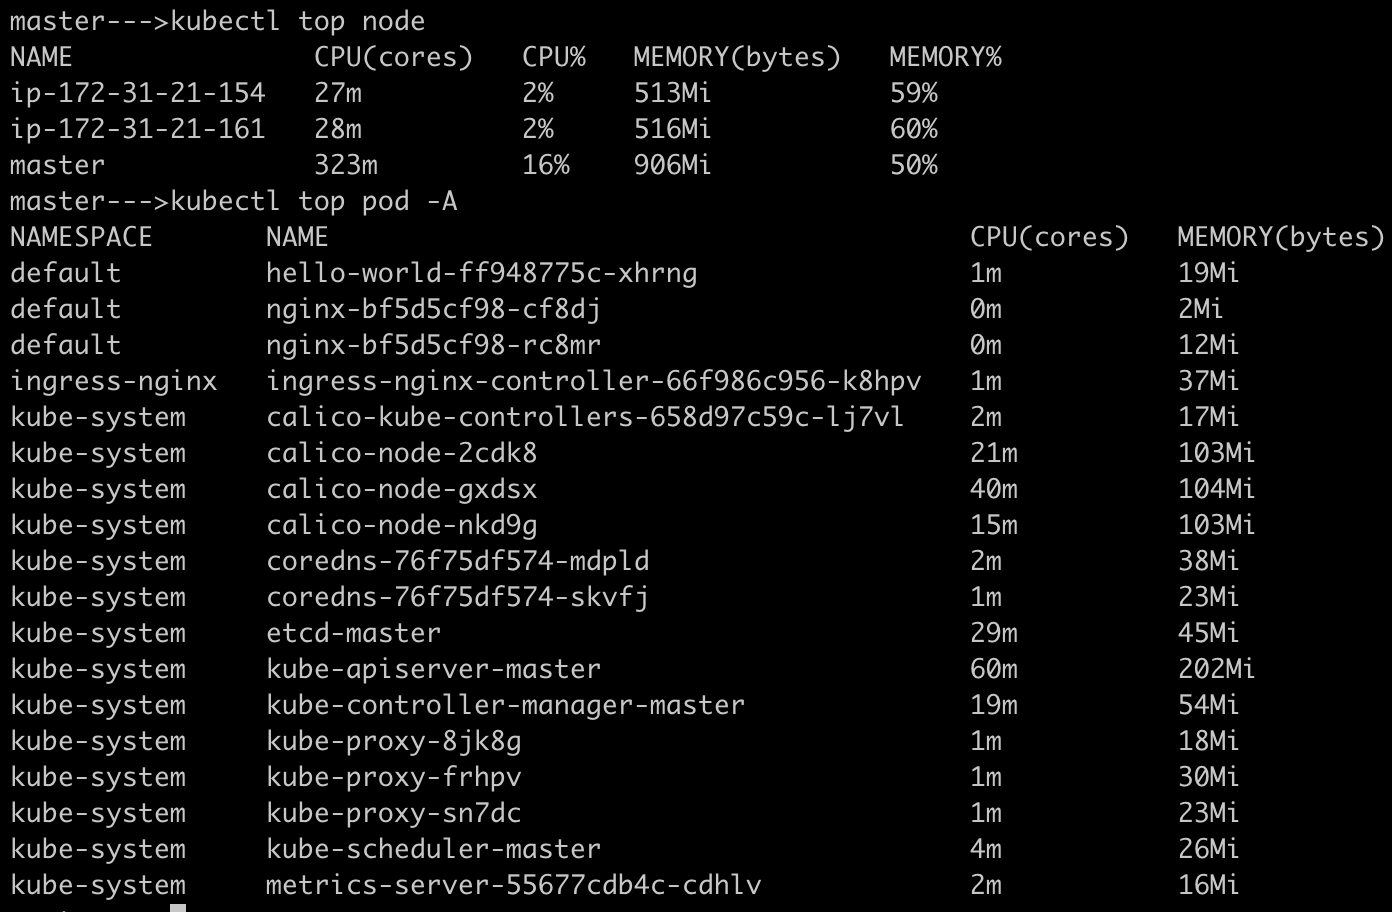
When you hit kubectl top command the request goes to api-server and it gives the metrics data collected form metrics server

Let's stop the api-server pod by moving the static manifest file from
/etc/kubernetes/manifestsdir totmpdir
This clearly shows that kubectl client won't work as api-server itself is down. The api-server listening on
172.31.82.45on port6443isn't available now.As part of troubleshooting, use
crictlto find out what's going on with api-server pod(container level)
If you encounter the error mentioned above, it means
crictldoesn't have enough permissions to talk to api-server on a UNIX socket/var/run/containerd/containerd.sock.Let's assign required permissions to
crictlto be able to talk to api-server
As all control-plane components runs as static pods, meaning they should be running as containers and hence
crictlutility is used to list out the running containers.The above picture shows that
api-servercontainer isn't running.Now, add the api-server manifest back to the
/etc/kubernetes/manifestsfolder and this will restart the api-server pod.
Now, api-server pod is up and running and ready to accept the requests from client kubectl.

#Kubernetes #Kubeadm #Logging #Monitoring #Observability #Alerting #Metrics-server #Multinodecluster #40DaysofKubernetes #CKASeries
Subscribe to my newsletter
Read articles from Gopi Vivek Manne directly inside your inbox. Subscribe to the newsletter, and don't miss out.
Written by

Gopi Vivek Manne
Gopi Vivek Manne
I'm Gopi Vivek Manne, a passionate DevOps Cloud Engineer with a strong focus on AWS cloud migrations. I have expertise in a range of technologies, including AWS, Linux, Jenkins, Bitbucket, GitHub Actions, Terraform, Docker, Kubernetes, Ansible, SonarQube, JUnit, AppScan, Prometheus, Grafana, Zabbix, and container orchestration. I'm constantly learning and exploring new ways to optimize and automate workflows, and I enjoy sharing my experiences and knowledge with others in the tech community. Follow me for insights, tips, and best practices on all things DevOps and cloud engineering!