Essential Svelte Chart Library for Developers
 Michael Amachree
A Question
Have you ever spent what feels like an eternity scouring the web for the perfect charting library, only to come up empty-handed? That was me today while working on my Svelte Mini Apps project. I needed a library that was:
Easy to Use: Seamlessly integrates with Svelte 4 and 5 for a smooth development experience.
Feature-Rich: Capable of creating a variety of charts to visualize data beautifully.
Well-Maintained: Actively developed with a supportive community.
Stable: Reliable and consistent in performance, even in complex scenarios.
Accessible: Meets accessibility standards to ensure your charts are usable by everyone.
So, I embarked on a quest, diving deep into the world of Svelte charting libraries. I explored some popular options like Pancake, Svelte Frappe Charts, Layer Cake, Unovis Svelte, Svelte FusionCharts, and Svelte Heatmap. While Svelte Heatmap did work, it was limited in capabilities and had some console errors suggesting it might soon become outdated. The other libraries posed various issues, from compatibility problems to missing features, which hampered my ability to effectively visualize my data.
Frustration and a Glimmer of Hope
After hours of scouring Google, began to feel discouraged. Maybe I’d have to build my own library or, even worse, resort to low-level SVG manipulation!
Just when all hope seemed lost, a ray of sunshine broke through the clouds! I stumbled upon a library in my browsing history—a hidden gem I had encountered months ago. This could be it!
The Hero Emerges: LayerChart!
With a hint of nervous anticipation, I revisited the library: LayerChart. And guess what? It worked flawlessly! LayerChart seamlessly integrated with Svelte, offering a wide range of chart types and an incredibly easy-to-use API.
More About LayerChart
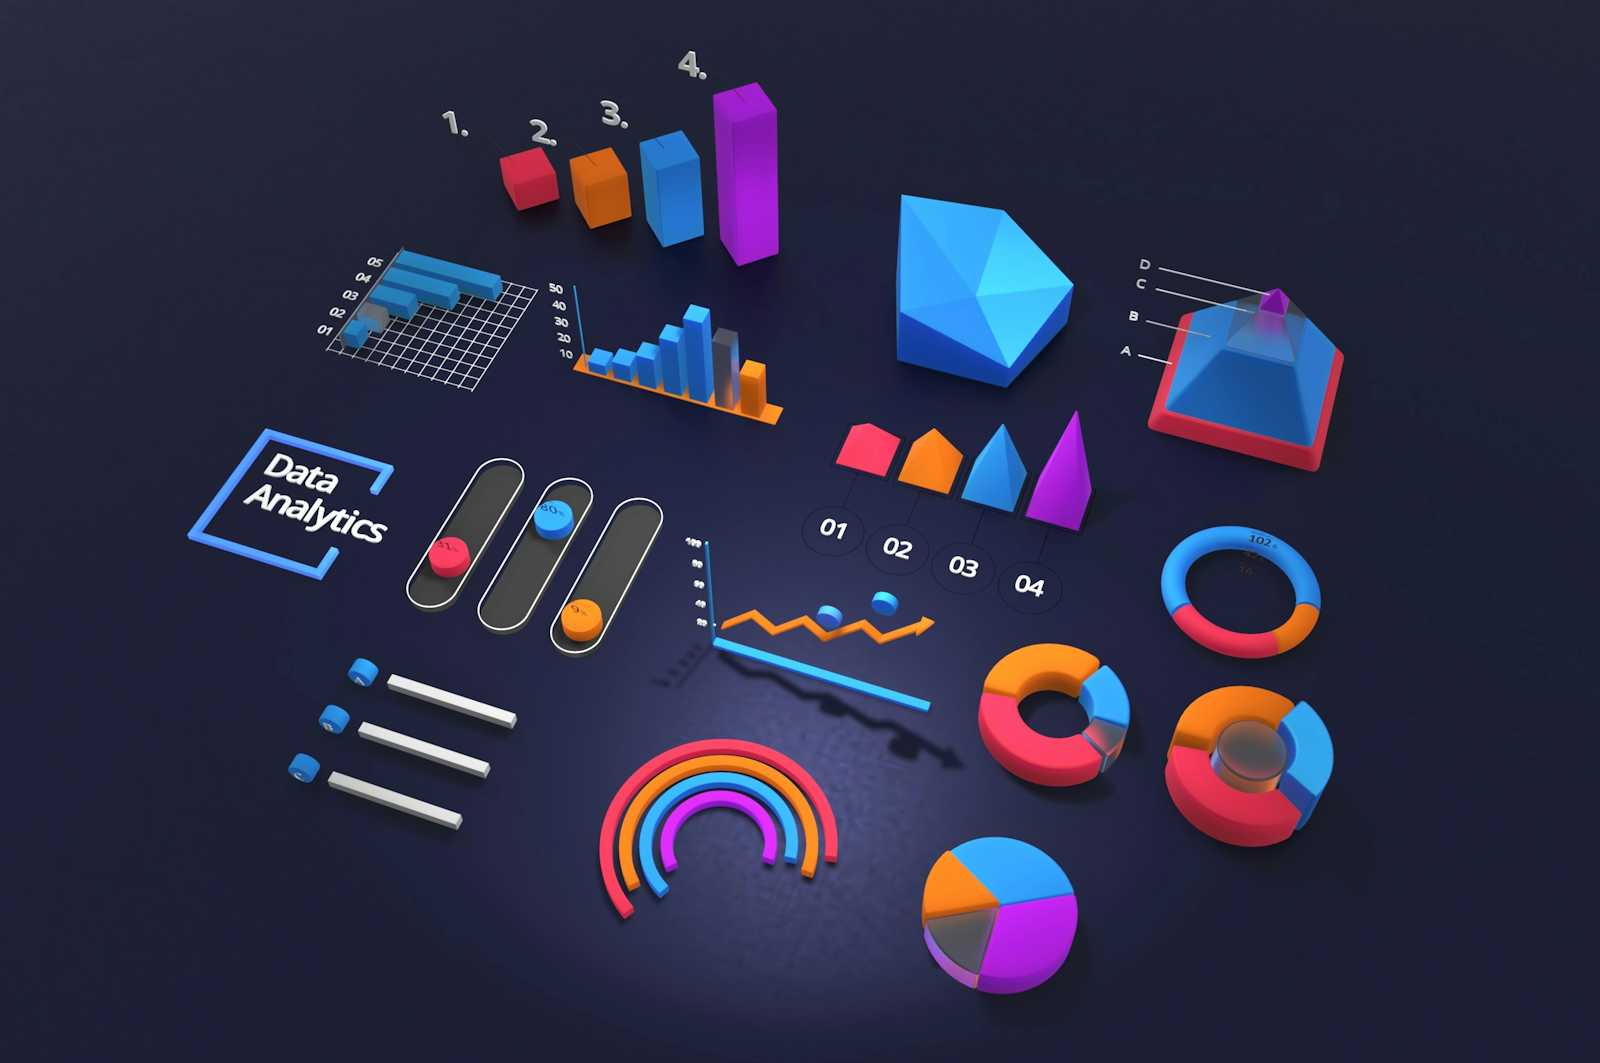
LayerChart offers a comprehensive collection of chart components for Svelte, allowing you to create an impressive range of visualizations. Built on the Layer Cake framework, it covers:
Cartesian charts: Bar, Area, Stack, Line, Scatter
Radial charts: Pie, Arc, Sunburst, Donut
Hierarchy charts: Tree, Treemap, Pack, Sunburst
Graph charts: Sankey, Network
Geo charts: Choropleth, Spike, Bubble, Point, Globe
These components are highly customizable and interactive, supporting features like tooltips, legends, pan/zoom, and motion effects. Whether you're visualizing complex data hierarchies or creating interactive geo maps, LayerChart has you covered.
Why I’m Writing This
Here’s the truly surprising part: Despite being fantastic, LayerChart seemed to be under the radar. I couldn’t find any articles or blog posts about it. I searched high and low, but there were none. That’s why I felt compelled to write this— to shine a light on this amazing library and share my experience.
LayerChart isn’t just a great charting library; it’s also completely free and open-source! They even have a companion component library for Svelte called Svelte UX. Don’t worry, I wasn’t paid to say this (as I mentioned, it’s entirely free and open-source). I simply admire the fantastic work put into this project and want to see it get the recognition it deserves.
So, the next time you’re on the hunt for a Svelte charting library, don’t overlook LayerChart! You might just find your happy ending, just like I did. Feel free to share your experiences with LayerChart (or any other Svelte charting library you love and use) in the comments below. Let’s help each other out on this Svelte journey and build a stronger community of Svelte developers together. I’m eager to hear what you’re using these days and learn from your experiences.
Subscribe to my newsletter
Read articles from Michael Amachree directly inside your inbox. Subscribe to the newsletter, and don't miss out.
Written by
