Optimize Your AI Workflow: Leveraging Data Science Stack, MicroK8s, MLflow, and JupyterHub for Effective ML Environment
 Pronod Bharatiya
As the world of data science and machine learning (ML) continues to evolve, the demand for efficient, reproducible, and easily manageable ML environments has never been greater. Data scientists and ML engineers often face the challenge of setting up complex development environments that can be both time-consuming and error-prone. However, with the introduction of the Data Science Stack (DSS), this task has become significantly easier, allowing practitioners to focus on what truly matters: their data and models. In this blog post, we will explore DSS and how it simplifies the process of creating ML environments on your workstation.
Understanding the Data Science Stack (DSS)
DSS is a ready-to-run environment designed specifically for machine learning and data science applications. Built on open-source tools like MicroK8s, JupyterLab, and MLFlow, it provides a streamlined platform for ML development. The beauty of DSS lies in its usability across any Ubuntu or Snap-enabled workstation, making it a versatile choice for data professionals.
Key Features of DSS
Containerized Environments: DSS allows for the management of containerized ML environments using a command-line interface (CLI). This includes popular ML frameworks such as TensorFlow and PyTorch.
Isolation and Reproducibility: One of the significant challenges in ML development is ensuring that environments are reproducible. DSS provides isolated environments that can be easily recreated, ensuring that results are consistent and reliable.
GPU Utilization: DSS makes full use of the workstation's GPU capabilities, enabling faster computations and improved performance for demanding ML tasks.
Quick Setup: Both beginners and experienced engineers can reduce their setup time to a minimum, allowing them to start working on meaningful tasks within minutes.
The Importance of a Robust ML Environment
In the realm of data science, having a robust ML environment is crucial for several reasons:
Reproducibility: The ability to reproduce results is fundamental in scientific research. DSS ensures that the environments are consistent across different runs.
Collaboration: A standardized environment allows teams to collaborate more effectively, as everyone can work within the same setup.
Scalability: As projects grow, having a flexible environment that can scale with the project’s needs is essential.
Practical Tip: Assess Your Needs
Before diving into DSS, take a moment to assess your specific requirements. Consider the types of projects you will be working on, the libraries and frameworks you will need, and whether you will be collaborating with others. This assessment will guide your installation and configuration of DSS.
Installing Data Science Stack (DSS) on Your Linux Distribution
Installing DSS is straightforward, with detailed instructions available for various Linux distributions. Here’s a brief overview:
Supported Distributions
Arch Linux
CentOS
Debian
Elementary OS
Fedora
KDE Neon
Kubuntu
Manjaro
Pop!_OS
OpenSUSE
Red Hat Enterprise Linux
Ubuntu
If your distribution isn’t listed, refer to the Snapd installation documentation.
Review of Installation Steps
Install Snapd: Make sure you have Snapd installed on your system.
Install MicroK8s: This lightweight Kubernetes distribution is essential for managing your ML environments.
sudo snap install microk8s --classicInstall DSS: Use Snap to install DSS.
sudo snap install dss --classicInitialize DSS: After installation, initialize DSS on your MicroK8s Kubernetes cluster.
dss initialize --kubeconfig "$(sudo microk8s config)"Verify Installation: Check the status of DSS to ensure everything is running smoothly.
dss status
By following these steps, you can have DSS up and running on your machine in no time. For details see -
Using DSS for ML, DL, and AI Projects
Once you have installed DSS and MicroK8s, the next step is to utilize it effectively for your machine learning (ML), deep learning (DL), and artificial intelligence (AI) projects. Below, we will explore various commands and functionalities available in DSS that will aid in managing your ML environments.
Starting and Stopping DSS Components
Understanding how to start, stop, and monitor various components within DSS is essential. Here are the key commands to manage your DSS environment:
Initialize DSS
dss initialize --kubeconfig "$(sudo microk8s config)"
Create Jupyter Notebook
dss create scipy-nb --image kubeflownotebookswg/jupyter-scipy:v1.8.0
Start DSS
To start notebook inside DSS, use the following command:
dss start scipy-nb
Stop DSS
If you need to stop DSS, simply run:
dss stop scipy-nb
Monitoring Status (MLFlow)
To check the status of key components within DSS, use:
dss status
Access Notebooks
Once a notebook is created, you can access it by finding the notebook URL. Use the
dss list
command to retrieve the URL associated with your notebook. Enter this URL into your web browser to access the Notebook UI.
Managing Jupyter Notebooks Effectively
Jupyter Notebooks serve as an essential asset for data scientists, offering a dynamic platform for coding, visualization, and analytical tasks. With the Data Science Stack (DSS), managing Jupyter Notebooks becomes a straightforward process.
The command dss create enables users to generate Jupyter Notebooks within the DSS ecosystem, automatically linking them to MLflow for comprehensive experiment tracking. During the notebook creation process, you have the flexibility to select the appropriate image tailored to your specific needs. These images come pre-configured to support a variety of machine learning frameworks, including PyTorch and TensorFlow, and can be optimized for GPU usage, including options for CUDA or Intel-specific enhancements.
For those setting up Jupyter Notebooks in JupyterHub, there are six recommended images to choose from, designed for distinct use cases with both PyTorch and TensorFlow. Each image pair caters to different processing capabilities, including options for CPU-only, NVIDIA GPU, and Intel CPU and GPU configurations. These pre-built images are fully integrated with MLflow and MicroK8s, ensuring a smooth and efficient workflow for data science projects.
PyTorch Images
For CPU Only
Image:
kubeflownotebookswg/jupyter-pytorch-full:v1.8.0Command to Create Notebook
dss create <name-of-your-notebook> --image=kubeflownotebookswg/jupyter-pytorch-full:v1.8.0Replace
<name-of-your-notebook>with the name of your choice, eg.tf-nb. This image is designed for running machine learning models using the PyTorch framework, one of the most popular libraries for deep learning and neural networks.Full version of PyTorch, ideal for general-purpose machine learning and deep learning tasks.
- Suitable for workstations without GPU acceleration, providing all the necessary tools to run PyTorch in a CPU-only environment.
For NVIDIA GPU
Image:
kubeflownotebookswg/jupyter-pytorch-cuda-full:v1.8.0Command to Create Notebook
dss create <name-of-your-notebook> --image=kubeflownotebookswg/jupyter-pytorch-cuda-full:v1.8.0This image is also built for PyTorch, but with CUDA support, enabling hardware acceleration via NVIDIA GPUs.
Includes PyTorch and CUDA integration, which allows users to offload computationally intensive tasks to NVIDIA GPUs.
- Ideal for faster training and inference of machine learning models on systems equipped with NVIDIA GPUs.
For Intel CPU and GPU
Image:
intel/intel-extension-for-pytorch:2.1.20-xpu-idp-jupyterCommand to Create Notebook
dss create <name-of-your-notebook> --image=intel/intel-extension-for-pytorch:2.1.20-xpu-idp-jupyterThis image is specifically designed for Intel hardware, using the Intel Extension for PyTorch to accelerate performance on Intel CPUs and GPUs.
Provides better performance on Intel CPUs, integrated graphics, or discrete GPUs like Intel's Xe series.
Suitable for users working on Intel hardware who need PyTorch acceleration.
TensorFlow Images
For CPU Only
Image:
kubeflownotebookswg/jupyter-tensorflow-full:v1.8.0Command to Create Notebook
dss create <name-of-your-notebook> --image=kubeflownotebookswg/jupyter-tensorflow-full:v1.8.0This image is built for running machine learning models using TensorFlow, another leading deep learning framework.
Full version of TensorFlow, suitable for building, training, and deploying machine learning models.
- Great for users without GPU acceleration who want to run TensorFlow-based applications on a CPU.
For NVIDIA GPU
Image:
kubeflownotebookswg/jupyter-tensorflow-cuda-full:v1.8.0Command to Create Notebook
dss create <name-of-your-notebook> --image=kubeflownotebookswg/jupyter-tensorflow-cuda-full:v1.8.0Similar to the PyTorch CUDA image, this TensorFlow variant is optimized to leverage CUDA for GPU acceleration.
Contains TensorFlow with integrated CUDA support, enabling efficient training and inference on NVIDIA GPUs.
- Suitable for users with access to powerful NVIDIA GPUs who need faster execution for TensorFlow-based workloads.
For Intel CPU and GPU
Image:
intel/intel-extension-for-tensorflow:2.15.0-xpu-idp-jupyterCommand to Create Notebook
dss create <name-of-your-notebook> --image=intel/intel-extension-for-tensorflow:2.15.0-xpu-idp-jupyterThis image is optimized for Intel hardware and includes the Intel Extension for TensorFlow, which enhances TensorFlow’s performance on Intel CPUs and GPUs.
Specially optimized for Intel hardware, providing accelerated TensorFlow operations.
* Ideal for users running TensorFlow workloads on Intel platforms, including Intel CPUs and integrated or discrete GPUs.
* Accelerates both training and inference tasks for TensorFlow models on Intel hardware.
These images can be easily initialized in your JupyterHub environment using the commands provided. They come fully integrated with MLflow and MicroK8s, allowing you to focus on your data science projects without worrying about the underlying configuration.
Listing Notebooks
To view all created notebooks within your DSS environment, use:
dss list
This command provides you with an overview of your notebooks, including their status.
Accessing Notebooks
Once a notebook is created, accessing it is simple. To find the notebook URL, use the dss list command to retrieve the URL associated with your notebook. Enter this URL into your web browser to access the Notebook UI.
On running dss list command you will get something similar output in your terminal. You will just need to copy-paste the URL of the notebook on your favorite browser on which you want to work upon.
pb@star:~$ dss list

 Name        Image                           URL
 py-cuda-nb  kubeflownotebookswg/jupyter-    http://10.152.183.98:80
             pytorch-cuda-full:v1.8.0
 pytorch-nb  kubeflownotebookswg/jupyter-    http://10.152.183.197:80
             pytorch-full:v1.8.0
Note -
CUDA Support: Images with CUDA support (such as
pytorch-cudaandtensorflow-cuda) are designed for users with NVIDIA GPUs and require CUDA to be installed on the workstation.Intel Support: Images with Intel-specific optimizations (such as
pytorch-intelandtensorflow-intel) take advantage of Intel’s hardware extensions and provide a boost in performance for users with Intel CPUs or GPUs.Version Numbers: The version numbers like
v1.8.0or2.15.0refer to the versions of the frameworks (PyTorch or TensorFlow) and their extensions, ensuring compatibility and access to the latest features of the respective libraries.
Notebook States
Understanding the different states of notebooks is crucial for effective management:
Active: The notebook is running and accessible.
Stopped: The notebook is not currently running.
Starting: The notebook is initializing and will soon be active.
Stopping: The notebook is in the process of stopping.
Downloading: The notebook is downloading the specified image.
Removing: The notebook is being removed.
Stopping and Removing Notebooks
To stop a running notebook, use
dss stop <name-of-your-notebook>
eg:
dss stop py-cuda-nb
To remove a notebook from DSS, the command is as follows
dss remove <name-of-your-notebook>
eg:
dss remove py-cuda-nb
Getting Notebook Logs
To retrieve logs for a specific notebook, use the following command
dss logs <name-of-your-notebook>
eg:
dss logs py-cuda-nb
This feature is essential for troubleshooting and monitoring your notebooks’ performance.
Integrating MLflow with DSS
MLflow is an open-source platform designed to manage the machine learning lifecycle, including experimentation, reproducibility, and deployment. It comes per-configured with the data science stack. However, you will need to integrate it with every notebook you work upon. Integrating MLflow with Notebook allows you to effectively track your experiments, share and deploy models, and manage your ML workflow seamlessly.
Installing MLflow in Jupyter Notebook
To use MLflow in your notebook environment, you'll need to install the MLflow Python library. It's advisable to install it directly within a notebook cell, as this method ensures the installation remains intact as long as the notebook is running. In contrast, using alternative methods will result in MLflow being removed each time the notebook is stopped. Keep in mind that installations done through the second method, the notebook won’t persist after a restart. For consistent integration across sessions, the first method is the better choice. These commands are not to be run in terminal but on the notebook on which you are suppose to work and integrate with MLFlow.
%%bash
pip install mlflow
Alternatively, you can install it via the notebook terminal.
!pip install mlflow
Connecting to MLflow
After installing MLflow, you can easily connect to the MLflow server configured for your DSS environment. Here’s an example of how to initialize the MLflow client and create a new experiment:
import mlflow

c = mlflow.MlflowClient()
print(c.tracking_uri)

c.create_experiment("test-experiment")
The MLFLOW_TRACKING_URI is already set in your environment, allowing you to focus on your experiments without manual configuration. After running the above command on your notebook you will get output something like this -
http://mlflow.dss.svc.cluster.local:5000

'110013409712180504'
The first line will be a clickable link to access MLFlow dashboard, but it will not work. The send one is Experiment ID or the Artifact Location: mlflow-artifacts. To access the MLFlow dashboard you will need to go back to your terminal and access the MLFlow UI as explained below.
Accessing MLflow UI
To access the MLflow UI and manage your experiments, use the command:
dss status
The output in your terminal will look something like this -
pb@star:~$ dss status
MLflow deployment: Ready
MLflow URL: http://10.152.183.217:5000
NVIDIA GPU acceleration: Disabled
Intel GPU acceleration: Disabled
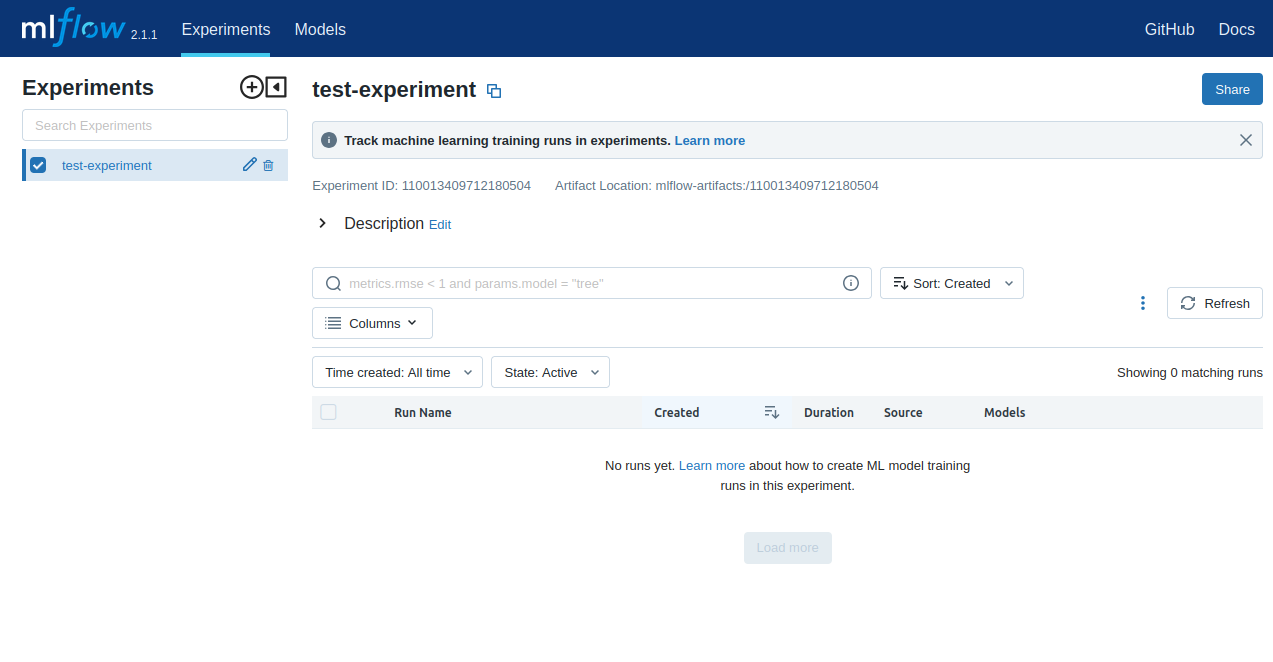
This will provide you with the URL to access the MLflow UI. Just copy past the URL on your favorite browser and the output will look similar to this -

Please note the following on the MLFlow UI -
Experiment ID: 110013409712180504
Artifact Location: mlflow-artifacts:/110013409712180504
and the output at your notebook after running the experiment test code block -
- '110013409712180504'
Both are same confirming the access of notebook models inside MLFlow UI.
Retrieving MLflow Logs and Artifacts
You can retrieve MLflow logs using:
dss logs --mlflow
For accessing MLflow artifacts, including models and experiments, you can download them directly from the MLflow UI. This streamlined process ensures that you have all the necessary data at your fingertips.
Accessing Your Data from DSS
Accessing stored data from your notebooks is essential for browsing or modifying files. DSS provides a CLI for easy data management.
Finding Your Data Directory
By default, your notebook data is stored in the following directory.
/var/snap/microk8s/common/default-storage
To find the specific directory for your stored notebooks, list the directories in the above path, you will need to type the below command in your terminal.
cd /var/snap/microk8s/common/default-storage/
ls
You will see an output resembling:
pb@star:~$ ls /var/snap/microk8s/common/default-storage/
dss-mlflow-pvc-899ef0a3-18fd-4f21-b303-291c71e06b40
dss-notebooks-pvc-93529822-ac36-428f-9672-62fadad6533b
The directory prefixed with dss-notebooks-pvc is where your notebook data is stored.
Navigating to Your Data
From your local file browser, navigate to the folder:
/var/snap/microk8s/common/default-storage/[directory name]
eg. -
/var/snap/microk8s/common/default-storage/dss-notebooks-pvc
Here, replace [directory name] with the specific directory name obtained from the previous step. You can now view and manage all your stored notebooks’ data.
Managing MicroK8s Commands
MicroK8s provides a powerful CLI for managing Kubernetes clusters. Understanding the available commands is essential for effective cluster management. Here’s an overview of some of the most useful commands:
Key MicroK8s Commands
Start/Stop: Start or stop your MicroK8s instance.
microk8s stopGet Nodes: View the nodes in your cluster.
sudo microk8s kubectl get nodesIt will prompt for terminal password and once you type the password, you will get something similar the output -
  pb@star:~$ sudo microk8s kubectl get nodes
  [sudo] password for pb:
  NAME   STATUS   ROLES    AGE   VERSION
  star   Ready    <none>   20h   v1.28.13
Get Pods: Check the status of pods.
sudo microk8s kubectl get pods --all-namespacesYou will get something similar output.
    pb@star:~$ sudo microk8s kubectl get pods --all-namespaces
    NAMESPACE     NAME                                     READY   STATUS    RESTARTS       AGE
    dss           mlflow-7fcf655ff9-fqpp5                  1/1     Running   1 (174m ago)   14h
    dss           py-cuda-nb-77cccf8f67-8k97p              1/1     Running   1 (174m ago)   13h
    dss           pytorch-nb-5b5df4db75-qbk7d              1/1     Running   1 (174m ago)   13h
    kube-system   calico-kube-controllers-77bd7c5b-6xbx4   1/1     Running   2 (174m ago)   20h
    kube-system   calico-node-2vtvn                        1/1     Running   2 (174m ago)   20h
    kube-system   coredns-864597b5fd-td9x8                 1/1     Running   2 (174m ago)   20h
    kube-system   hostpath-provisioner-7df77bc496-vh9sc    1/1     Running   2 (174m ago)   20h
    kube-system   metrics-server-848968bdcd-bbrqd          1/1     Running   2 (174m ago)   20h
Enable Add-ons: Activate essential add-ons such as the dashboard or metrics server.
  sudo microk8s enable dashboard
  sudo microk8s enable metrics-server
Manage Deployments: Create and manage deployments within your cluster.
microk8s kubectl create deployment nginx --image=nginx
Accessing Kubernetes Dashboard
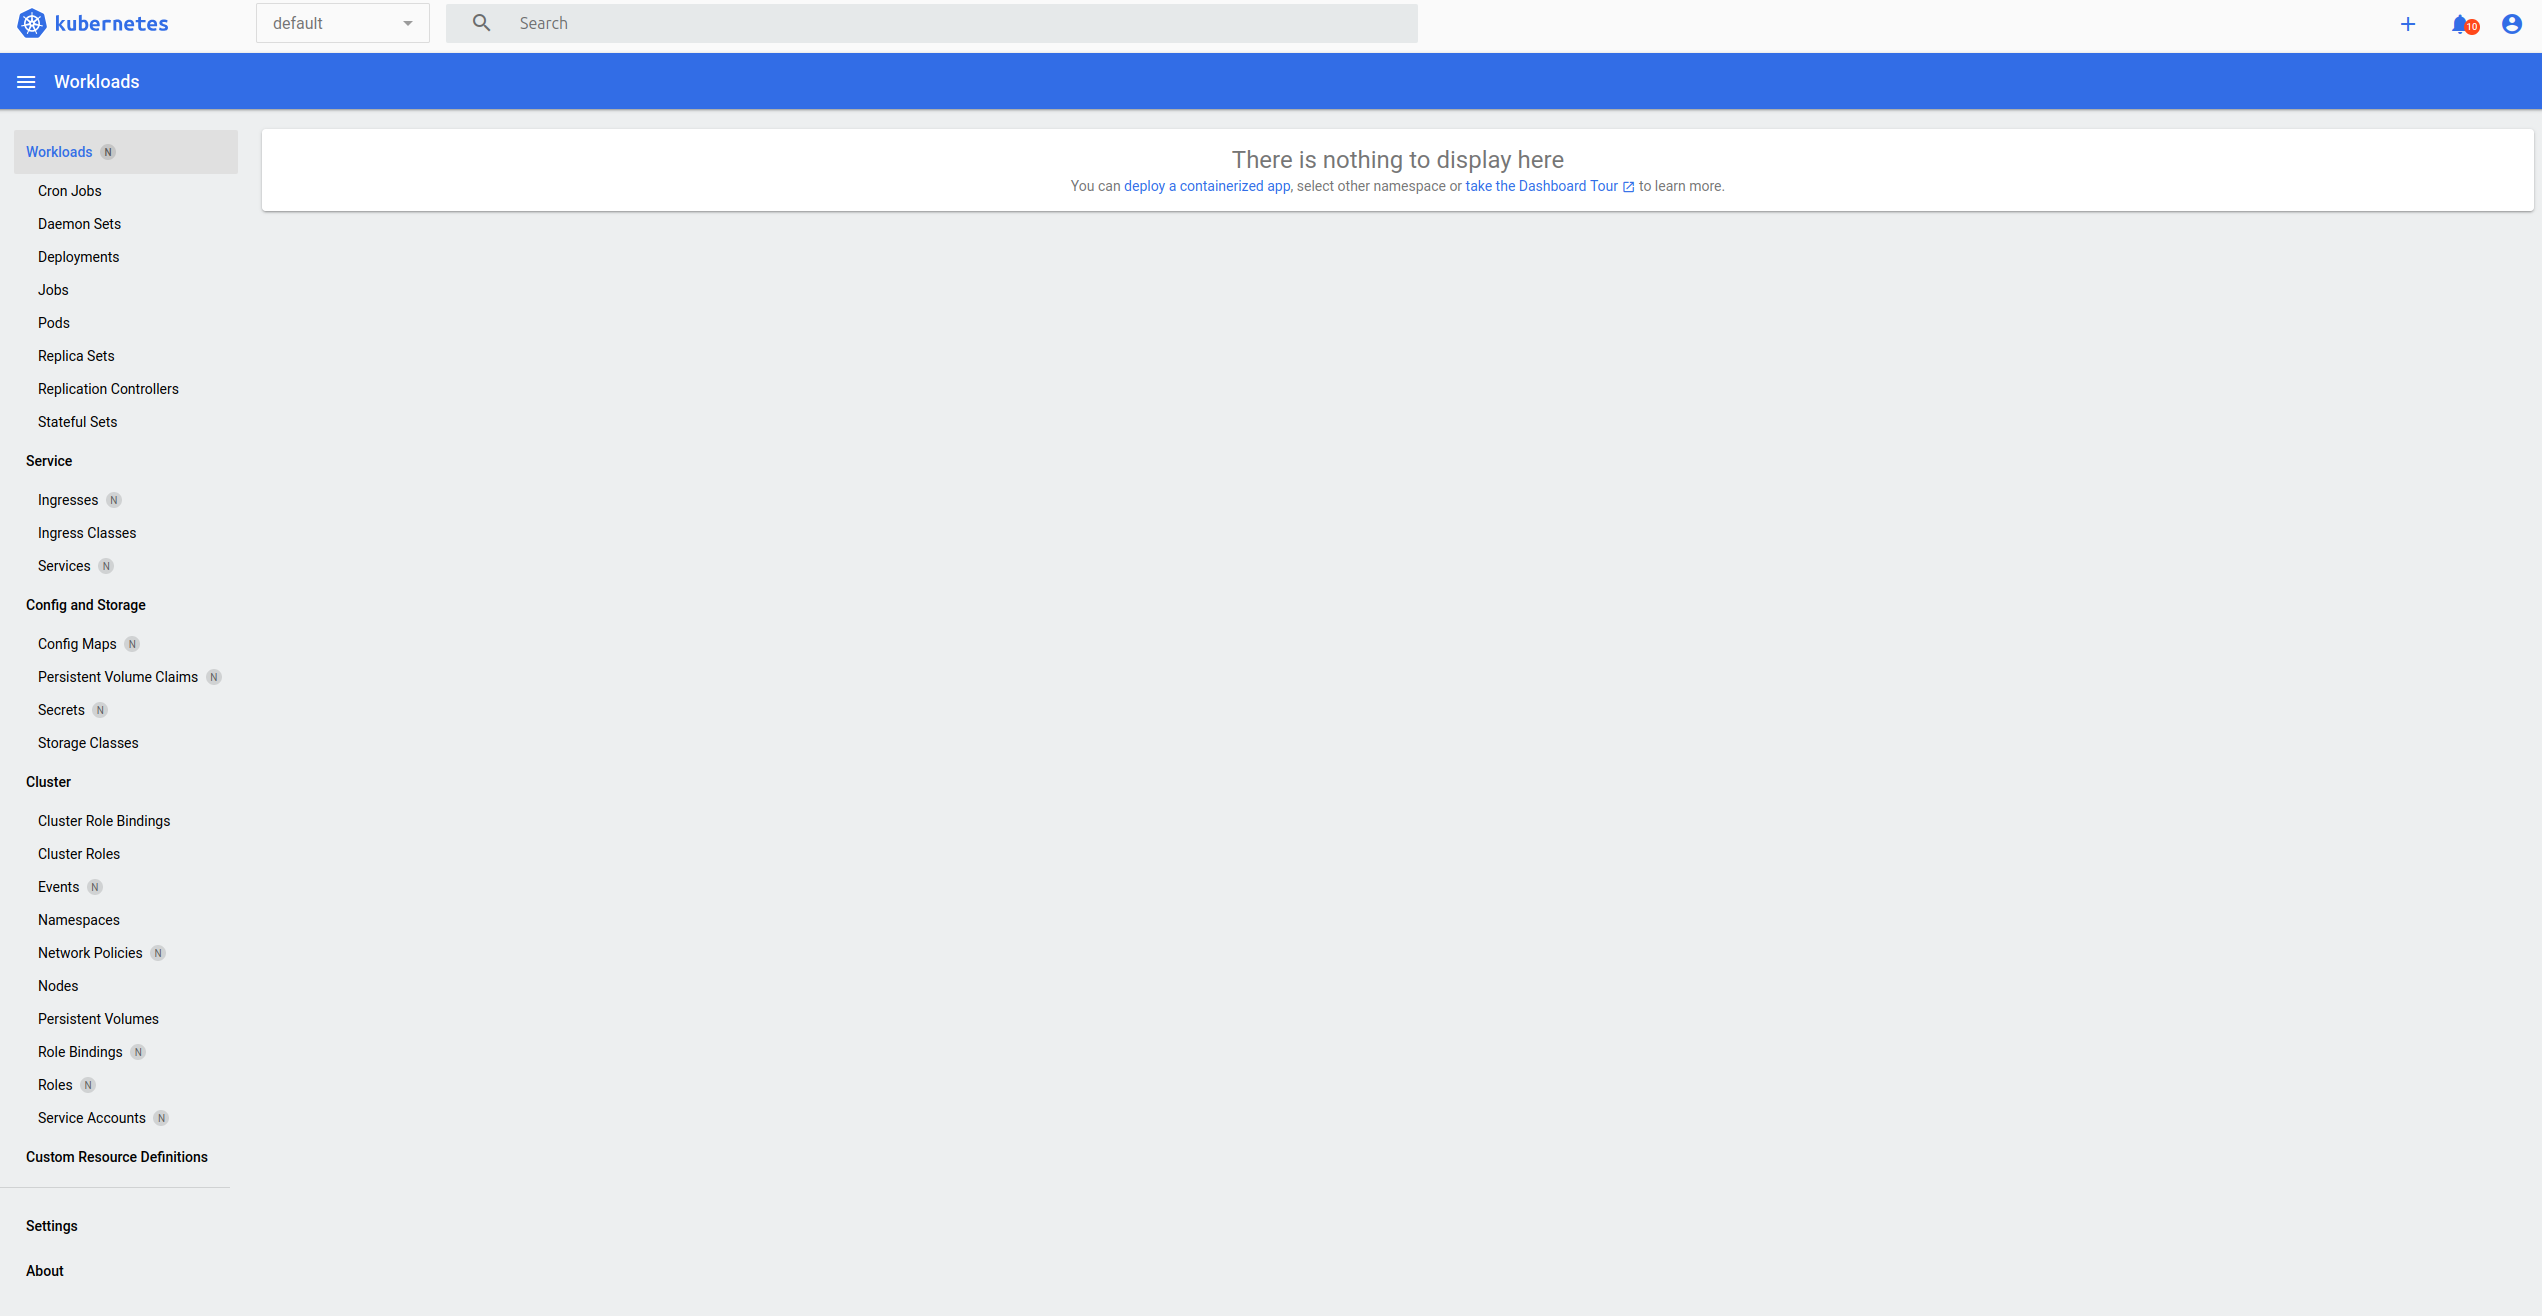
To access the Kubernetes dashboard for a visual representation of your clusters, use:
sudo microk8s dashboard-proxy
This command will provide you with a URL to access the dashboard, where you can monitor your deployments and resources. You will get output similar to -
pb@star:~$ sudo microk8s dashboard-proxy
Checking if Dashboard is running.
Infer repository core for addon dashboard
Waiting for Dashboard to come up.
Trying to get token from microk8s-dashboard-token
Waiting for secret token (attempt 0)
Dashboard will be available at https://127.0.0.1:10445
Use the following token to login:
etJhbGciOiJSUzI1NiIsImtpkCI6IlB2VEo5cDBtNzhiNW04NGkvdHJFbVdRZ0NhZjdjNGhkV2VaZ0xwNWtqQVkifQ.eyJpc3MiOiJrdWJlcm5ldGVzL3NlcnZpY2VhY2NvdW50Iiwia3ViZXJuZXRlcy5pby9zZXJ2aWNlYWNjb3VudC9uYW1lc3BhY2UiOiJrdWJlLXN5c3RlbSIsImt1YmVybmV0ZXMuaW8vc2VydmljZWFjY291bnQvc2VjcmV0Lm5hbWUiOiJtaWNyb2s4cy1kYXNoYm9hcmQtdG9rZW4iLCJrdWJlcm5ldGVzLmlvL3NlcnZpY2VhY2NvdW50L3NlcnZpY2UtYWNjb3VudC5uYW1lIjoiZGVmYXVsdCIsImt1YmVybmV0ZXMuaW8vc2VydmljZWFjY291bnQvc2VydmljZS1hY2NvdW50LnVpZCI6IjgyNWI0M2FhLWU1ZDYtNGQ0Zi04NDExLWY1ZmQwYTEwZTc0OCIsInN1YiI6InN5c3RlbTpzZXJ2aWNlYWNjb3VudDprdWJlLXN5c3RlbTpkZWZhdWx0In0.HQum8FA1YKkmrECCku44GnvlQ2SbY6zWR9DWX5IVesaRbj5_Nd2Fd0ovYFdHTcHX_0k88hHLQBUb_QbguLllNWdmIprUhNf_3gY-bQ7hKfRhgf7TeX1x4so6Bt7zwTx3TXkkFVV3lnPgjCYBIXLOoFVOahQZgosuVJFw31_cxE14UNiunfmad1tTKaPM4zp86E-xfopDlrJwF2AtovEQ8KPj8qgrlOZkVlAxFLXlkuMGCIsc57uYUI6b6DAkRcOrJ9u_vxbJVrULAuR20H1vV8QlmPL7VuTKi_L0rKVLKGx3fYXxRkqbN080foFYZ6pGI0tSOcfT78KkN4B_uHLQqw
E0918 09:04:33.885238  302344 portforward.go:394] error copying from local connection to remote stream: writeto tcp4 127.0.0.1:10443->127.0.0.1:46780: read tcp4 127.0.0.1:10443->127.0.0.1:46780: read: connection reset by peer
E0918 09:04:32.885586  302344 portforward.go:394] error copying from local connection to remote stream: writeto tcp4 127.0.0.1:10443->127.0.0.1:46784: read tcp4 127.0.0.1:10443->127.0.0.1:46784: read: connection reset by peer
On copy and pasting the URL on your favorite browser you will prompt to warning message similar to below -

Go to advance tab - you will get similar interface -

Click on the accept the risk and continue and you will get -

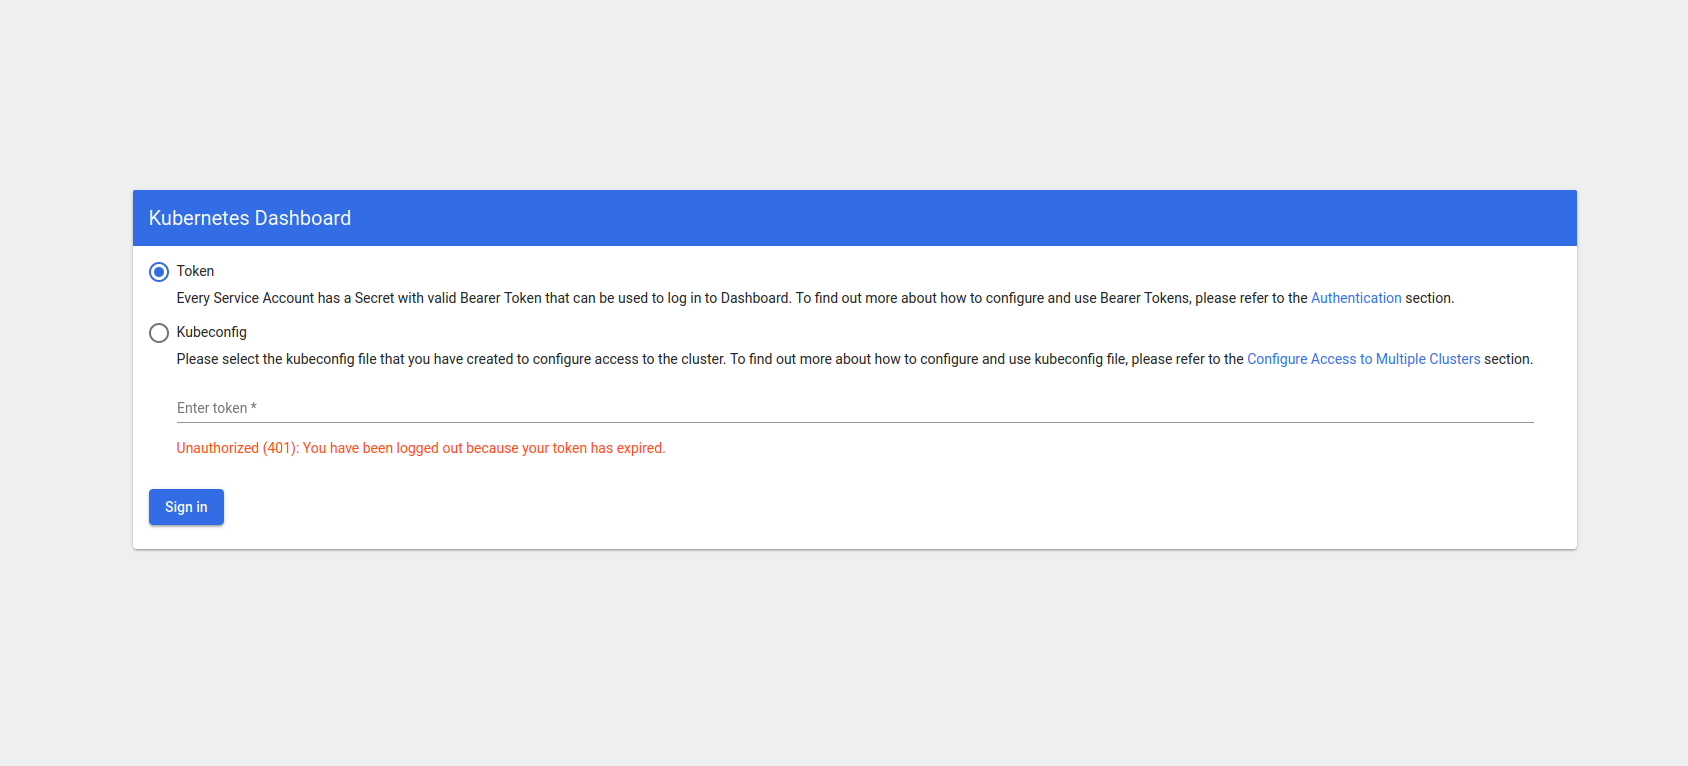
Paste the token from the terminal output in Enter token section and click on Sign In butoon. You will prompt to the micrik8s UI which will look like -

Troubleshooting for microk8s UI login
If by mistake you shout down the microk8s UI or by any means it is closed, on attempting to log in to the UI again you will get error. Check -
Check if the MicroK8s Dashboard is Already Running
It is possible that the dashboard service is already running. You can check the status of the service:
Run the following command
sudo microk8s status --wait-ready
To re-login to the UI you will need to follow these steps one by one -
Find and Stop the Process Using Port 10443
You can check what process is using port 10443 and stop it
Run the following command to identify the process using the port:
sudo lsof -i :10443
This will give you the process ID (PID) of the application using the port.
it's safe to do so, stop the process:
sudo kill -9 <PID>
Retry the microk8s dashboard-proxy command:
sudo microk8s dashboard-proxy
You will be good to go again.
Conclusion
In this blog post, we’ve explored the Data Science Stack (DSS) and how it simplifies the creation and management of machine learning environments on your workstation. By leveraging open-source tools like MicroK8s, JupyterLab, and MLFlow, DSS provides a powerful yet accessible platform for data scientists and ML engineers. From easy installation to effective management of notebooks and seamless integration with MLflow, DSS offers a comprehensive solution to tackle the complexities of machine learning development.
Best Practices for Using DSS
Stay Updated: Regularly check for updates to DSS and its components to benefit from new features and bug fixes.
Documentation: Familiarize yourself with the official documentation for DSS, MicroK8s, and MLflow to leverage their full potential.
Experiment Management: Utilize MLflow to keep track of your experiments, models, and metrics for effective project management.
Backup Data: Regularly back up your data to prevent loss and ensure reproducibility.
By adopting these best practices and utilizing DSS effectively, you can enhance your machine learning workflows and drive better outcomes in your projects. Happy coding!
Subscribe to my newsletter
Read articles from Pronod Bharatiya directly inside your inbox. Subscribe to the newsletter, and don't miss out.
Written by

Pronod Bharatiya
Pronod Bharatiya
As a passionate Machine Learning and Deep Learning enthusiast, I document my learning journey on Hashnode. My experience encompasses various projects, from exploring foundational algorithms to implementing advanced neural networks. I enjoy breaking down complex concepts into digestible insights, making them accessible for all. Join me as I share my thoughts, tutorials, and tips to navigate the exciting world of ML and DL. Connect with me on LinkedIn to explore collaboration opportunities!