Tracing 5G Core Network Messages in free5GC
 Lobna Ahmed
In the previous article, the first 5G user test was conducted and the logs of each 5GC network function were checked to verify the UE registration and PDU session establishment procedures.
However, telecom engineers usually work with network traces more than logs. This article illustrates how can tcpdump traces be collected from free5GC containerized network functions and displayed using Wireshark (a network packet analyzer).
Before collecting network traces a little knowledge about docker networking would be helpful to understand free5GC containers networking.
Each host machine usually has some interfaces which can be used for networking. These interfaces belongs to the default network namespace. In Linux, a network namespace provides isolation of the system resources associated with networking.
Host interfaces can be checked using this command
ip address show

The screenshot shows that the host has two interfaces, the first interface is a loopback interface named lo and the second is an ethernet interface named ens3.
To list network namespaces, the following command can be used
sudo lsns --type=net

The output shows one network namespace, which is the default namespace.
Let’s now check what happens once docker compose command is run to create free5GC containers (free5GC installation steps using docker compose has been explained in a previous article).
docker compose up -d
Once docker compose command is used to create free5GC containers, the following happen:
A new network namespace is created for each container in order to provide isolated network resources for the containers.
lsnscommand can be used to check the newly created network namespaces as shown below.
A bridge named
br-free5gcis created (a bridge in Linux behaves as a network switch, i.e. forwarding packets between interfaces that are connected to it). This can be verified by usingip address showcommand as shown below. The bridge is associated with network10.100.200.0/24.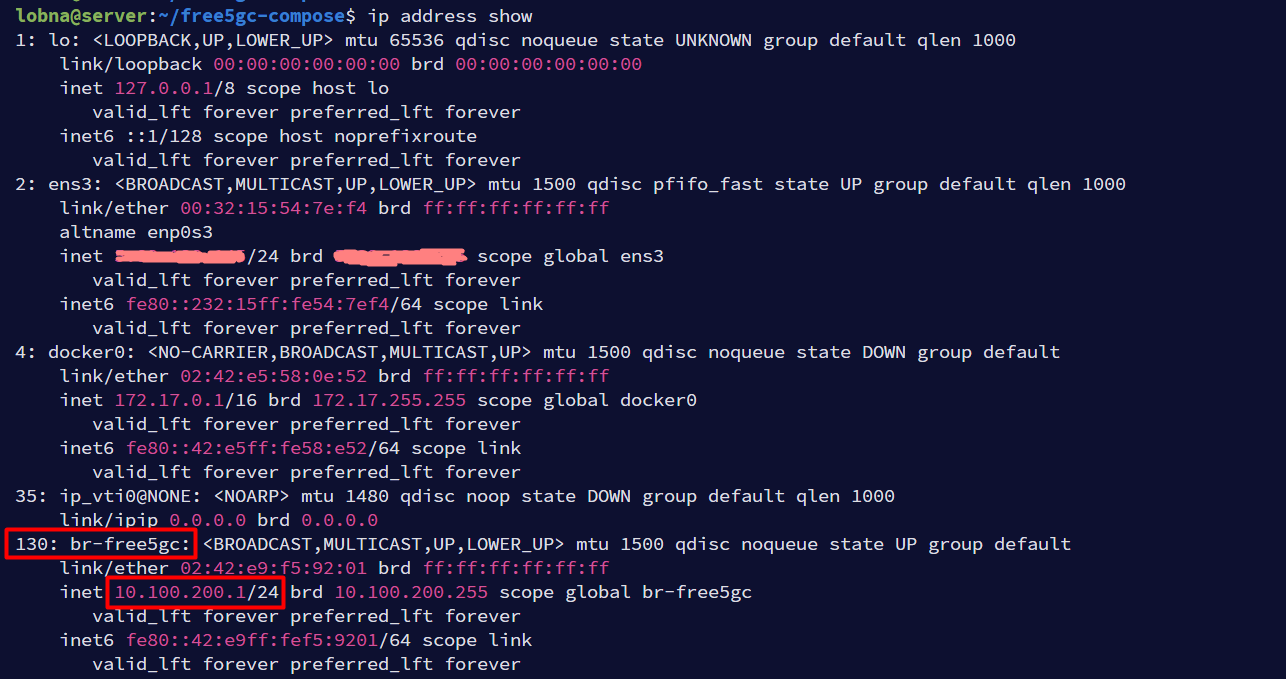
Additionally, many other virtual ethernet interface pairs (
veth pair) are created, oneveth pairfor each container. Aveth pairoperates in pairs, where one end of the pair resides inside a network namespace (i.e. inside the container network namespace), and the other end resides outside in the default namespace (in this case on the bridgebr-free5gc, we can think of it as a port on the bridge). This can be verified by usingip address showcommand as shown below.
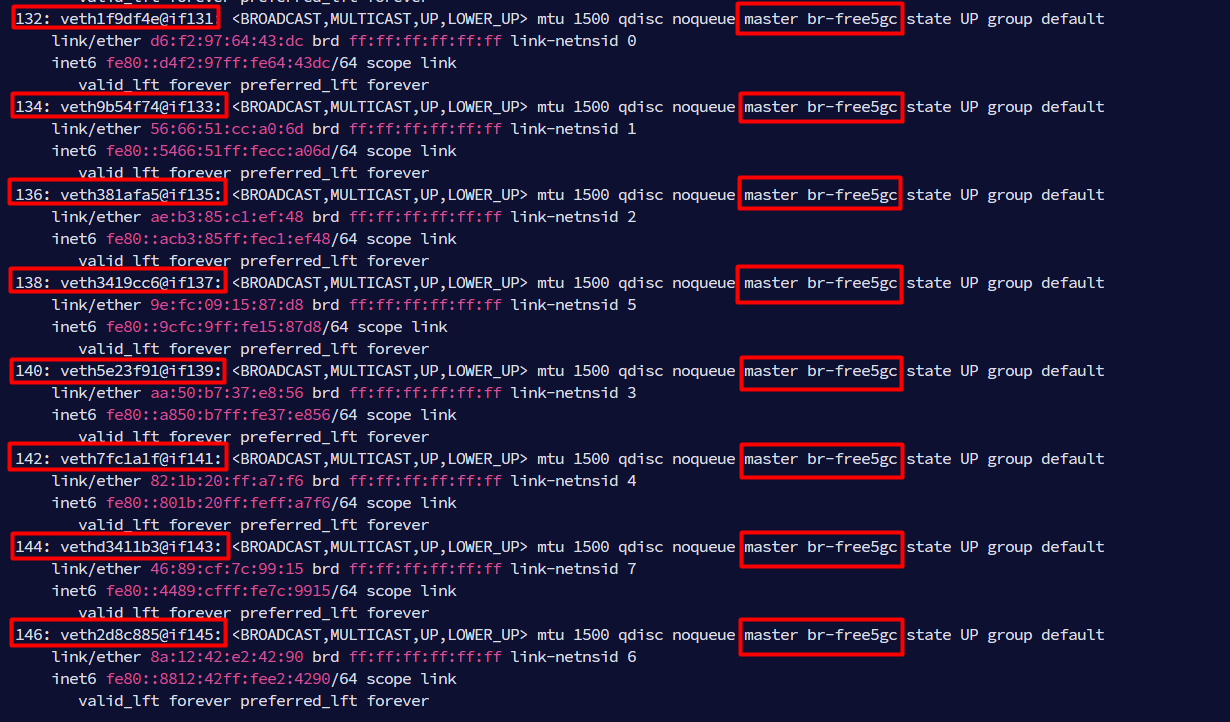
The following diagram can better illustrate the concept, taking AMF and SMF containers as an example. This means that free5GC containers can communicate with each other using the bridge br-free5gc which acts as a network switch.
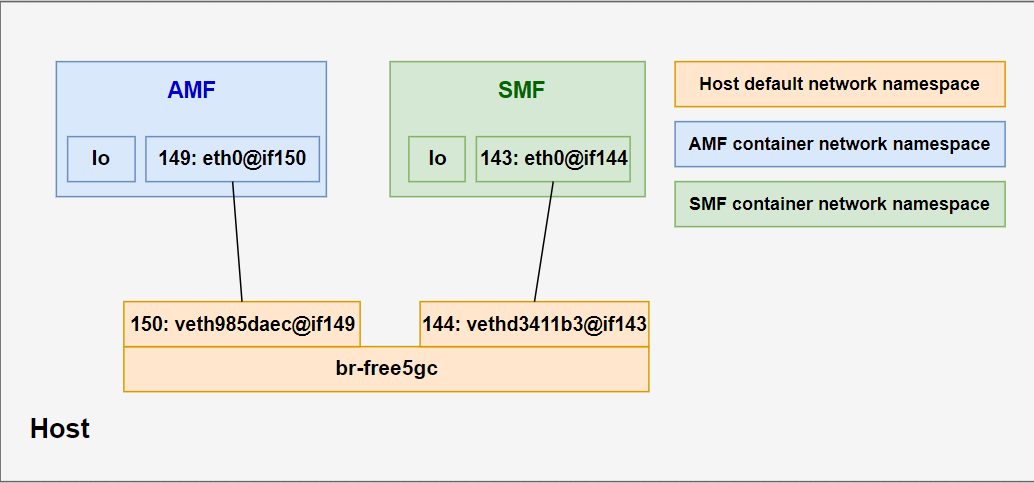
From the diagram above, if AMF traces need to be captured, tcpdump can be used on the veth pair interface end on the host side (the bridge) that is connected to AMF container namespace.
veth pair interface has a special notation that helps to identify which interface belongs to which container. Let’s take AMF as an example, we can run the following command to list the interfaces inside the AMF container
docker exec amf ip address show
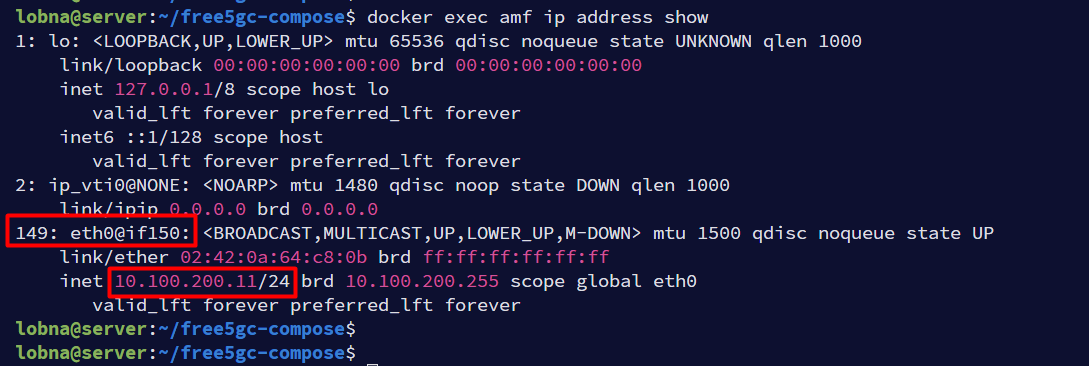
The output shows that AMF container has an interface numbered 149 which is eth0@if150, the interface number after the @ sign shows the interface number of veth pair end on the host side (the bridge) which is 150. Now all we need to do is to list interfaces on host and look for the interface number 150.

As shown in the screenshot, the interface number 150 is veth985daec@if149 and it has the same notation, with the interface number after the @ sign points to the interface number of veth pair end on the AMF container side which is 149.
Now since the interface connected to AMF has been identified, tcpdump command can be run on this interface to capture AMF traffic and save it to a file.
# Use interface name before the @ sign. For example if the interface is 'veth985daec@if149' use 'veth985daec' only in the tcpdump command
sudo tcpdump -i veth985daec -w amf.pcap

Then a 5G test UE can be triggered from UERANSIM container (as described in the previous article) to generate some network signaling that can be captured in AMF. Once captured the trace can be stopped using Ctrl+C.

List the directory content using ls -ltr to verify that AMF trace has been saved.

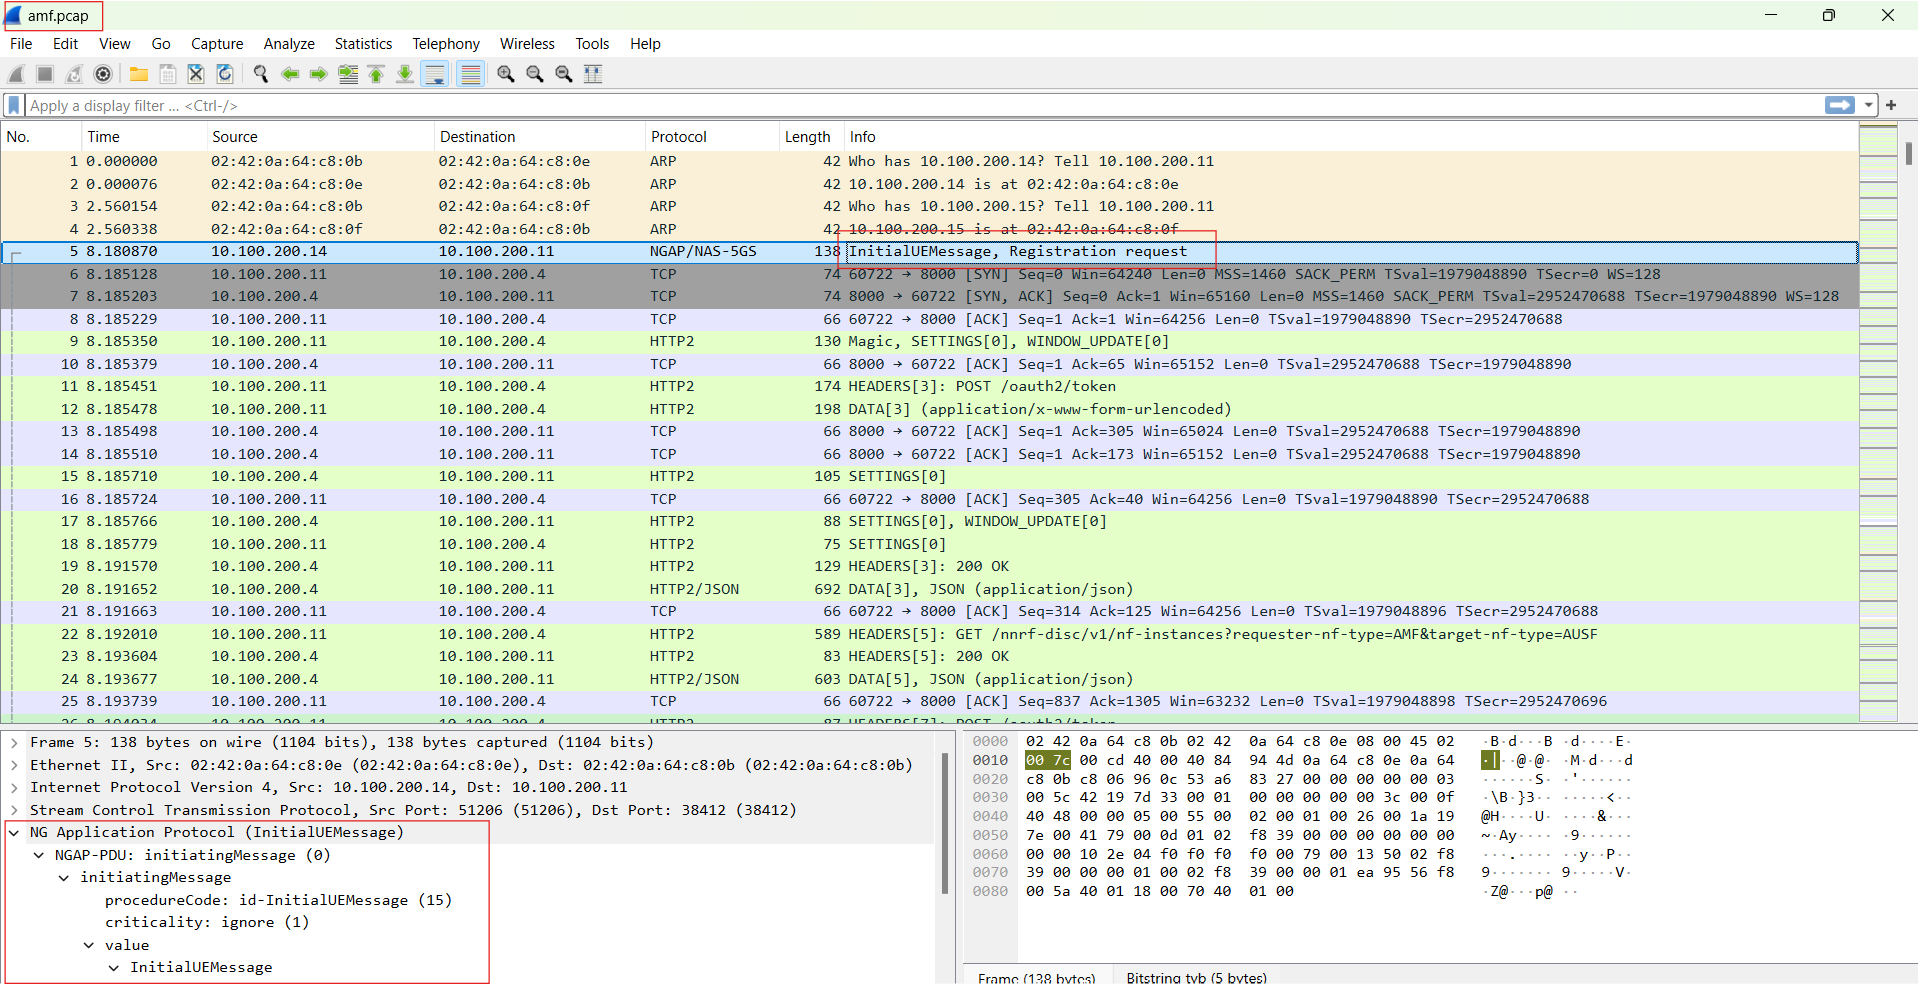
The trace can then be downloaded using any SFTP tool (in case you are using a VM or a remote machine) and displayed using Wireshark.
Wireshark Tip:
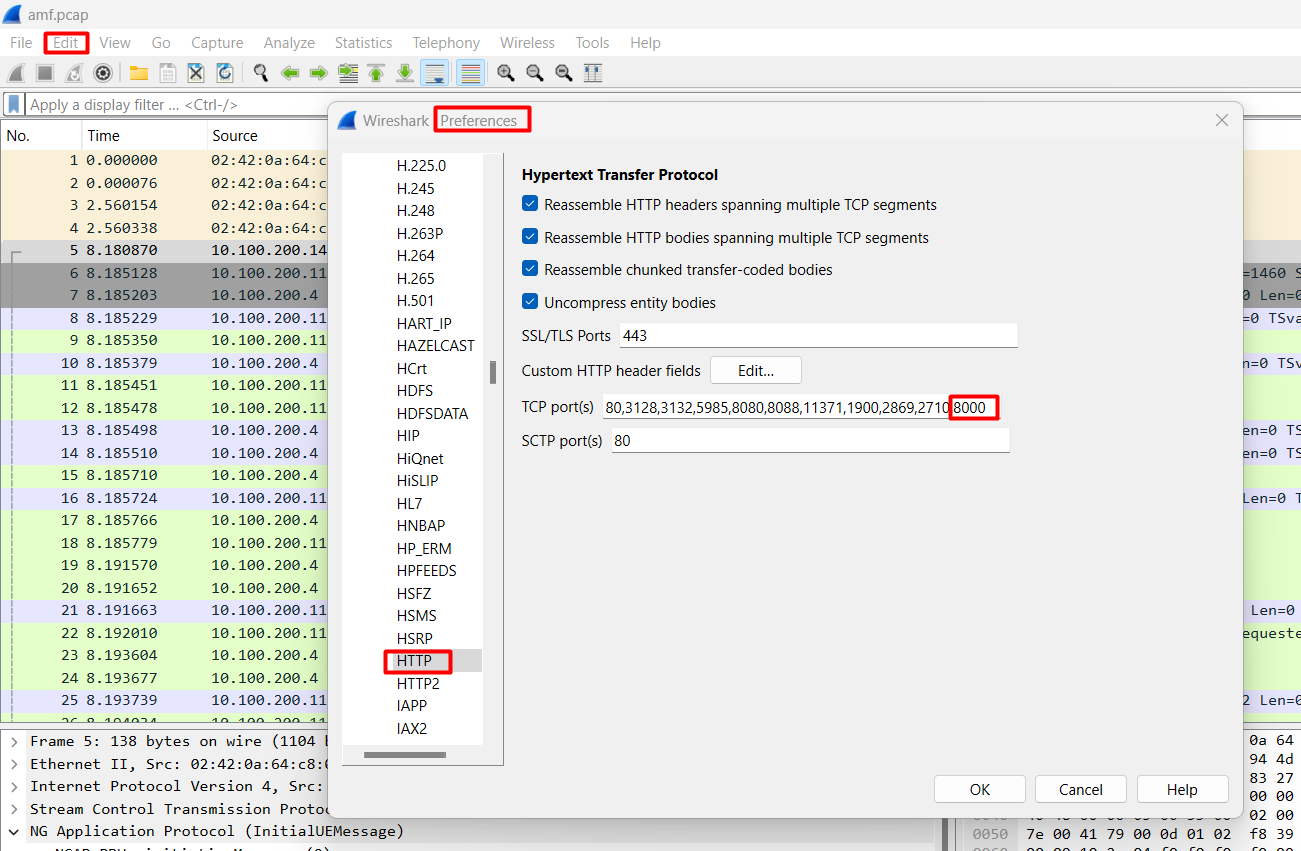
5GC network functions uses HTTP protocol in the SBI interfaces (between AMF and AUSF for example), if no HTTP packets are displayed in the trace, try to edit the preferences in Wireshark for HTTP protocol and add TCP port 8000 (which is the port that free5GC containers use for SBI), so that Wireshark can decode packets with TCP port 8000 as HTTP.
In the next article, we will start analyzing each of 5G Core procedures with the help of traces.
Subscribe to my newsletter
Read articles from Lobna Ahmed directly inside your inbox. Subscribe to the newsletter, and don't miss out.
Written by
