Overfitting and Training Error
 Kaustubh Kulkarni
1 min read
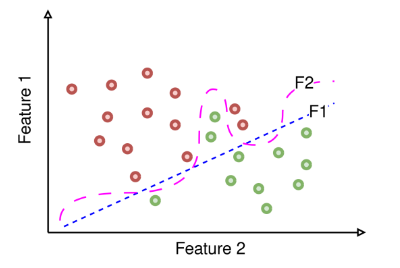
Here is a 2-dimensional plot showing two functions that classify data points into two classes. The red points belong to one class, and the green points belong to another. The dotted blue line (F1) and dashed pink line (F2) represent the two trained functions.

1. Overfitting:
Function F2 is the one that overfits the training data.
- Explanation: Overfitting occurs when a model is too complex and fits the training data too closely, including noise and outliers. This typically results in a very flexible decision boundary that may pass through or very close to most of the training points. If Function F2 shows a highly irregular or overly complex boundary that precisely separates the training points (even capturing noise), it is overfitting. In contrast, Function F1 might have a smoother decision boundary that generalizes better.
2. Training Error:
Function F1 will yield a higher training error.
- Explanation: Training error is the error rate on the training data. If Function F2 overfits, it means it has a lower training error because it fits the training data very closely. Function F1, which does not overfit and has a smoother decision boundary, might not fit all the training points perfectly and thus has a higher training error.
0
Subscribe to my newsletter
Read articles from Kaustubh Kulkarni directly inside your inbox. Subscribe to the newsletter, and don't miss out.
Written by
