Step-by-Step Procedure for Setting Up the OpenTelemetry Astronomy Shop Demo App in Docker with Splunk
 Sakeena Shaik
OpenTelemetry is an open-source observability framework that enables IT teams, DevOps engineers, and SREs to collect and standardize metrics, logs, and traces across distributed systems. It integrates with a wide range of monitoring tools like Splunk, Grafana, Jaeger, Prometheus, and others to provide real-time insights into application performance and reliability. By offering a unified view of system health, OpenTelemetry simplifies troubleshooting and helps optimize the performance of services across cloud-native environments.
✨Architecture
Check out below links for architecture diagrams
❖Splunk Observability Cloud architecture
❖OpenTelemetry Demo Architecture
✅PREREQUISITES
AWS account creation
Check out the official site to create aws account using below Here
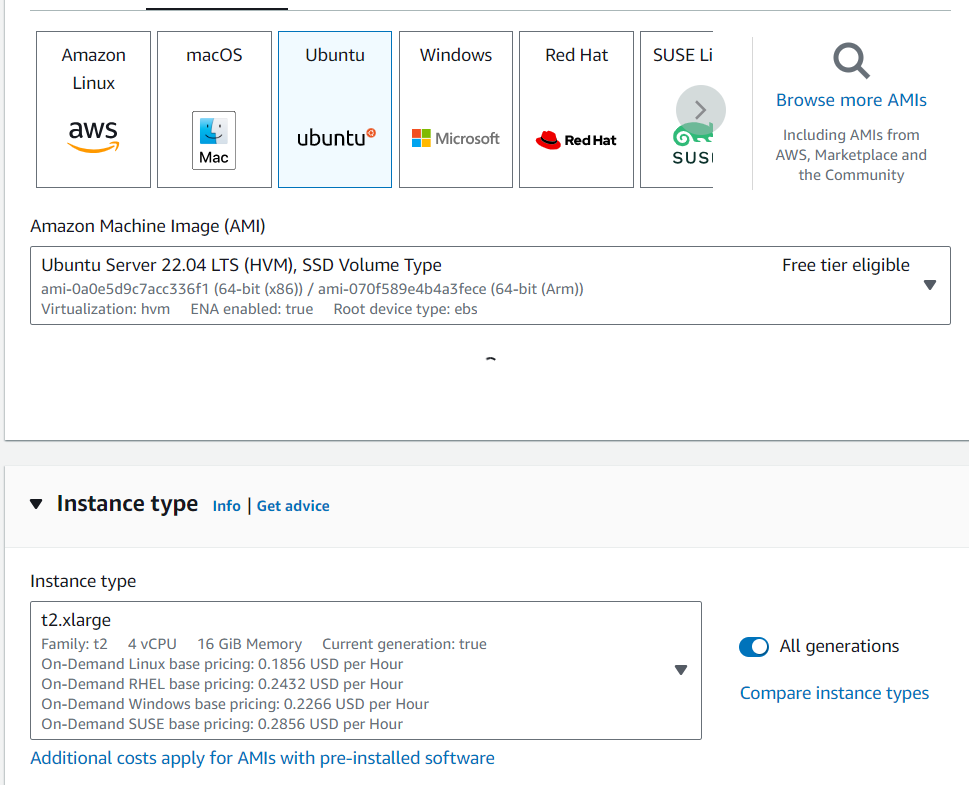
Create EC2 instance with following configurations
- Ubuntu 22- T2.xlarge (More than 6GB ram required)
- 20GB storage
GITHUB Account
Docker and Docker compose Installation
 # Add Docker's official GPG key:
 sudo apt-get update
 sudo apt-get install ca-certificates curl
 sudo install -m 0755 -d /etc/apt/keyrings
 sudo curl -fsSL https://download.docker.com/linux/ubuntu/gpg -o /etc/apt/keyrings/docker.asc
 sudo chmod a+r /etc/apt/keyrings/docker.asc

 # Add the repository to Apt sources:
 echo \
   "deb [arch=$(dpkg --print-architecture) signed-by=/etc/apt/keyrings/docker.asc] https://download.docker.com/linux/ubuntu \
   $(. /etc/os-release && echo "$VERSION_CODENAME") stable" | \
   sudo tee /etc/apt/sources.list.d/docker.list > /dev/null
 sudo apt-get update
 sudo apt-get install docker-ce docker-ce-cli containerd.io docker-buildx-plugin docker-compose-plugin
Splunk Observability Cloud
👉 Sign Up for Splunk Observability Cloud👉 Get started with a free trial of Splunk Observability Cloud by signing up here: Splunk Observability Cloud Free Trial.
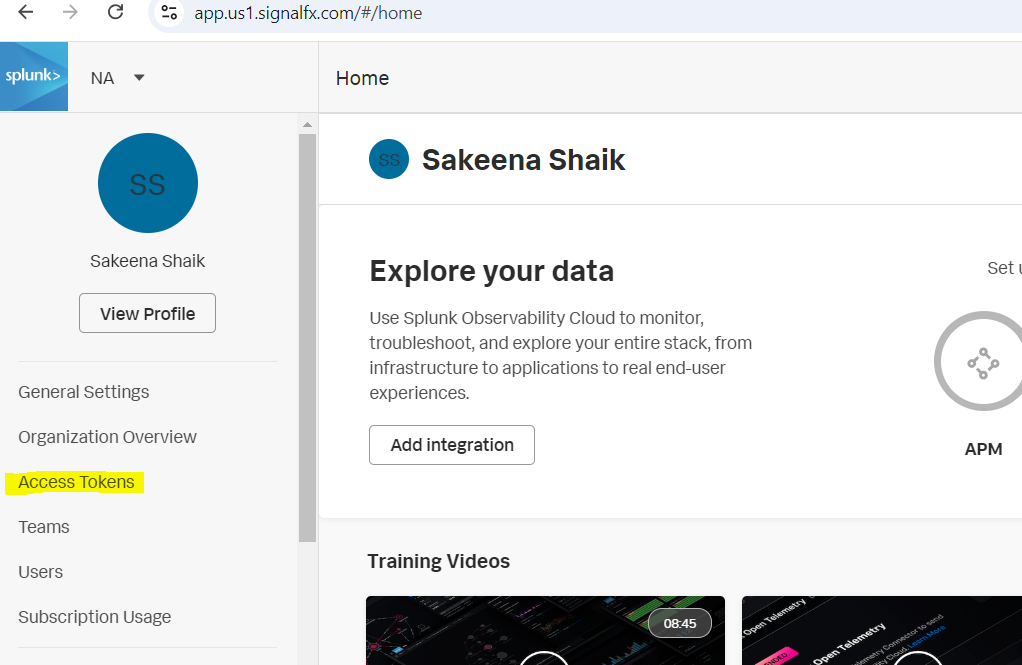
👉 Once you've set up your account, you'll receive a unique URL like this: https://app.us1.signalfx.com/#/home.
To send metrics and traces to Splunk Observability Cloud, you need to generate an access token. Follow these steps to create one:
»Log in to Splunk Observability Cloud and navigate to the Settings Wheel ☸.
»Go to Access Tokens and click New Token.
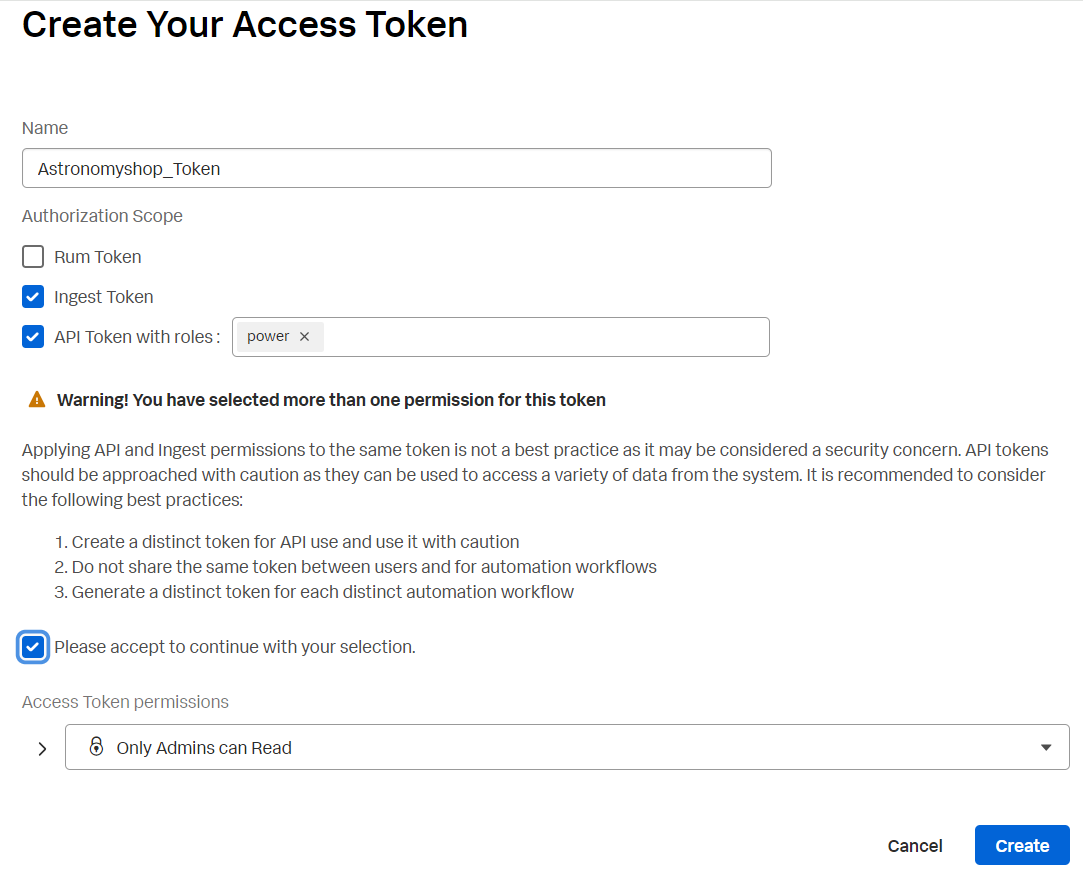
»Name Your Token (e.g., "AstronomyShop Token").
»Select Options for both ingest and API usage as shown in the screenshot

Splunk Cloud Platform
While the metrics and traces data will be ingested to Splunk Observability Cloud, we will be sending log data to Splunk cloud platform.
We will be running Splunk Cloud Platform using Docker on an AWS Ubuntu instance in later steps.
Let’s get in to the project:
🔷 𝐋𝐨𝐠𝐢𝐧 𝐭𝐨 𝐲𝐨𝐮𝐫 𝐄𝐂𝟐 𝐢𝐧𝐬𝐭𝐚𝐧𝐜𝐞 𝐰𝐢𝐭𝐡 𝐛𝐞𝐥𝐨𝐰 𝐫𝐞𝐪𝐮𝐢𝐫𝐞𝐦𝐞𝐧𝐭𝐬
🔷 𝐜𝐥𝐨𝐧𝐞 𝐭𝐡𝐞 𝐫𝐞𝐩𝐨𝐬𝐢𝐭𝐨𝐫𝐲
git clone https://github.com/Sakeena19/opentelemetry-demo.git
cd opentelemetry-demo/
𝖳𝗁𝖾 𝖻𝖾𝗅𝗈𝗐 𝖺𝗋𝖾 𝗍𝗁𝖾 𝗅𝗂𝗌𝗍 𝗈𝖿 𝖿𝗂𝗅𝖾𝗌 used in this project:
docker-compose.yml
opentelemetry-demo.yaml
otelcol-config-filelog.yml
otelcol-config-fluentd.yml
otelcol-config.yml
𝐖𝐡𝐚𝐭 𝐢𝐬 𝐃𝐨𝐜𝐤𝐞𝐫 𝐂𝐨𝐦𝐩𝐨𝐬𝐞?
𝐃𝐨𝐜𝐤𝐞𝐫 𝐂𝐨𝐦𝐩𝐨𝐬𝐞 𝐢𝐬 𝐚 𝐭𝐨𝐨𝐥 𝐮𝐬𝐞𝐝 𝐭𝐨 𝐝𝐞𝐟𝐢𝐧𝐞 𝐚𝐧𝐝 𝐫𝐮𝐧 𝐦𝐮𝐥𝐭𝐢-𝐜𝐨𝐧𝐭𝐚𝐢𝐧𝐞𝐫 𝐃𝐨𝐜𝐤𝐞𝐫 𝐚𝐩𝐩𝐥𝐢𝐜𝐚𝐭𝐢𝐨𝐧𝐬. 𝐖𝐢𝐭𝐡 𝐂𝐨𝐦𝐩𝐨𝐬𝐞, 𝐲𝐨𝐮 𝐮𝐬𝐞 𝐚 𝐘𝐀𝐌𝐋 𝐟𝐢𝐥𝐞 𝐭𝐨 𝐜𝐨𝐧𝐟𝐢𝐠𝐮𝐫𝐞 𝐲𝐨𝐮𝐫 𝐚𝐩𝐩𝐥𝐢𝐜𝐚𝐭𝐢𝐨𝐧'𝐬 𝐬𝐞𝐫𝐯𝐢𝐜𝐞𝐬, 𝐧𝐞𝐭𝐰𝐨𝐫𝐤𝐬, 𝐚𝐧𝐝 𝐯𝐨𝐥𝐮𝐦𝐞𝐬. 𝐓𝐡𝐞𝐧, 𝐚 𝐬𝐢𝐧𝐠𝐥𝐞 𝐜𝐨𝐦𝐦𝐚𝐧𝐝 𝐜𝐚𝐧 𝐜𝐫𝐞𝐚𝐭𝐞 𝐚𝐧𝐝 𝐬𝐭𝐚𝐫𝐭 𝐚𝐥𝐥 𝐭𝐡𝐞 𝐬𝐞𝐫𝐯𝐢𝐜𝐞𝐬 𝐟𝐫𝐨𝐦 𝐲𝐨𝐮𝐫 𝐜𝐨𝐧𝐟𝐢𝐠𝐮𝐫𝐚𝐭𝐢𝐨𝐧
🔷 docker-compose.yml explanation
1. 𝐕𝐞𝐫𝐬𝐢𝐨𝐧 & 𝐋𝐨𝐠𝐠𝐢𝐧𝐠 𝐂𝐨𝐧𝐟𝐢𝐠𝐮𝐫𝐚𝐭𝐢𝐨𝐧
version: '3.9'
x-default-logging: &logging
  driver: "json-file"
  options:
    max-size: "5m"
    max-file: "2"
    tag: "{{.Name}}"
Version: Defines the version of the Docker Compose file format.
Logging: Sets default logging options for all containers. Here, logs are stored in JSON format with a maximum size of 5 MB and up to 2 files before rotation.
𝐍𝐞𝐭𝐰𝐨𝐫𝐤𝐬
 networks:
   default:
     name: opentelemetry-demo
     driver: bridge
Networks: Defines a network named opentelemetry-demo using the bridge driver. This network allows containers to communicate with each other
𝐂𝐨𝐫𝐞 𝐃𝐞𝐦𝐨 𝐒𝐞𝐫𝐯𝐢𝐜𝐞𝐬
These are the main services running in your environment. Let’s look at each service:
🔶The Accounting Service handles financial transactions and communicates with Kafka for message processing. It's designed with resource limits and built from the specified Docker context, ensuring it sends telemetry data to the OpenTelemetry Collector.🔶 The Ad Service is responsible for displaying advertisements and integrates with FlagD for feature flagging. It listens on a configurable port and sends metrics and traces to the OpenTelemetry system.
🔶 The Cart Service manages user shopping carts and interacts with Redis for data storage. It depends on other services like the OpenTelemetry Collector and FlagD, while exposing its API through a designated port.
🔶 The Checkout Service coordinates the checkout process by interacting with various services like Cart, Currency, and Payment. It ensures all relevant services are up and running before initiating its own processes, exporting observability data through OpenTelemetry.
🔶 The Currency Service handles currency conversions for the application. It's lightweight with minimal memory consumption and sends telemetry data to the OpenTelemetry Collector, providing real-time visibility into currency exchange operations.
🔶 The Email Service is in charge of sending emails, typically for order confirmations or notifications. It is configured to send traces and metrics data to the OpenTelemetry Collector and runs with memory limits to ensure efficient resource usage.
🔶 The FlagD Service provides feature flagging capabilities and integrates tightly with OpenTelemetry for exporting observability data. It is a key component for managing feature rollout and control within the system.
𝐃𝐞𝐩𝐞𝐧𝐝𝐞𝐧𝐭 𝐒𝐞𝐫𝐯𝐢𝐜𝐞𝐬
Kafka: A messaging service used by other services to communicate asynchronously.
Redis: A caching service used by the cart service to speed up data retrieval
OpenTelemetry Collector: Collects and exports metrics and traces to observability platforms.𝐒𝐞𝐫𝐯𝐢𝐜𝐞 𝐃𝐞𝐩𝐞𝐧𝐝𝐞𝐧𝐜𝐢𝐞𝐬 𝐚𝐧𝐝 𝐑𝐞𝐬𝐭𝐚𝐫𝐭 𝐏𝐨𝐥𝐢𝐜𝐢𝐞𝐬
Each service includes a
depends_onsection specifying which other services need to start before it does. Therestart: unless-stoppedpolicy ensures that services are automatically restarted if they fail, except when stopped manuallyThis Docker Compose file is like a blueprint for setting up a complex system of interrelated services. By defining everything in one place, Docker Compose makes it easy to manage and deploy a multi-container application. Whether you’re building a demo app or a full-scale production environment, this file serves as a powerful tool to orchestrate your services seamlessly.
otelcol-config.yml breakdown
🔷 otelcol-config.yml
This OpenTelemetry Collector configuration file is a powerful tool for managing observability data—traces, metrics, and logs—across various services. It defines how the collector receives, processes, and exports telemetry data, making it crucial for monitoring and troubleshooting distributed applications.
𝐄𝐱𝐭𝐞𝐧𝐬𝐢𝐨𝐧𝐬
Extensions are additional capabilities that enhance the collector’s functionality:
health_check allows health status checking via an HTTP endpoint on port
13133.http_forwarder manages HTTP traffic. It forwards incoming data from the defined ingress (
0.0.0.0:6060) to the egress (https://api.${SPLUNK_REALM}.signalfx.com).zpages provides debugging pages to help with troubleshooting.
memory_ballast allocates a portion of memory to avoid out-of-memory crashes, typically set to 1/3 of the collector's memory, ensuring stability.
𝐑𝐞𝐜𝐞𝐢𝐯𝐞𝐫𝐬
Receivers define how the collector gathers telemetry data:
fluentforward receives logs from
0.0.0.0:24224.hostmetrics collects system metrics like CPU, memory, and network every 10 seconds.
otlp supports both gRPC and HTTP protocols for receiving OpenTelemetry data on ports
4317and4318.sapm listens on
7276to receive traces in the Splunk APM format.signalfx receives metrics from
0.0.0.0:9943.prometheus scrapes OpenTelemetry metrics every 10 seconds from
localhost:8888.zipkin receives traces from Istio-compatible Zipkin sources on port
9411.redis gathers Redis-related metrics every 10 seconds from the Redis service running at
redis-cart:6379.
𝐏𝐫𝐨𝐜𝐞𝐬𝐬𝐨𝐫𝐬:
Processors modify the collected data before it’s exported:
batch groups telemetry data to be sent more efficiently.
resourcedetection adds information about the environment (like host or system) to each telemetry event.
𝐄𝐱𝐩𝐨𝐫𝐭𝐞𝐫𝐬
Exporters send telemetry data to the desired monitoring tools:
sapm sends trace data to Splunk APM using the
SPLUNK_ACCESS_TOKENandSPLUNK_REALM.signalfx exports metrics, enriched with host metadata, to the SignalFx platform.
splunk_hec sends logs to Splunk's HTTP Event Collector (HEC) with an access token and index details. TLS is set to skip verification for ease of integration.
𝐏𝐢𝐩𝐞𝐥𝐢𝐧𝐞𝐬
Pipelines define how data flows through the collector:
𝒕𝒓𝒂𝒄𝒆𝒔 pipeline collects trace data from OTLP, SAPM, and Zipkin, processes it with batching and resource detection, then exports it to SAPM and SignalFx.
𝒎𝒆𝒕𝒓𝒊𝒄𝒔 pipeline receives metrics from OTLP, SignalFx, Prometheus, and host metrics, processes them, and exports them to SignalFx.
𝒍𝒐𝒈𝒔 pipeline handles logs from OTLP, SignalFx, and FluentForward, then exports them to Splunk HEC.
𝐓𝐡𝐢𝐬 𝐜𝐨𝐧𝐟𝐢𝐠𝐮𝐫𝐚𝐭𝐢𝐨𝐧 𝐧𝐨𝐭 𝐨𝐧𝐥𝐲 𝐦𝐚𝐤𝐞𝐬 𝐨𝐛𝐬𝐞𝐫𝐯𝐚𝐛𝐢𝐥𝐢𝐭𝐲 𝐞𝐚𝐬𝐲 𝐛𝐲 𝐜𝐨𝐥𝐥𝐞𝐜𝐭𝐢𝐧𝐠, 𝐩𝐫𝐨𝐜𝐞𝐬𝐬𝐢𝐧𝐠, 𝐚𝐧𝐝 𝐞𝐱𝐩𝐨𝐫𝐭𝐢𝐧𝐠 𝐥𝐨𝐠𝐬, 𝐦𝐞𝐭𝐫𝐢𝐜𝐬, 𝐚𝐧𝐝 𝐭𝐫𝐚𝐜𝐞𝐬, 𝐛𝐮𝐭 𝐢𝐭 𝐚𝐥𝐬𝐨 𝐩𝐫𝐨𝐯𝐢𝐝𝐞𝐬 𝐟𝐥𝐞𝐱𝐢𝐛𝐢𝐥𝐢𝐭𝐲 𝐭𝐨 𝐢𝐧𝐭𝐞𝐠𝐫𝐚𝐭𝐞 𝐦𝐮𝐥𝐭𝐢𝐩𝐥𝐞 𝐭𝐞𝐥𝐞𝐦𝐞𝐭𝐫𝐲 𝐬𝐨𝐮𝐫𝐜𝐞𝐬 𝐢𝐧𝐭𝐨 𝐩𝐨𝐰𝐞𝐫𝐟𝐮𝐥 𝐦𝐨𝐧𝐢𝐭𝐨𝐫𝐢𝐧𝐠 𝐬𝐲𝐬𝐭𝐞𝐦𝐬 𝐥𝐢𝐤𝐞 𝐒𝐩𝐥𝐮𝐧𝐤 𝐚𝐧𝐝 𝐒𝐢𝐠𝐧𝐚𝐥𝐅𝐱. 𝐓𝐡𝐢𝐬 𝐬𝐞𝐭𝐮𝐩 𝐚𝐥𝐥𝐨𝐰𝐬 𝐲𝐨𝐮 𝐭𝐨 𝐯𝐢𝐬𝐮𝐚𝐥𝐢𝐳𝐞 𝐲𝐨𝐮𝐫 𝐚𝐩𝐩'𝐬 𝐩𝐞𝐫𝐟𝐨𝐫𝐦𝐚𝐧𝐜𝐞 𝐢𝐧 𝐫𝐞𝐚𝐥-𝐭𝐢𝐦𝐞 𝐚𝐧𝐝 𝐝𝐢𝐚𝐠𝐧𝐨𝐬𝐞 𝐢𝐬𝐬𝐮𝐞𝐬 𝐛𝐞𝐟𝐨𝐫𝐞 𝐭𝐡𝐞𝐲 𝐛𝐞𝐜𝐨𝐦𝐞 𝐩𝐫𝐨𝐛𝐥𝐞𝐦𝐬
🔷 To get access to Splunk cloud ui, we will be running Splunk container on the opentelemetry-demo Docker network using CLI as below.
sudo docker run -d --name splunk \
  --network opentelemetry-demo \
  -p 8000:8000 \
  -p 8088:8088 \
  -e SPLUNK_START_ARGS="--accept-license" \
  -e SPLUNK_PASSWORD="Your_password" \
  splunk/splunk:latest

Here, the --network opentelemetry-demo flag ensures the container is connected to your custom network (opentelemetry-demo), so it can communicate with other services running in the same network.
To secure the Splunk password, you can use environment variables, encrypt the password with Splunk's built-in encryption tools, or integrate a secrets management service like AWS Secrets Manager, HashiCorp Vault, or Docker secrets. Avoid hardcoding passwords in scripts or configuration files.
Check out below blog if you want to make use of vault.
Hashicorp Vault
Now you can access the splunk cloud web interface at http://<aws_public_ip>:8000
Make sure to add all the required ports in the inbound rules to allow incoming traffic.
The Splunk username is set to "admin" by default, and the password is the one you configured during setup.
Now we will be creating an index and HTTP event collector token to ingest the logs to splunk cloud ui, follow the steps below.
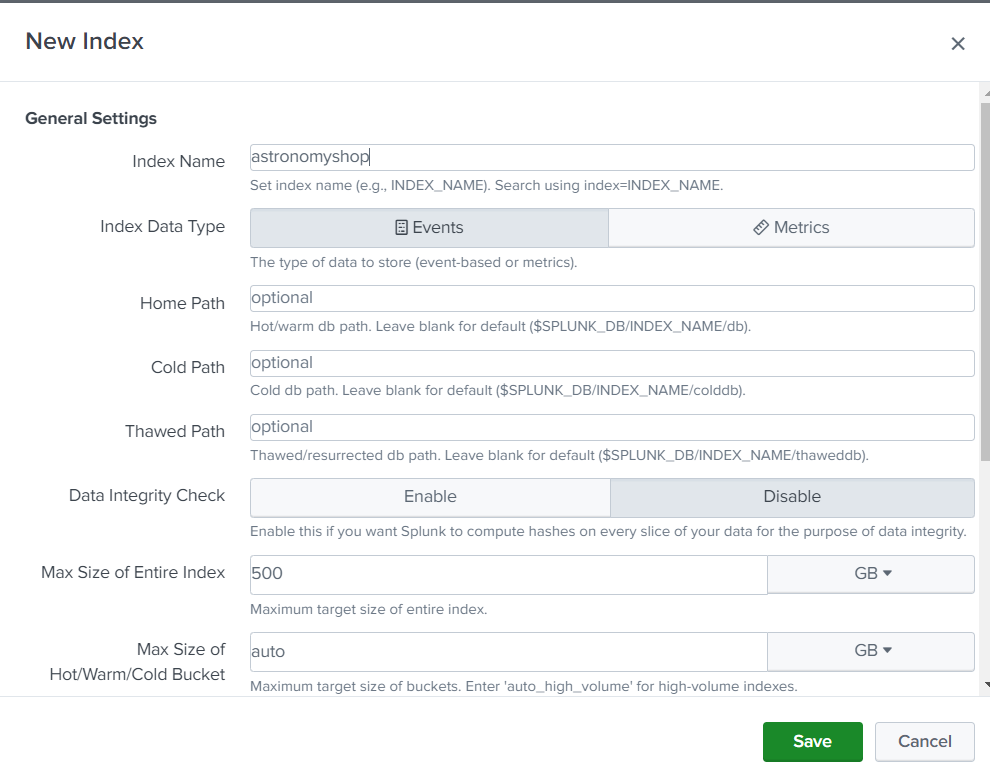
In Splunk Cloud Platform, navigate to Settings -> Indexes -> New Index. Enter the index properties you want, as shown in the following screenshot.
Generate a Splunk HTTP Event Collector token:
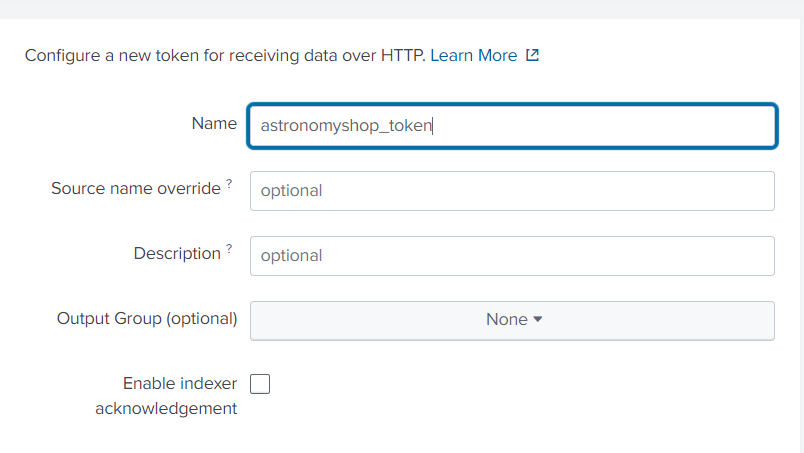
To use HTTP Event Collector (HEC) to send log data to Splunk Cloud Platform, we need to first generate a token.
In Splunk Cloud Platform, navigate to Settings -> Data Inputs -> HTTP Event Collector -> New Token. Provide a name for the token, such as “astronomyshop_token”.
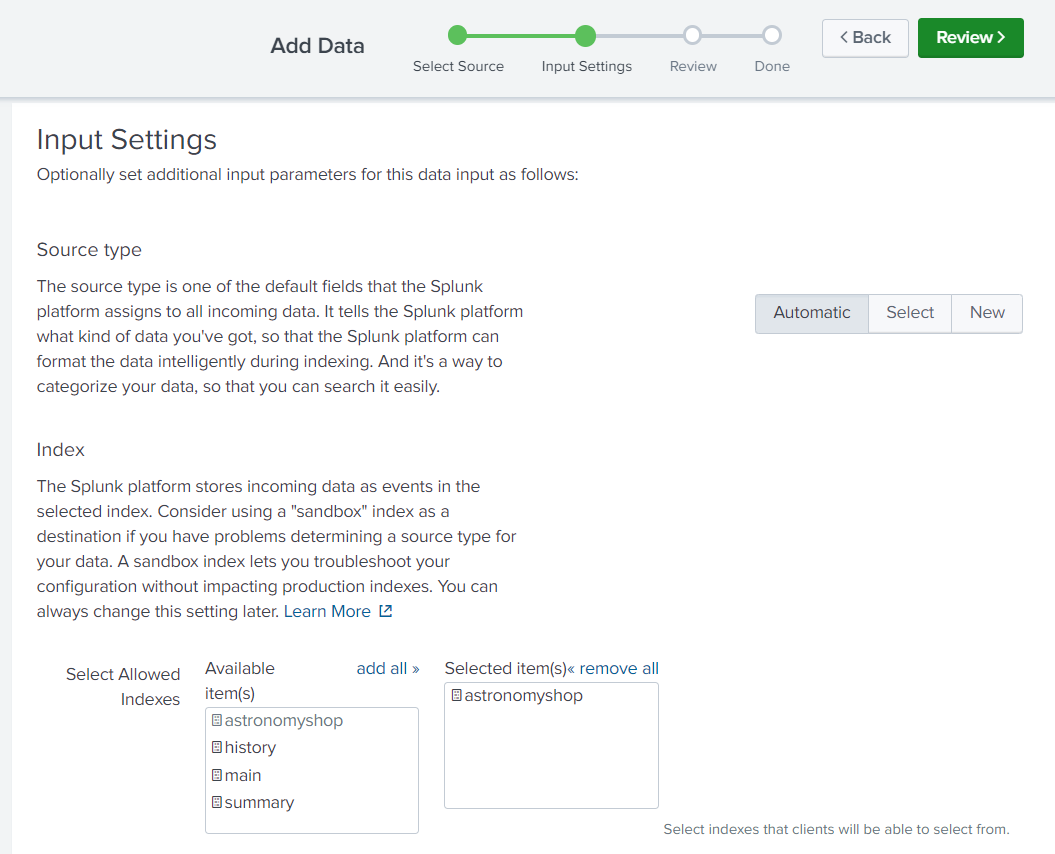
Specify which index(es) you’d like the HEC token to send events to. In our case, we’ll send events to the “astronomyshop” index
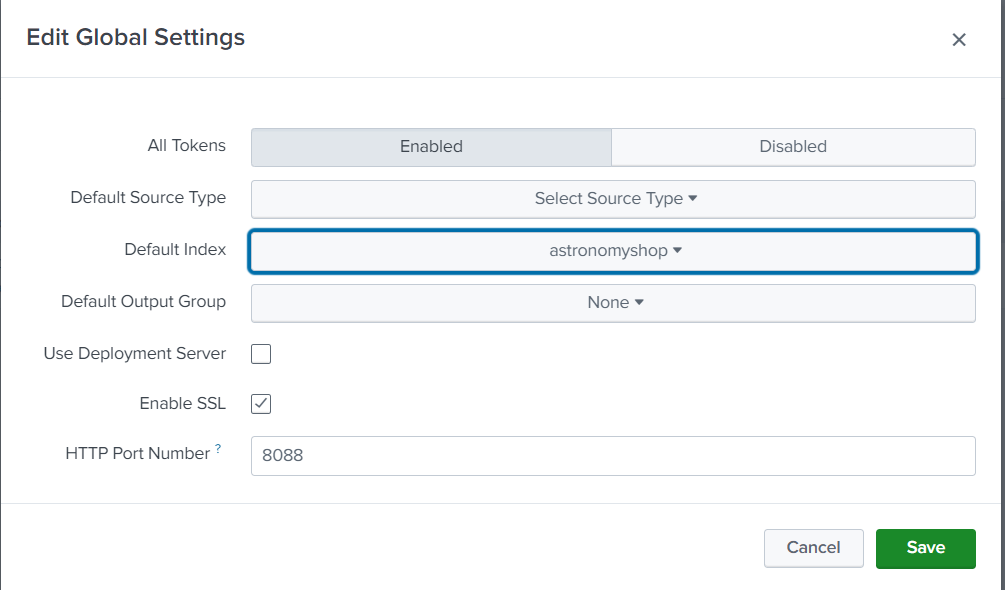
Make sure to recheck the default index and the port in global settings too
You can always check the tokens created by you in below path
Data Inputs » HTTP Event Collector

Configure the OpenTelemetry Demo
Set the following environment variables using the tokens created above
export SPLUNK_ACCESS_TOKEN=<ingest token>
export SPLUNK_REALM=<your realm, e.g. us0, eu0>
export SPLUNK_HEC_TOKEN=<The Splunk HEC authentication token>
export SPLUNK_HEC_URL=<The Splunk HEC endpoint, e.g. https://abc.splunkcloud.com:port>
export SPLUNK_MEMORY_TOTAL_MIB=1024
𝐒𝐏𝐋𝐔𝐍𝐊_𝐀𝐂𝐂𝐄𝐒𝐒_𝐓𝐎𝐊𝐄𝐍 𝐄𝐱𝐩𝐥𝐚𝐧𝐚𝐭𝐢𝐨𝐧: This token is used to authenticate access to Splunk Observability Cloud, allowing you to send traces and metrics.
𝑾𝒉𝒆𝒓𝒆 𝒕𝒐 𝑮𝒆𝒕 𝑰𝒕: Found in your Splunk Observability account.
𝐒𝐏𝐋𝐔𝐍𝐊_𝐑𝐄𝐀𝐋𝐌 𝐄𝐱𝐩𝐥𝐚𝐧𝐚𝐭𝐢𝐨𝐧: Specifies the region of your Splunk Observability instance (e.g., us1).
𝑾𝒉𝒆𝒓𝒆 𝒕𝒐 𝑮𝒆𝒕 𝑰𝒕: Available in your Splunk Observability account details.
𝐒𝐏𝐋𝐔𝐍𝐊_𝐇𝐄𝐂_𝐓𝐎𝐊𝐄𝐍 𝐄𝐱𝐩𝐥𝐚𝐧𝐚𝐭𝐢𝐨𝐧: This token is for authenticating and sending data to Splunk Cloud via the HTTP Event Collector (HEC).
𝑾𝒉𝒆𝒓𝒆 𝒕𝒐 𝑮𝒆𝒕 𝑰𝒕: Found in Splunk Cloud's web interface under HEC settings.
𝐒𝐏𝐋𝐔𝐍𝐊_𝐇𝐄𝐂_𝐔𝐑𝐋 𝐄𝐱𝐩𝐥𝐚𝐧𝐚𝐭𝐢𝐨𝐧: The URL for the Splunk Cloud HEC endpoint, formatted as https://:8088/services/collector.
𝑾𝒉𝒆𝒓𝒆 𝒕𝒐 𝑮𝒆𝒕 𝑰𝒕: Constructed based on your Splunk Cloud instance's IP address or domain.
𝐒𝐏𝐋𝐔𝐍𝐊_𝐌𝐄𝐌𝐎𝐑𝐘_𝐓𝐎𝐓𝐀𝐋_𝐌𝐈𝐁 𝐄𝐱𝐩𝐥𝐚𝐧𝐚𝐭𝐢𝐨𝐧: This specifies the total memory allocated to Splunk processes in MiB for efficient resource management.
𝑾𝒉𝒆𝒓𝒆 𝒕𝒐 𝑮𝒆𝒕 𝑰𝒕: Set based on your system’s total available memory.
This clarifies that the HEC token and URL are related to Splunk Cloud, while the access token and realm are specific to Splunk Observability.
Before running all the other services, you have to export these tokens in your terminal or add it in .env file like below.
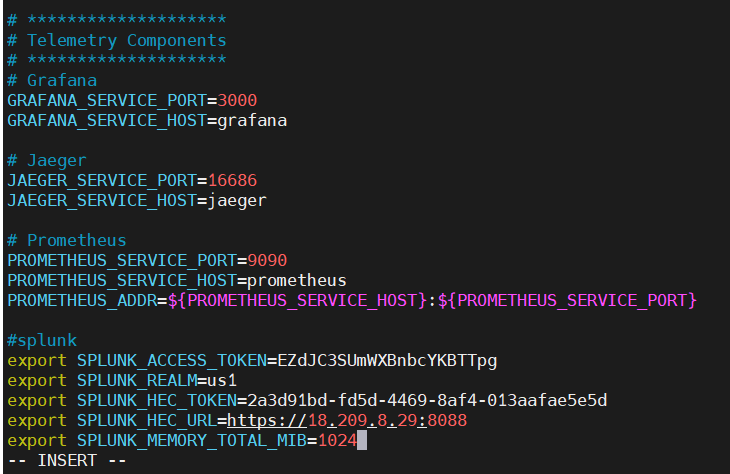
𝐑𝐞𝐯𝐢𝐞𝐰 𝐭𝐡𝐞 𝐎𝐩𝐞𝐧𝐓𝐞𝐥𝐞𝐦𝐞𝐭𝐫𝐲 𝐂𝐨𝐥𝐥𝐞𝐜𝐭𝐨𝐫 𝐬𝐞𝐫𝐯𝐢𝐜𝐞 𝐜𝐨𝐧𝐟𝐢𝐠𝐮𝐫𝐚𝐭𝐢𝐨𝐧
The updated configuration looks as follows:
# OpenTelemetry Collector
  otelcol:
    image: quay.io/signalfx/splunk-otel-collector:latest
    container_name: otel-col
    deploy:
      resources:
        limits:
          memory: 200M
    restart: unless-stopped
    command: ["--config=/etc/otelcol-config.yml"]
    volumes:
      - ./splunk/otelcol-config.yml:/etc/otelcol-config.yml
      - ./logs:/logs
      - ./checkpoint:/checkpoint
    ports:
      - "${OTEL_COLLECTOR_PORT_GRPC}"
      - "${OTEL_COLLECTOR_PORT_HTTP}"
      - "9464"
      - "8888"
      - "13133"
      - "6060"
      - "9080"
      - "9411"
      - "9943"
    logging: *logging
    environment:
      - ENVOY_PORT
      - SPLUNK_ACCESS_TOKEN=${SPLUNK_ACCESS_TOKEN}
      - SPLUNK_REALM=${SPLUNK_REALM}
      - SPLUNK_HEC_TOKEN=${SPLUNK_HEC_TOKEN}
      - SPLUNK_HEC_URL=${SPLUNK_HEC_URL}
      - SPLUNK_MEMORY_TOTAL_MIB=${SPLUNK_MEMORY_TOTAL_MIB}
The collector will utilize the configuration file stored at ./splunk/otelcol-config.yml. The collector is configured to export metrics and traces to Splunk Observability Cloud, using the environment variables set earlier.
𝐑𝐮𝐧 𝐭𝐡𝐞 𝐝𝐞𝐦𝐨 𝐚𝐩𝐩𝐥𝐢𝐜𝐚𝐭𝐢𝐨𝐧 𝐬𝐞𝐫𝐯𝐢𝐜𝐞𝐬 𝐮𝐬𝐢𝐧𝐠 𝐛𝐞𝐥𝐨𝐰 𝐜𝐨𝐦𝐦𝐚𝐧𝐝
docker compose up --force-recreate --remove-orphans --detach
You can check all running containers using the docker ps command. Once everything is up and running, you can monitor the various services using the monitoring tools you've chosen.
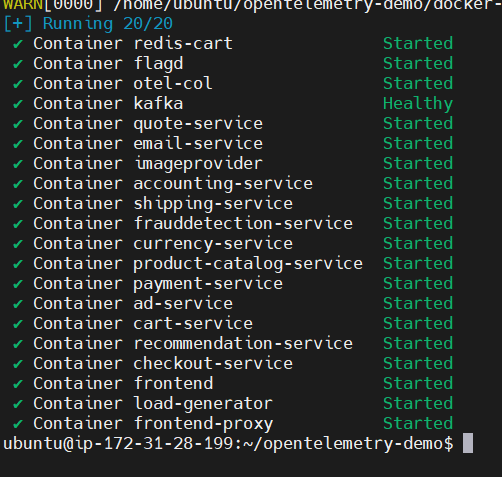
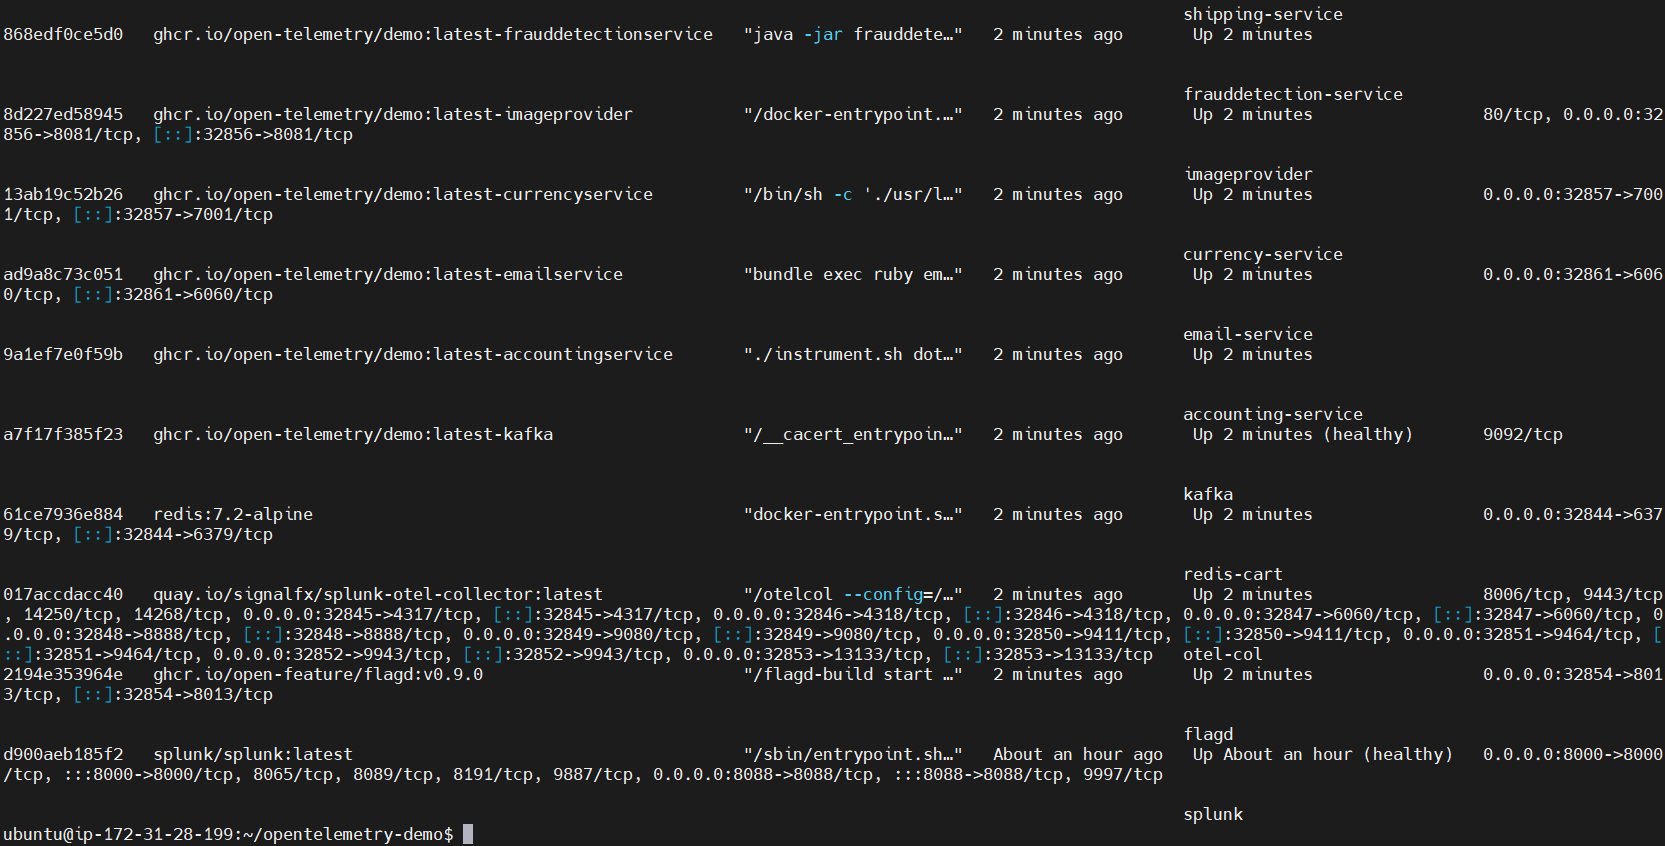
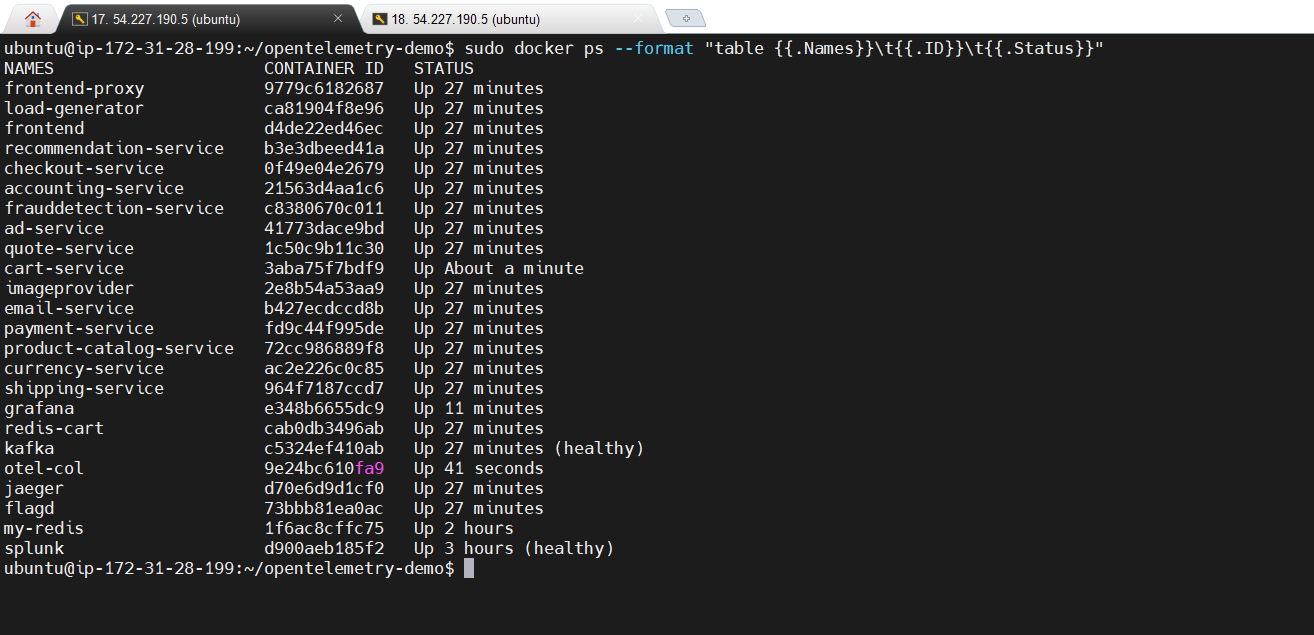
𝐎𝐧𝐜𝐞 𝐚𝐥𝐥 𝐭𝐡𝐞 𝐬𝐞𝐫𝐯𝐢𝐜𝐞𝐬 𝐚𝐫𝐞 𝐔𝐩, 𝐲𝐨𝐮 𝐜𝐚𝐧 𝐚𝐜𝐜𝐞𝐬𝐬 𝐭𝐡𝐞𝐦:
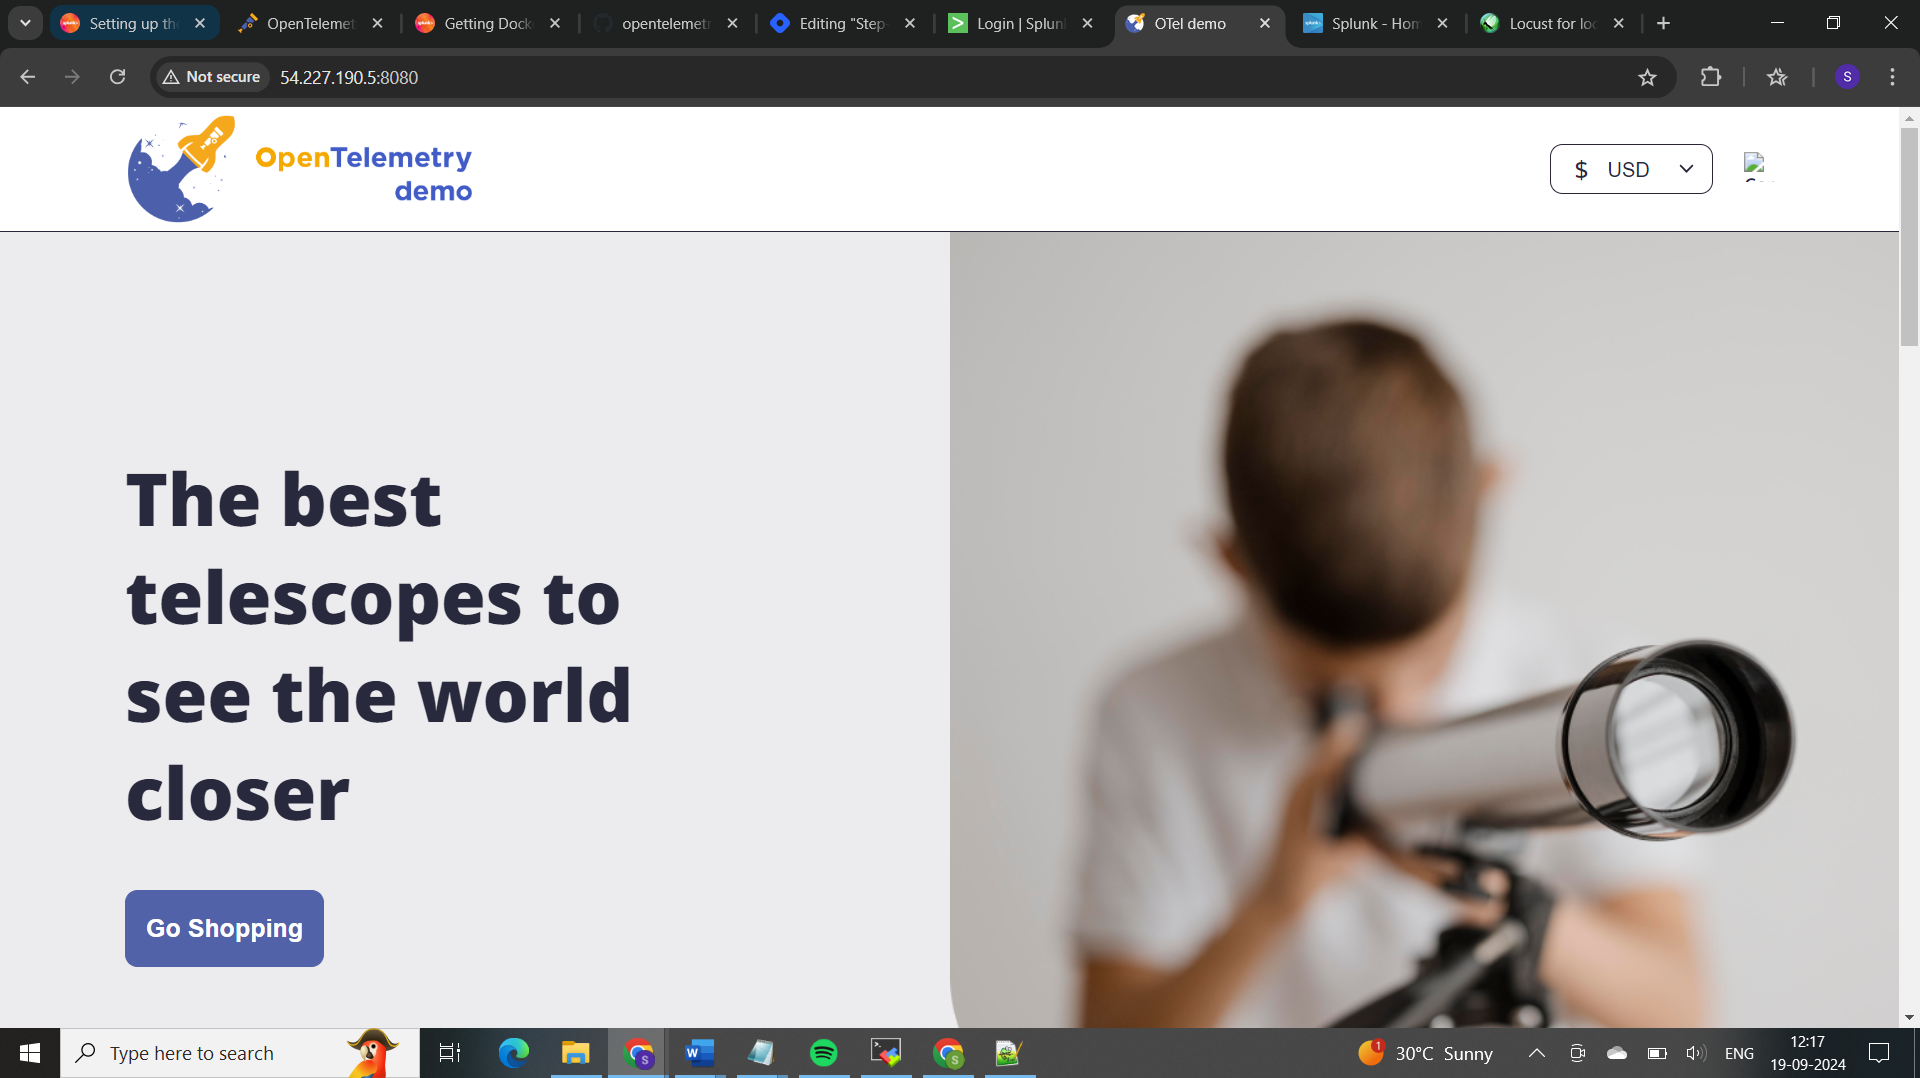
Webstore: http://IP:8080/
Load Generator : http://IP:8080/loadgen/ or http://IP:port/
Jaeger UI : http://IP:8080/jaeger/ui/
Splunk cloud ui: http://IP:8000
Splunk observability ui : https://app.us1.signalfx.com/
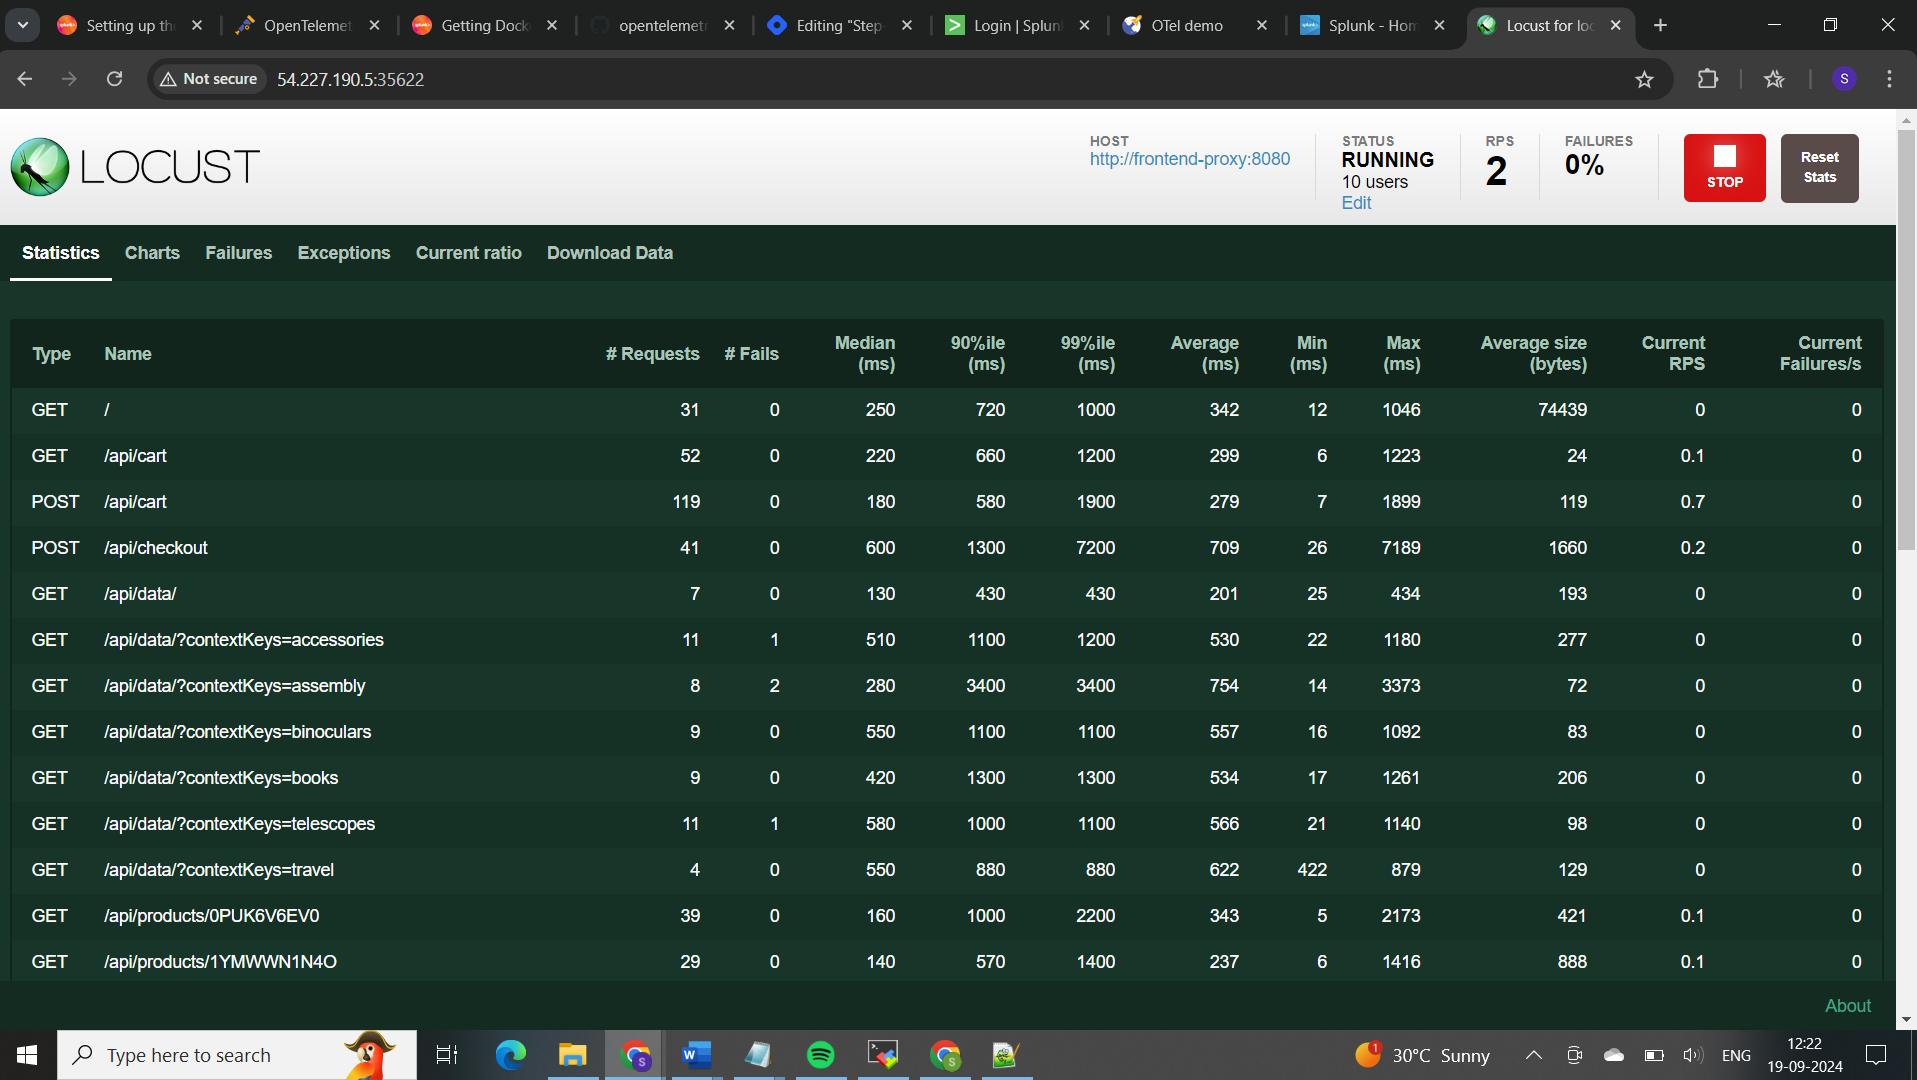
𝐋𝐨𝐜𝐮𝐬𝐭:
Locust and load generators like loadgen are used for load testing to simulate user traffic and evaluate how an application performs under stress. They help measure system performance (e.g., response times, error rates) and identify bottlenecks. This ensures the system can handle high traffic and scale effectively
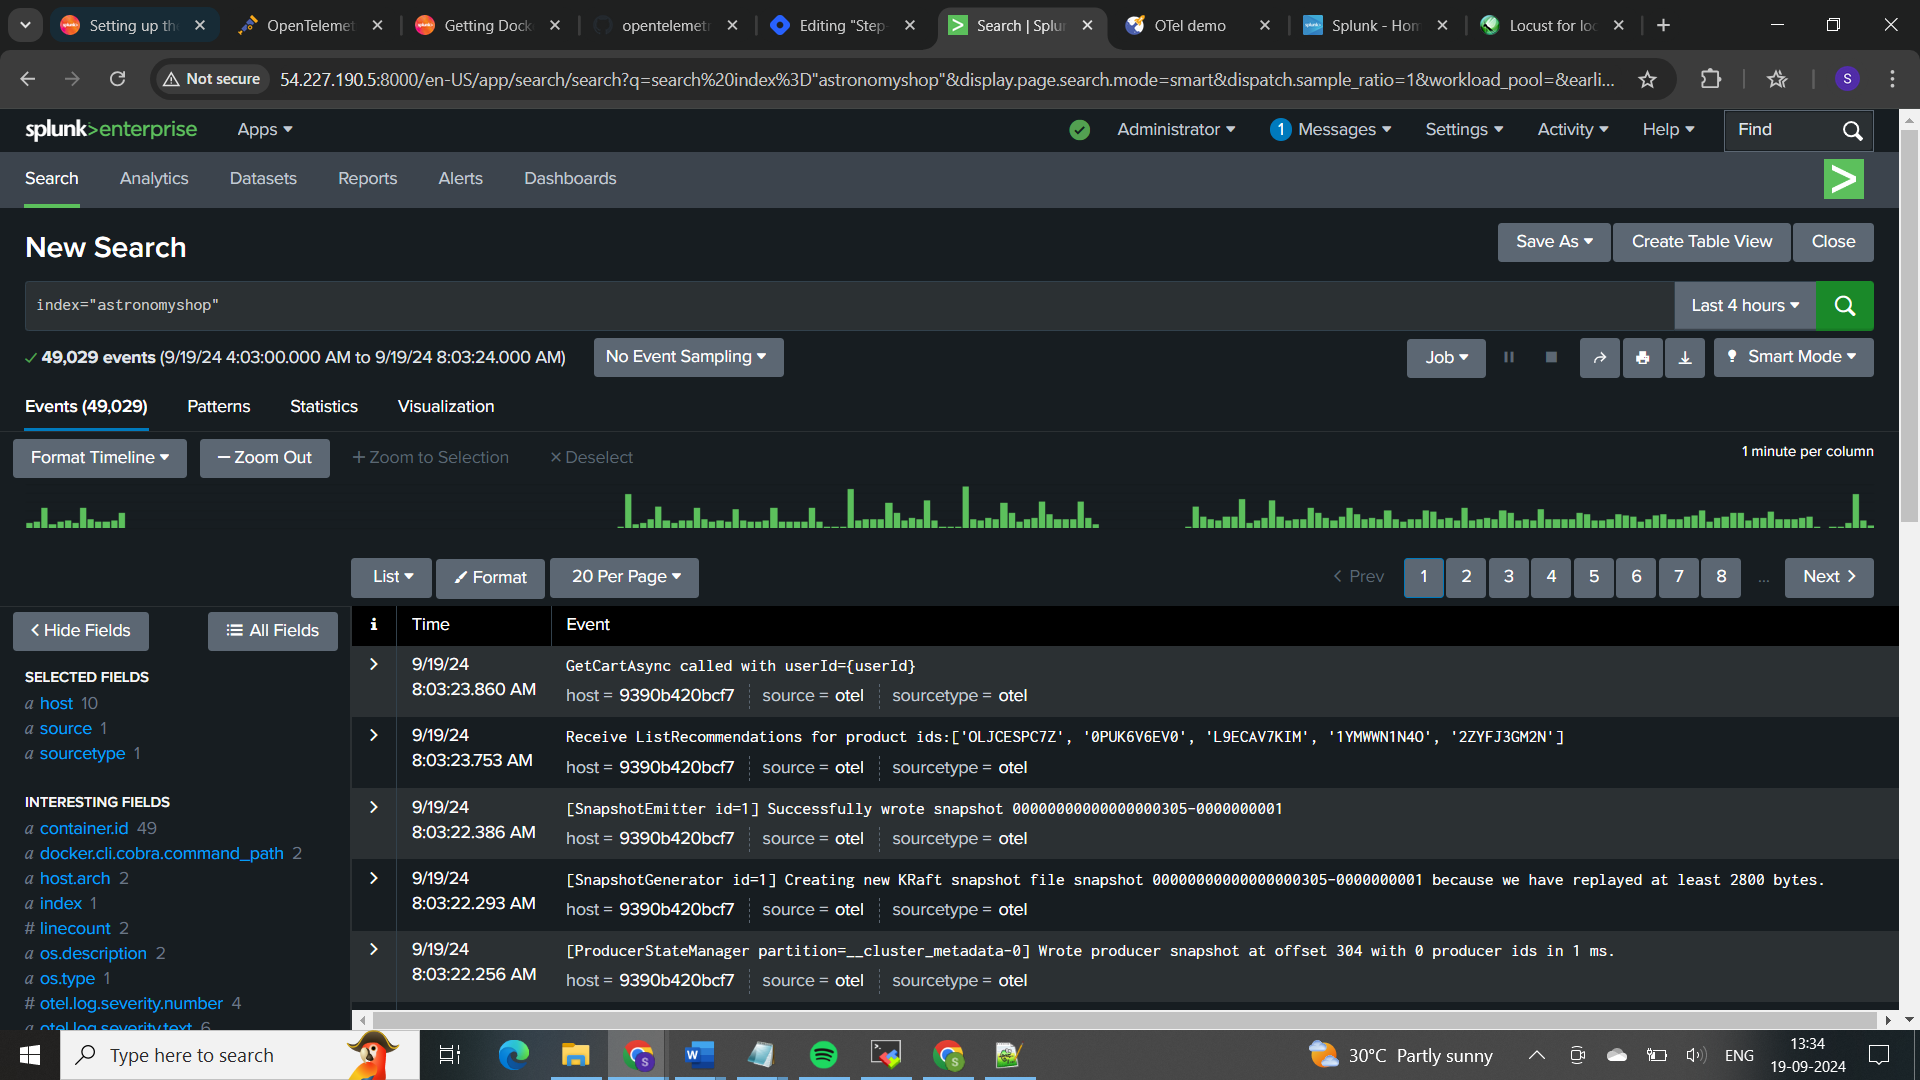
In this demo project we used both splunk observability cloud and splunk cloud services, Lets understand the difference.
𝐒𝐩𝐥𝐮𝐧𝐤 𝐨𝐛𝐬𝐞𝐫𝐯𝐚𝐛𝐢𝐥𝐢𝐭𝐲 𝐜𝐥𝐨𝐮𝐝
Purpose:
Specialized Monitoring: Designed specifically for real-time observability and monitoring of modern cloud-native environments, including Kubernetes, microservices, and serverless architectures.
Metrics, Traces, and Logs: Provides comprehensive monitoring by collecting and correlating metrics, traces, and logs.
Features:
Real-Time Metrics: High-resolution metrics with a granularity of up to 1 second.
Distributed Tracing: End-to-end tracing to monitor the performance of microservices and pinpoint latency issues.
Log Aggregation: Centralized logging with powerful search and analytics capabilities.
AI-Driven Insights: Anomaly detection, predictive analytics, and alerting powered by machine learning.
Dashboards and Visualizations: Pre-built and customizable dashboards for visualizing performance data.
Kubernetes Monitoring: Native support for Kubernetes, providing insights into cluster health, resource utilization, and application performance.
Integration:
OpenTelemetry: Seamless integration with OpenTelemetry for collecting telemetry data.
Third-Party Tools: Integrates with various third-party tools and services for enhanced observability.
Use Case:
- Ideal for DevOps and SRE teams who need real-time visibility into the performance and health of their cloud-native applications and infrastructure.
𝐒𝐩𝐥𝐮𝐧𝐤 𝐂𝐥𝐨𝐮𝐝 𝐔𝐈
Purpose:
General Data Analytics: A cloud-based version of Splunk Enterprise, designed for indexing, searching, and analyzing machine-generated data from various sources.
Log Management: Primarily used for log management, security information and event management (SIEM), and IT operations.
Features:
Log Indexing and Search: Powerful indexing and search capabilities for large volumes of log data.
Data Analytics: Advanced analytics for extracting insights from log data.
Security and Compliance: Features for security monitoring, threat detection, and compliance reporting.
Dashboards and Reports: Customizable dashboards and reports for visualizing log data and analytics.
Alerting: Configurable alerts based on log data patterns and thresholds.
Integration:
Universal Forwarder: Uses Splunk Universal Forwarder to collect and forward log data from various sources.
Apps and Add-Ons: Extensive library of apps and add-ons for integrating with different data sources and enhancing functionality.
Use Case:
Suitable for IT operations, security teams, and business analysts who need to manage and analyze log data for operational intelligence, security monitoring, and compliance.
𝖥𝗈𝗋 𝖽𝖾𝗉𝗅𝗈𝗒𝗂𝗇𝗀 𝖪𝗎𝖻𝖾𝗋𝗇𝖾𝗍𝖾𝗌 𝖺𝗉𝗉𝗅𝗂𝖼𝖺𝗍𝗂𝗈𝗇𝗌 𝗂𝗇 𝖣𝗈𝖼𝗄𝖾𝗋 𝖼𝗈𝗇𝗍𝖺𝗂𝗇𝖾𝗋𝗌 𝖺𝗇𝖽 𝗆𝗈𝗇𝗂𝗍𝗈𝗋𝗂𝗇𝗀 𝗍𝗁𝖾𝗆, 𝖲𝗉𝗅𝗎𝗇𝗄 𝖮𝖻𝗌𝖾𝗋𝗏𝖺𝖻𝗂𝗅𝗂𝗍𝗒 𝖢𝗅𝗈𝗎𝖽 𝗂𝗌 𝗍𝗁𝖾 𝗆𝗈𝗋𝖾 𝗌𝗉𝖾𝖼𝗂𝖺𝗅𝗂𝗓𝖾𝖽 𝖺𝗇𝖽 𝖿𝖾𝖺𝗍𝗎𝗋𝖾-𝗋𝗂𝖼𝗁 𝗈𝗉𝗍𝗂𝗈𝗇, 𝗉𝗋𝗈𝗏𝗂𝖽𝗂𝗇𝗀 𝗋𝖾𝖺𝗅-𝗍𝗂𝗆𝖾 𝗂𝗇𝗌𝗂𝗀𝗁𝗍𝗌 𝖺𝗇𝖽 𝖼𝗈𝗆𝗉𝗋𝖾𝗁𝖾𝗇𝗌𝗂𝗏𝖾 𝗈𝖻𝗌𝖾𝗋𝗏𝖺𝖻𝗂𝗅𝗂𝗍𝗒 𝗍𝖺𝗂𝗅𝗈𝗋𝖾𝖽 𝖿𝗈𝗋 𝖼𝗅𝗈𝗎𝖽-𝗇𝖺𝗍𝗂𝗏𝖾 𝖾𝗇𝗏𝗂𝗋𝗈𝗇𝗆𝖾𝗇𝗍𝗌. 𝖲𝗉𝗅𝗎𝗇𝗄 𝖢𝗅𝗈𝗎𝖽, 𝗈𝗇 𝗍𝗁𝖾 𝗈𝗍𝗁𝖾𝗋 𝗁𝖺𝗇𝖽, 𝗂𝗌 𝖺 𝗏𝖾𝗋𝗌𝖺𝗍𝗂𝗅𝖾 𝗅𝗈𝗀 𝗆𝖺𝗇𝖺𝗀𝖾𝗆𝖾𝗇𝗍 𝖺𝗇𝖽 𝖺𝗇𝖺𝗅𝗒𝗍𝗂𝖼𝗌 𝗉𝗅𝖺𝗍𝖿𝗈𝗋𝗆 𝗍𝗁𝖺𝗍 𝖼𝖺𝗇 𝖼𝗈𝗆𝗉𝗅𝖾𝗆𝖾𝗇𝗍 𝗒𝗈𝗎𝗋 𝗈𝖻𝗌𝖾𝗋𝗏𝖺𝖻𝗂𝗅𝗂𝗍𝗒 𝗌𝗍𝗋𝖺𝗍𝖾𝗀𝗒 𝖻𝗒 𝗉𝗋𝗈𝗏𝗂𝖽𝗂𝗇𝗀 𝖽𝖾𝖾𝗉 𝗅𝗈𝗀 𝖺𝗇𝖺𝗅𝗒𝗌𝗂𝗌 𝖺𝗇𝖽 𝗌𝖾𝖼𝗎𝗋𝗂𝗍𝗒 𝗆𝗈𝗇𝗂𝗍𝗈𝗋𝗂𝗇𝗀 𝖼𝖺𝗉𝖺𝖻𝗂𝗅𝗂𝗍𝗂𝖾𝗌.
By leveraging both platforms, you can achieve a robust monitoring and observability solution that covers all aspects of your Kubernetes deployments.
𝐌𝐨𝐧𝐢𝐭𝐨𝐫𝐢𝐧𝐠 𝐢𝐧 𝐒𝐩𝐥𝐮𝐧𝐤 𝐜𝐥𝐨𝐮𝐝 𝐮𝐢:
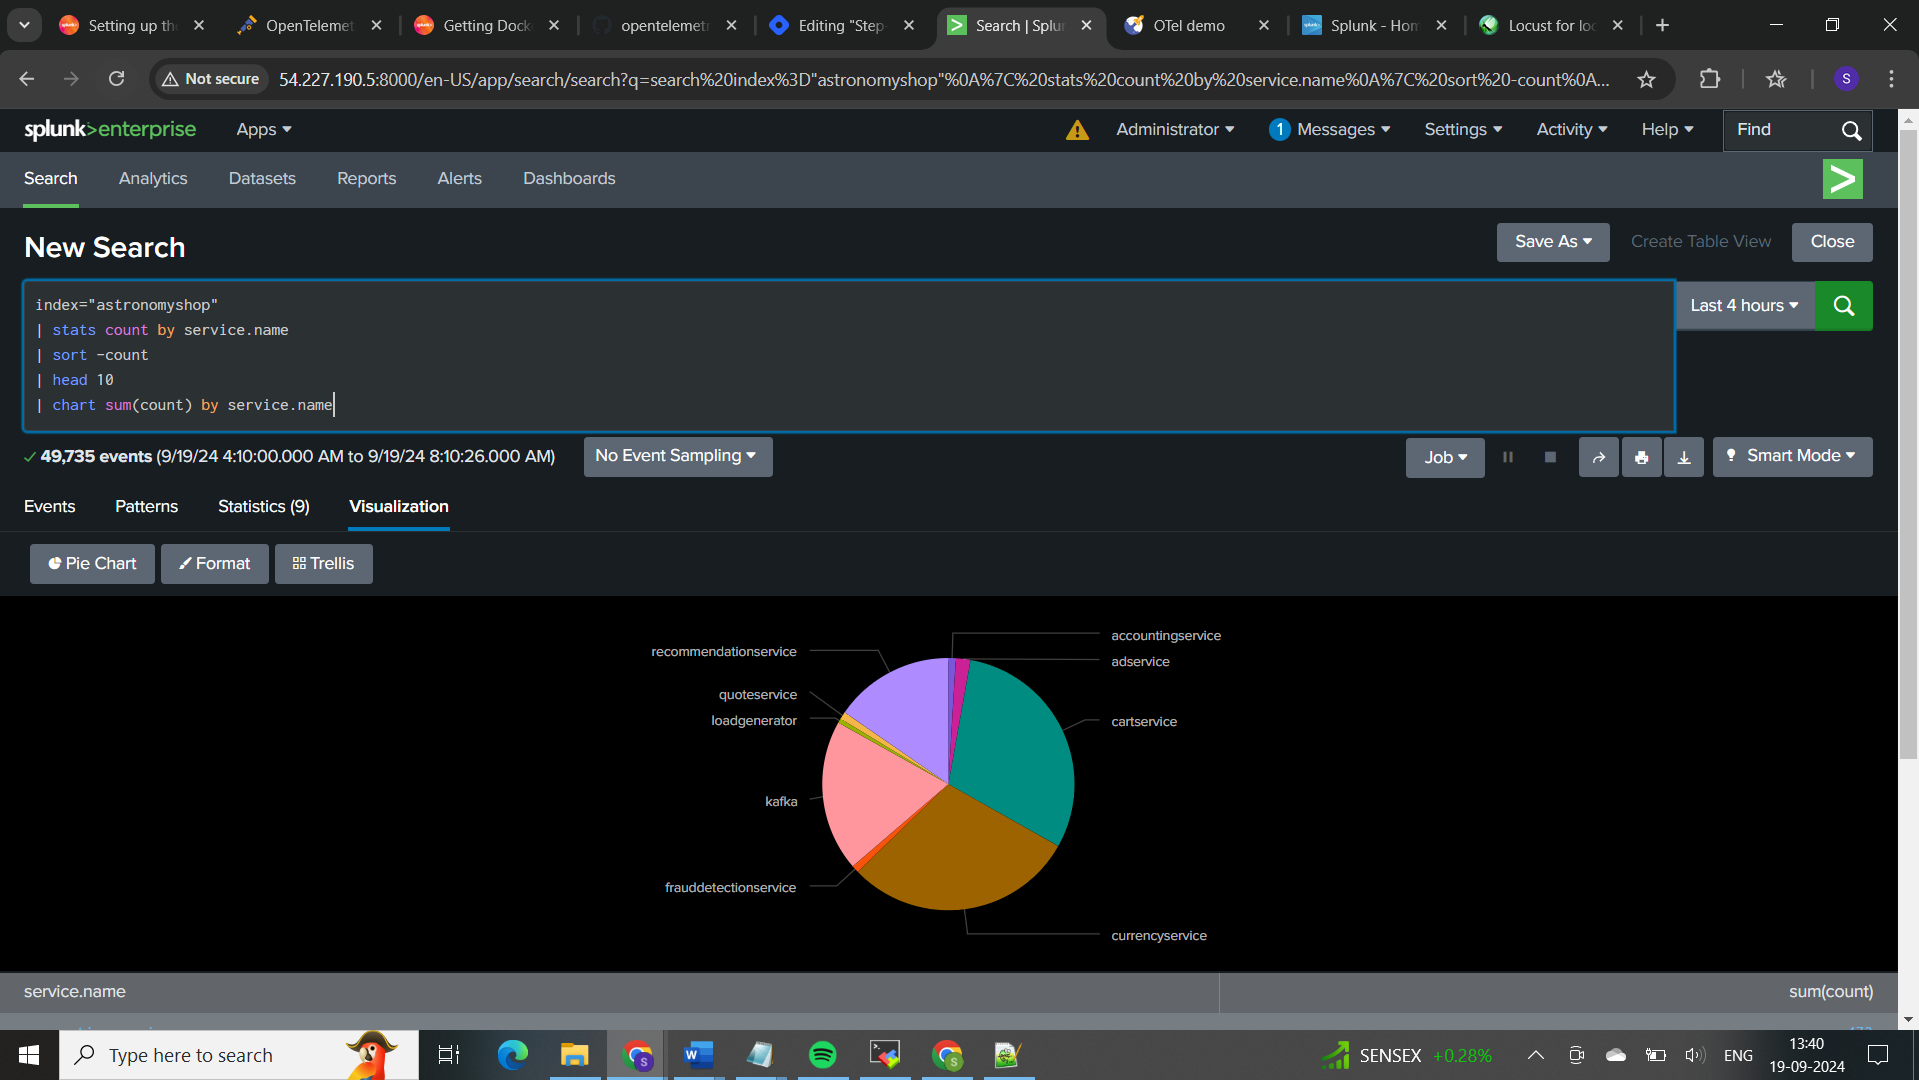
Here, stats is used to count occurrences by service.name, and chart is used to visualize these counts. The head 10 part ensures that you only look at the top 10 services if there are many.
Now, lets monitor using Splunk Observability cloud
Here as per the setup we can monitor using below methods:
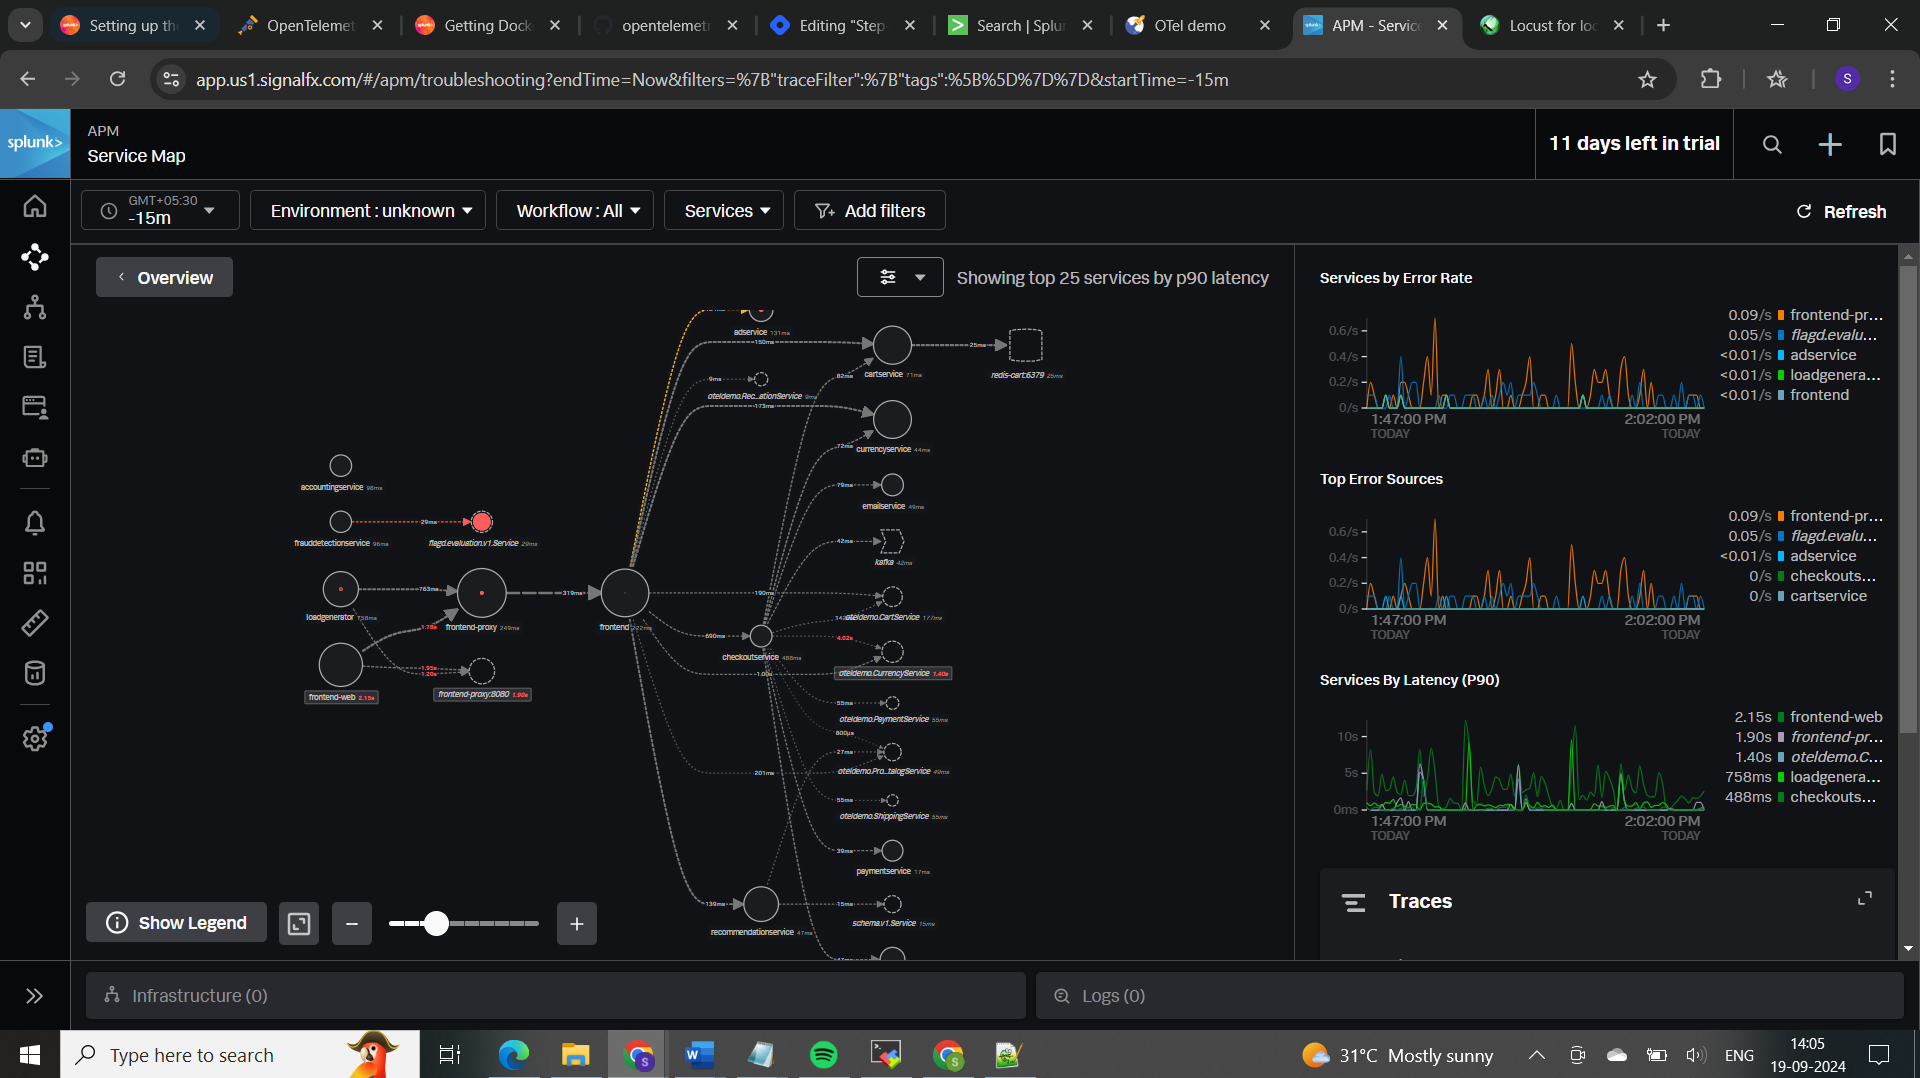
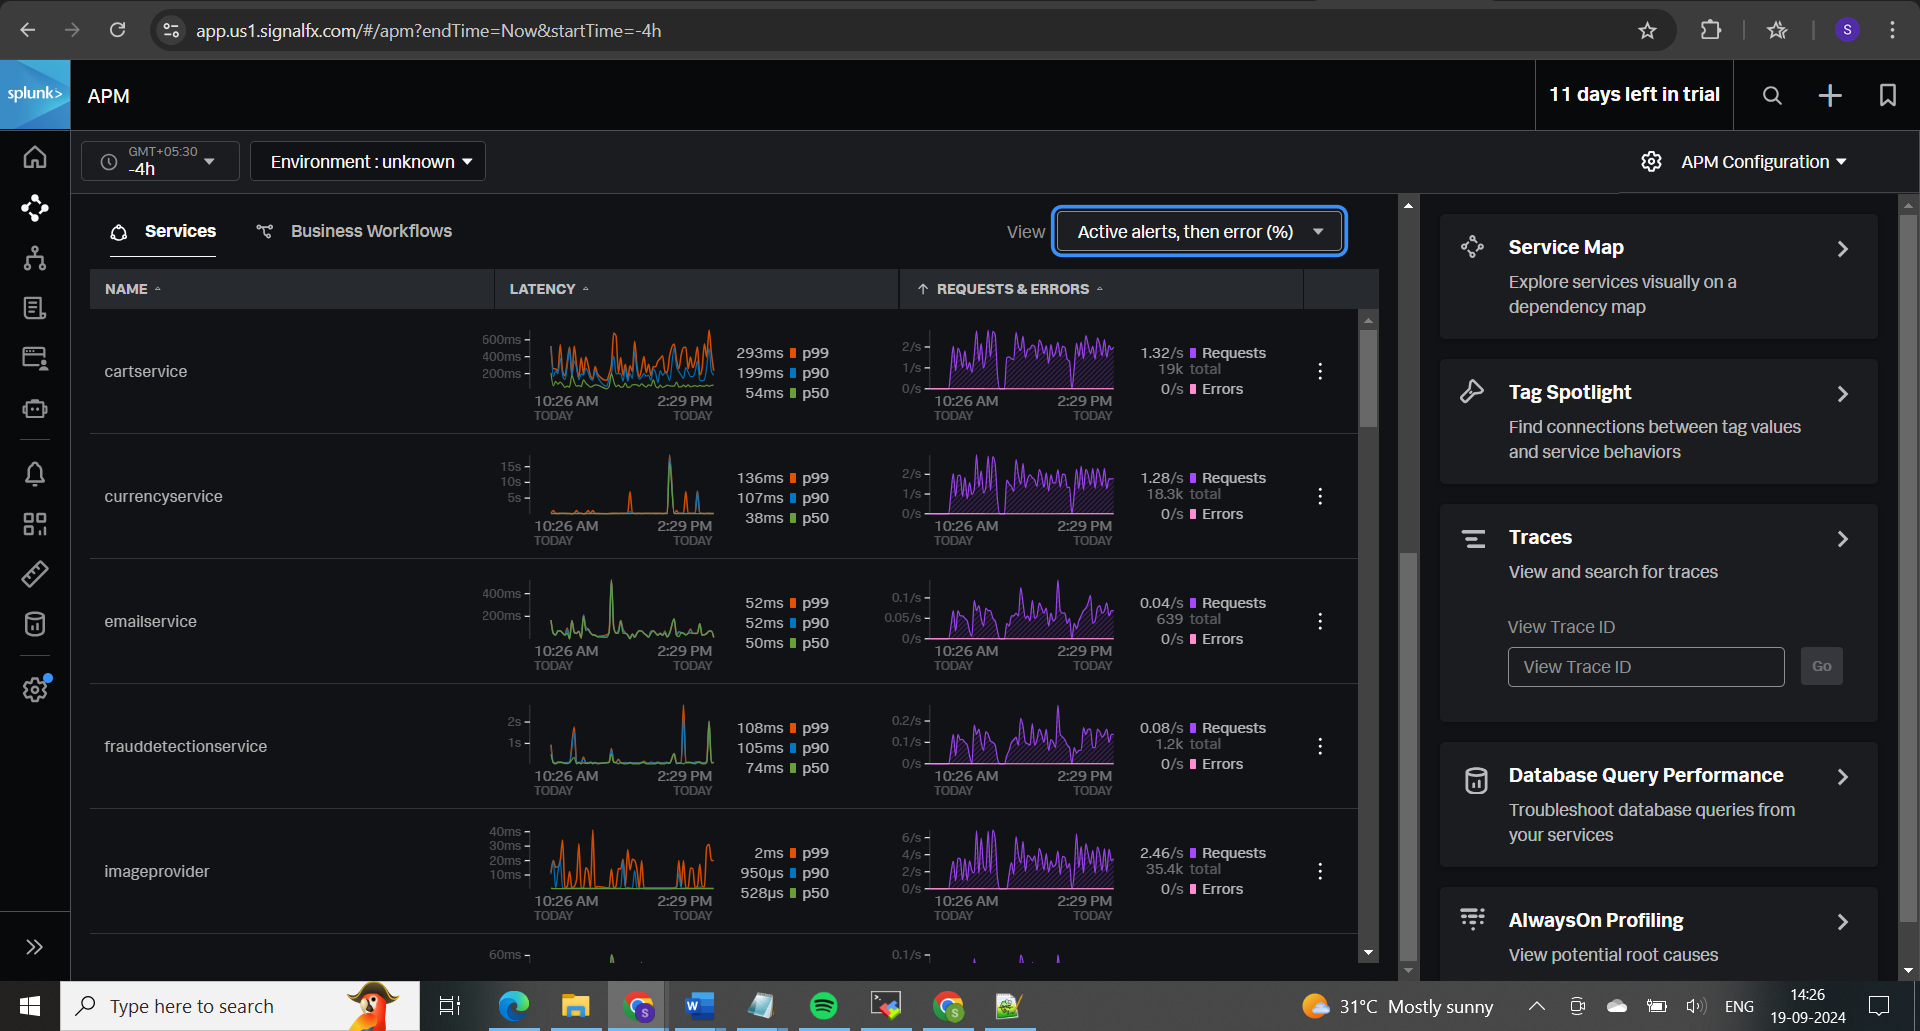
𝐀𝐏𝐌 (𝐀𝐩𝐩𝐥𝐢𝐜𝐚𝐭𝐢𝐨𝐧 𝐏𝐞𝐫𝐟𝐨𝐫𝐦𝐚𝐧𝐜𝐞 𝐌𝐨𝐧𝐢𝐭𝐨𝐫𝐢𝐧𝐠) focuses on the performance and behavior of your applications. It tracks how requests move through your services, measures transaction speeds, and helps identify slow transactions and errors. APM also provides insights into code execution and dependencies, allowing you to optimize application performance and troubleshoot issues.
𝐈𝐧𝐟𝐫𝐚𝐬𝐭𝐫𝐮𝐜𝐭𝐮𝐫𝐞 𝐌𝐨𝐧𝐢𝐭𝐨𝐫𝐢𝐧𝐠 looks at the health and performance of your underlying infrastructure, such as servers and containers. It monitors metrics like CPU, memory, and disk usage, as well as the status of your containers and services. This helps ensure your infrastructure is running smoothly, prevents outages, and diagnoses system-related issues.
𝐈𝐧𝐟𝐫𝐚𝐬𝐭𝐫𝐮𝐜𝐭𝐮𝐫𝐞 𝐌𝐨𝐧𝐢𝐭𝐨𝐫𝐢𝐧𝐠:
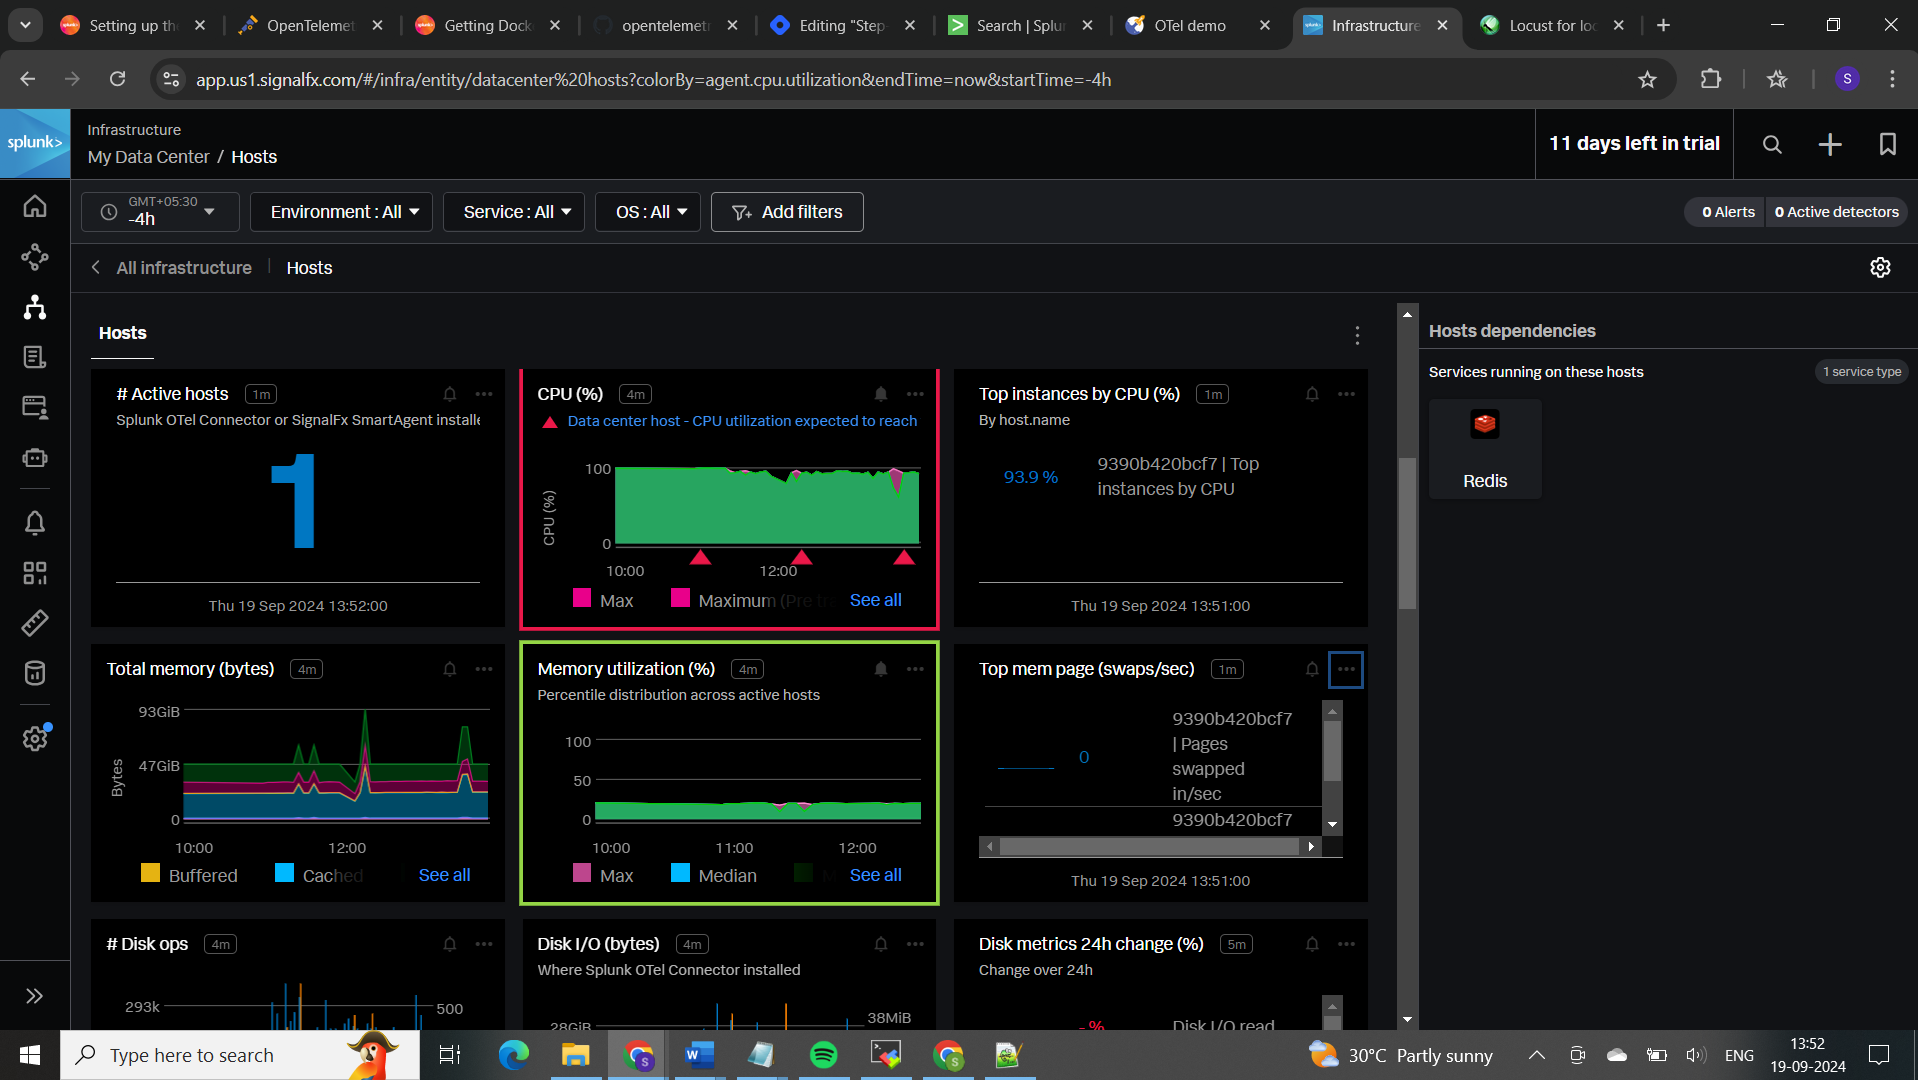
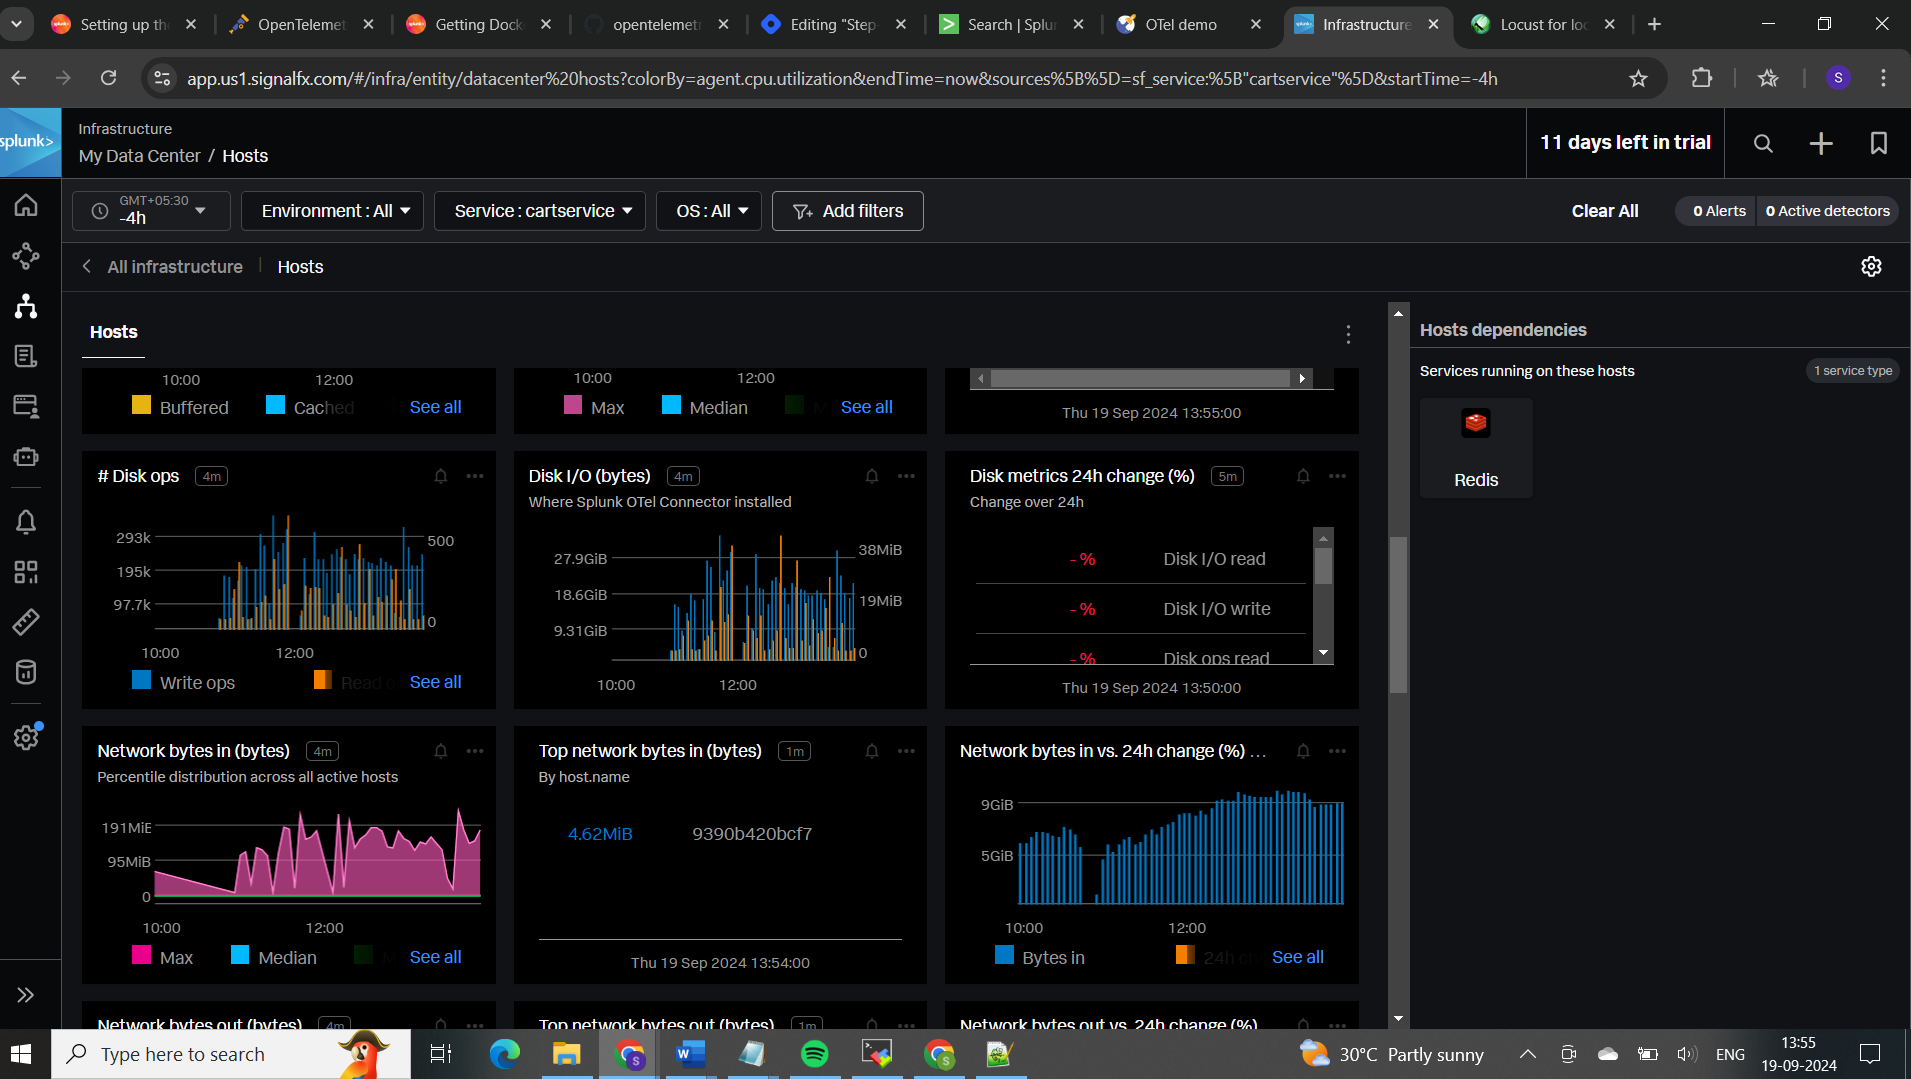
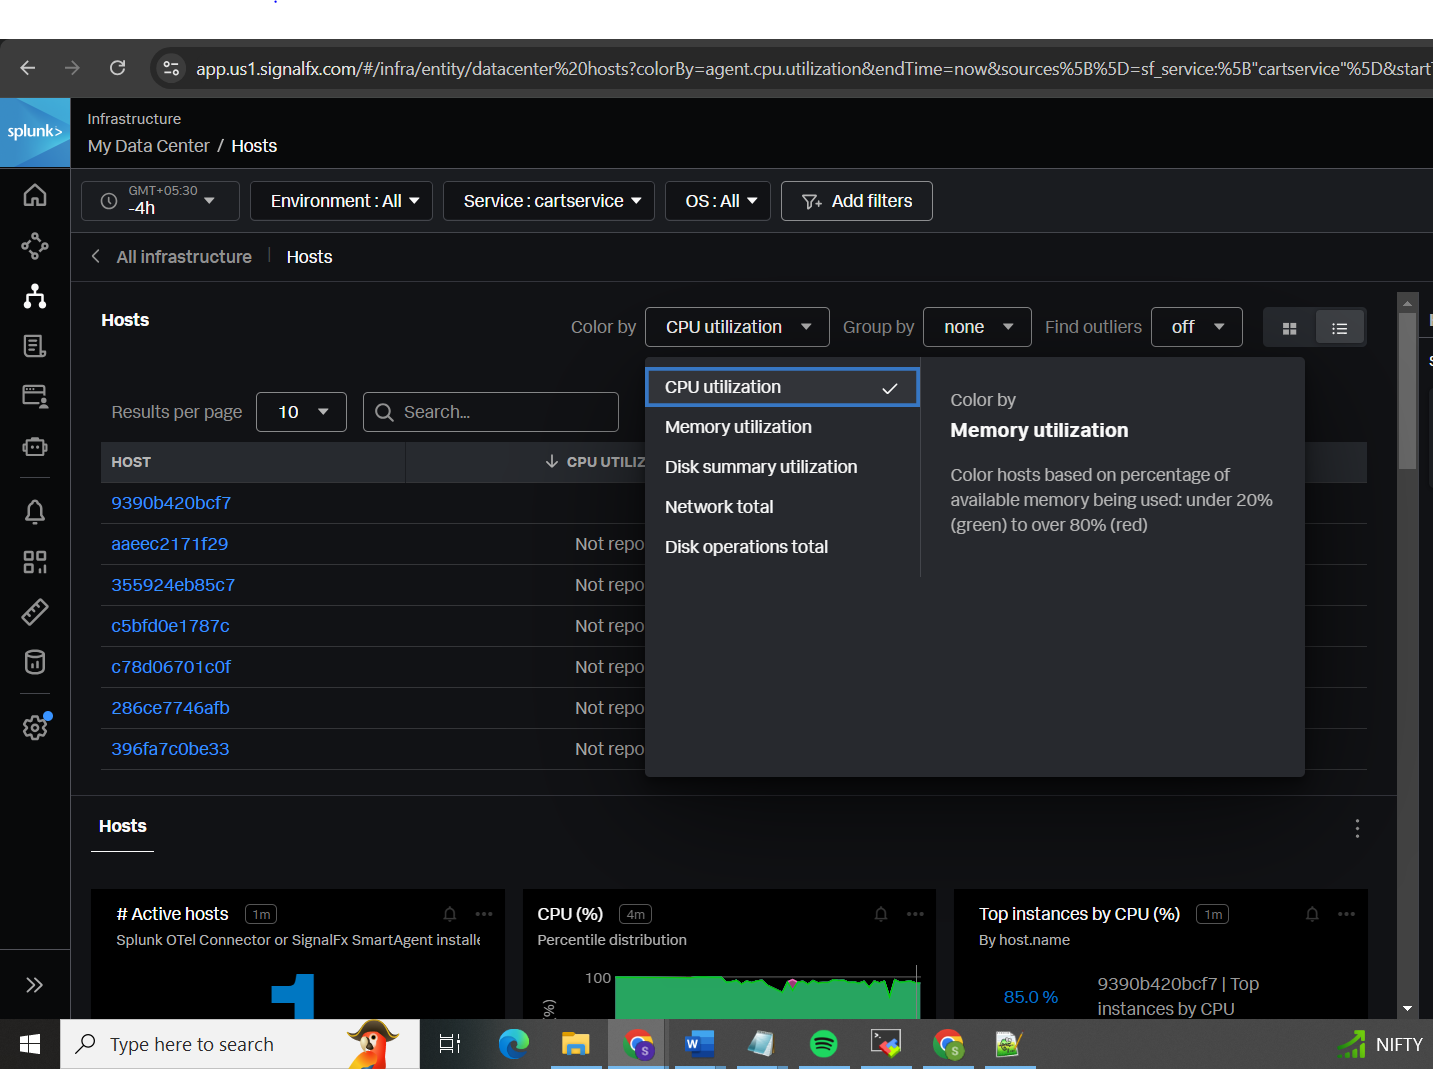
You can filter results based on services, specific traces, logs, environment, OS, and more.
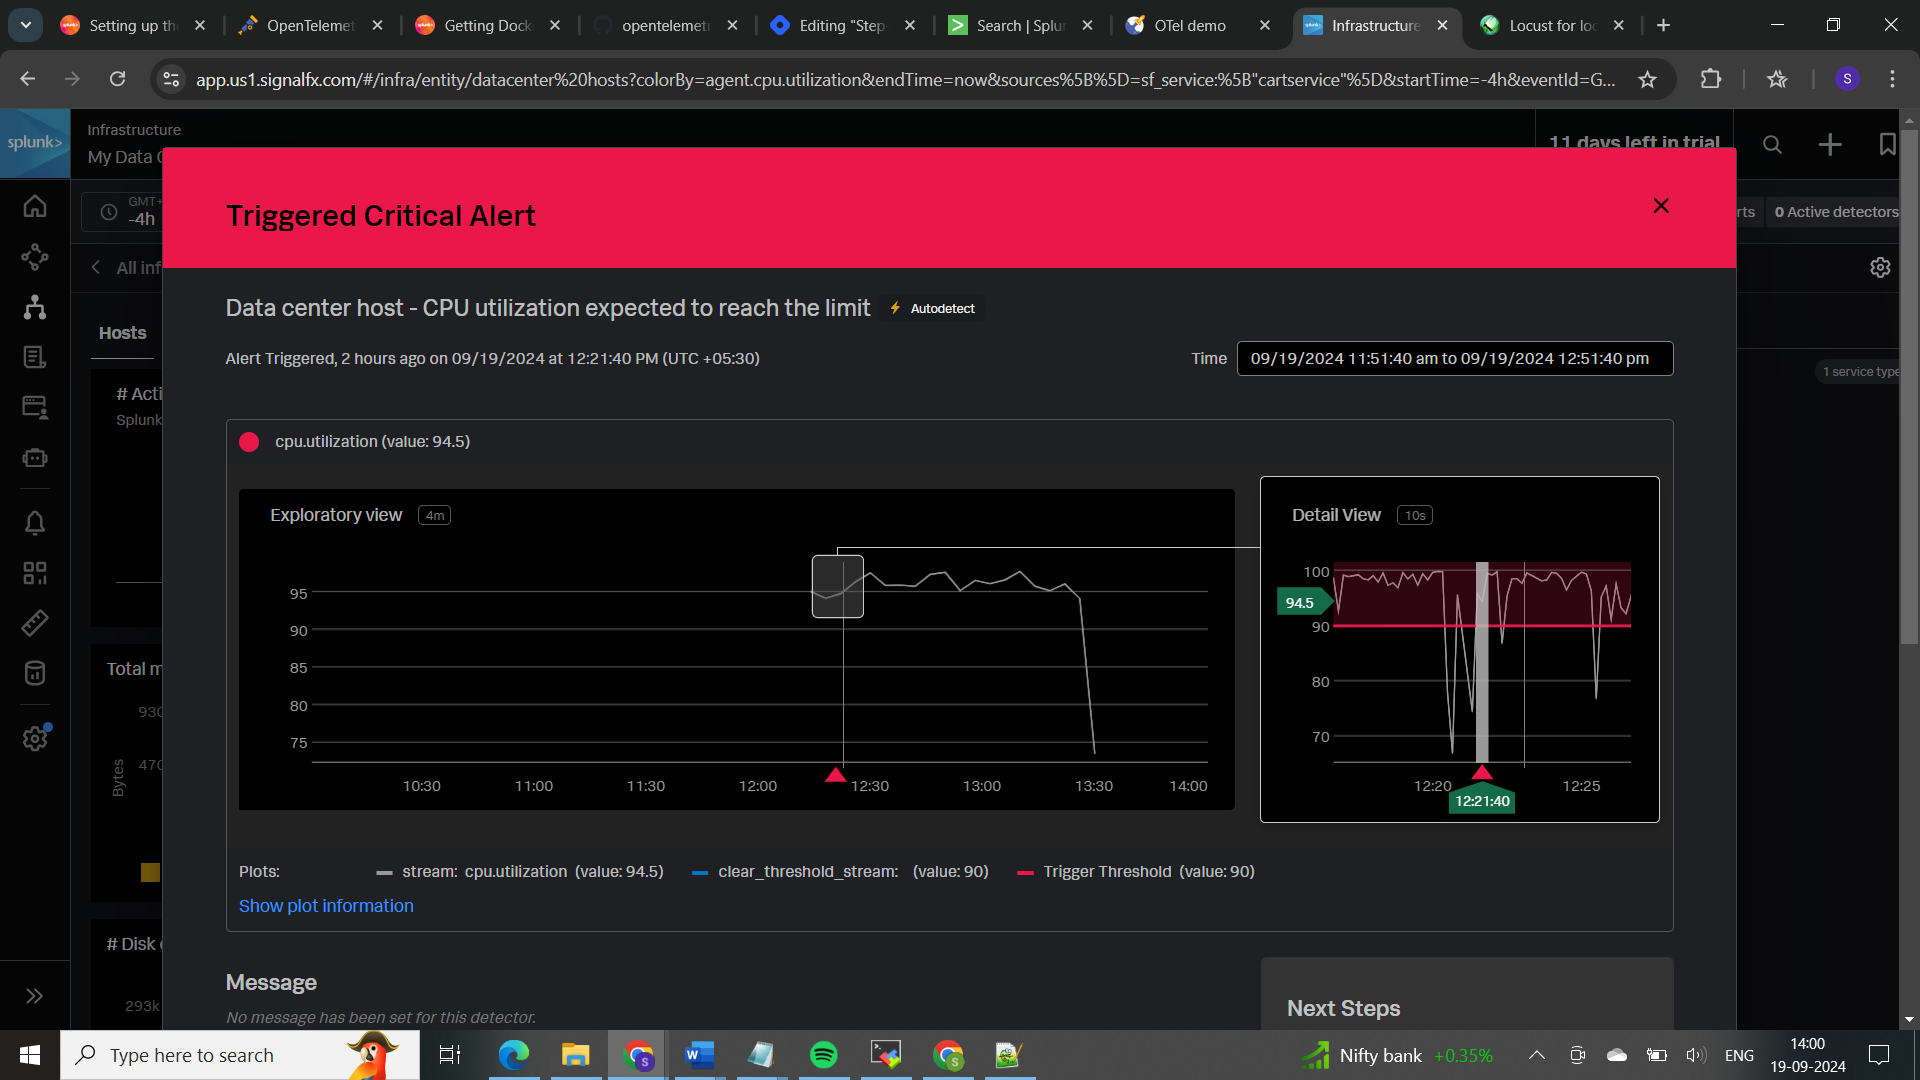
Automatic alert will be triggered if the particular metric reaches its threshold
𝐀𝐏𝐌 (𝐀𝐩𝐩𝐥𝐢𝐜𝐚𝐭𝐢𝐨𝐧 𝐩𝐞𝐫𝐟𝐨𝐫𝐦𝐚𝐧𝐜𝐞 𝐌𝐨𝐧𝐢𝐭𝐨𝐫𝐢𝐧𝐠):
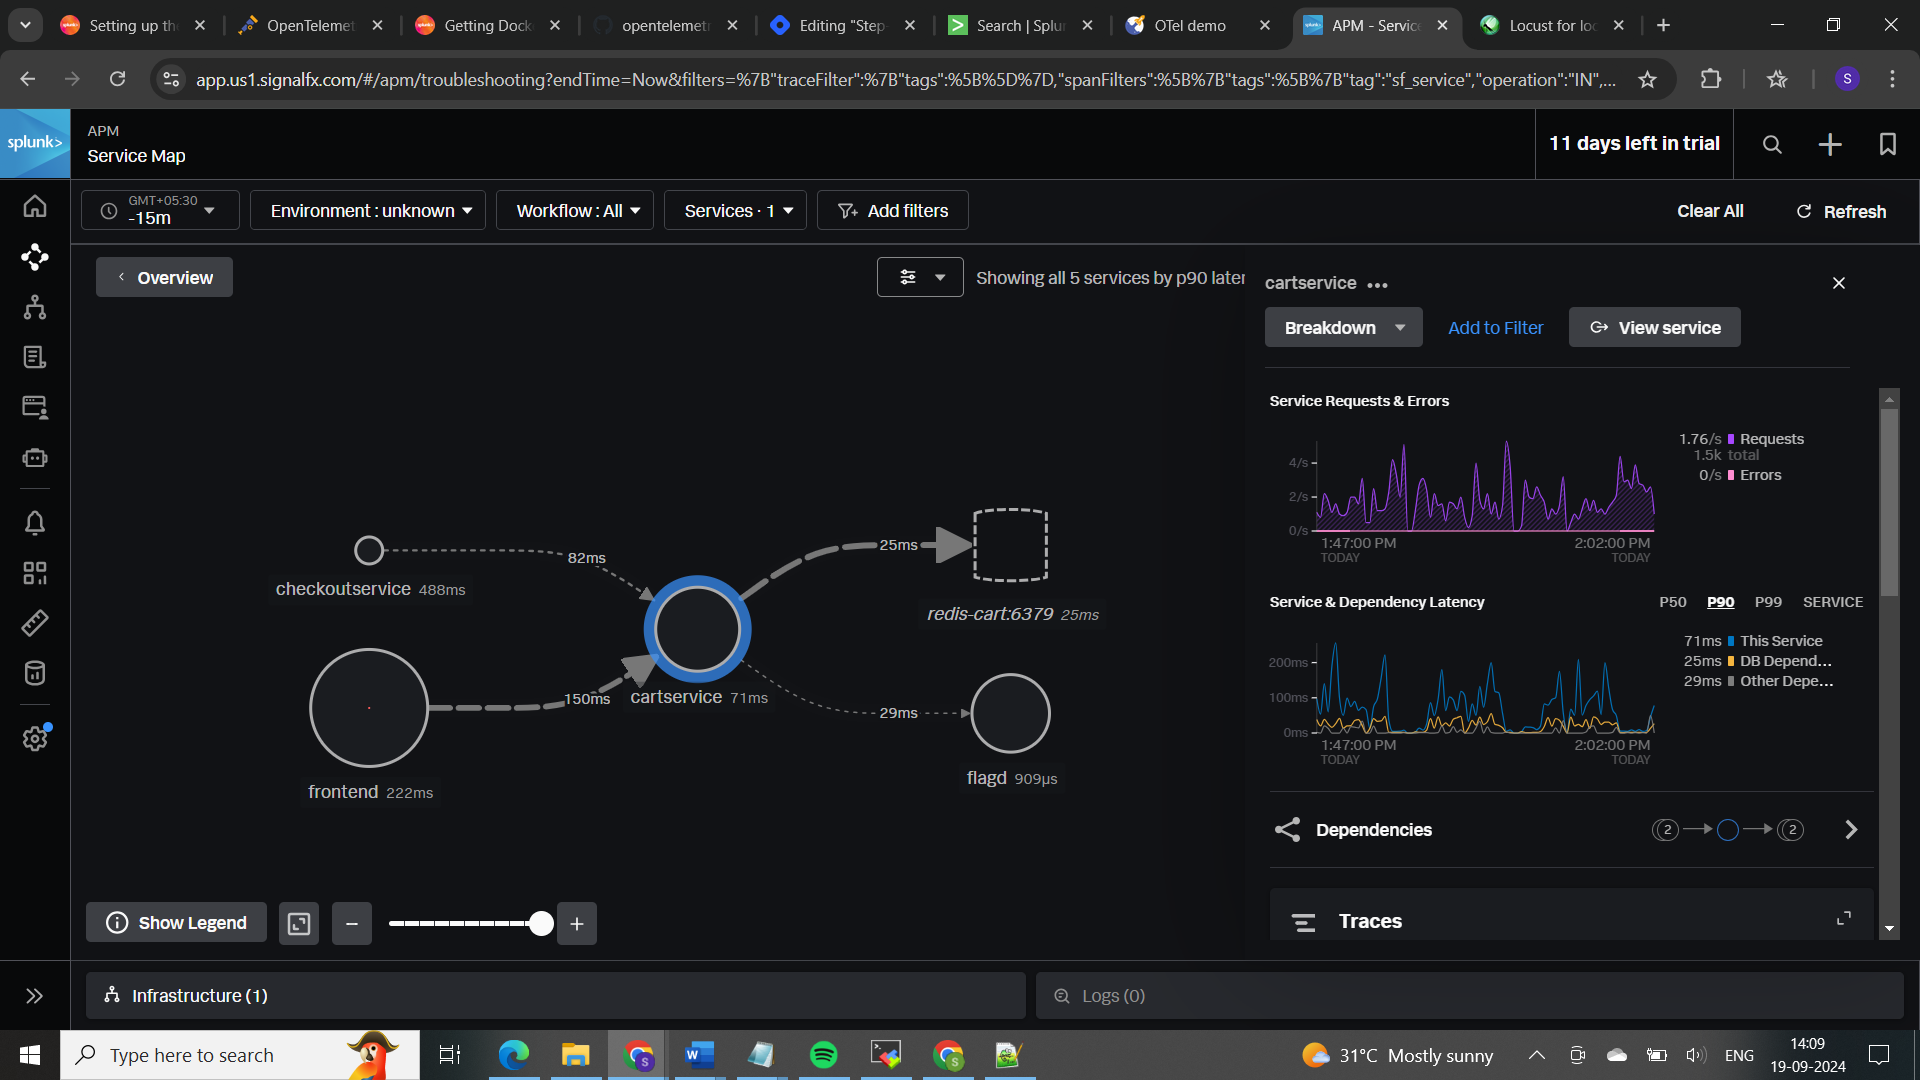
𝐓𝐫𝐚𝐜𝐢𝐧𝐠 𝐚𝐬 𝐩𝐞𝐫 𝐬𝐞𝐫𝐯𝐢𝐜𝐞 𝐭𝐲𝐩𝐞 (𝐜𝐚𝐫𝐭-𝐬𝐞𝐫𝐯𝐢𝐜𝐞):
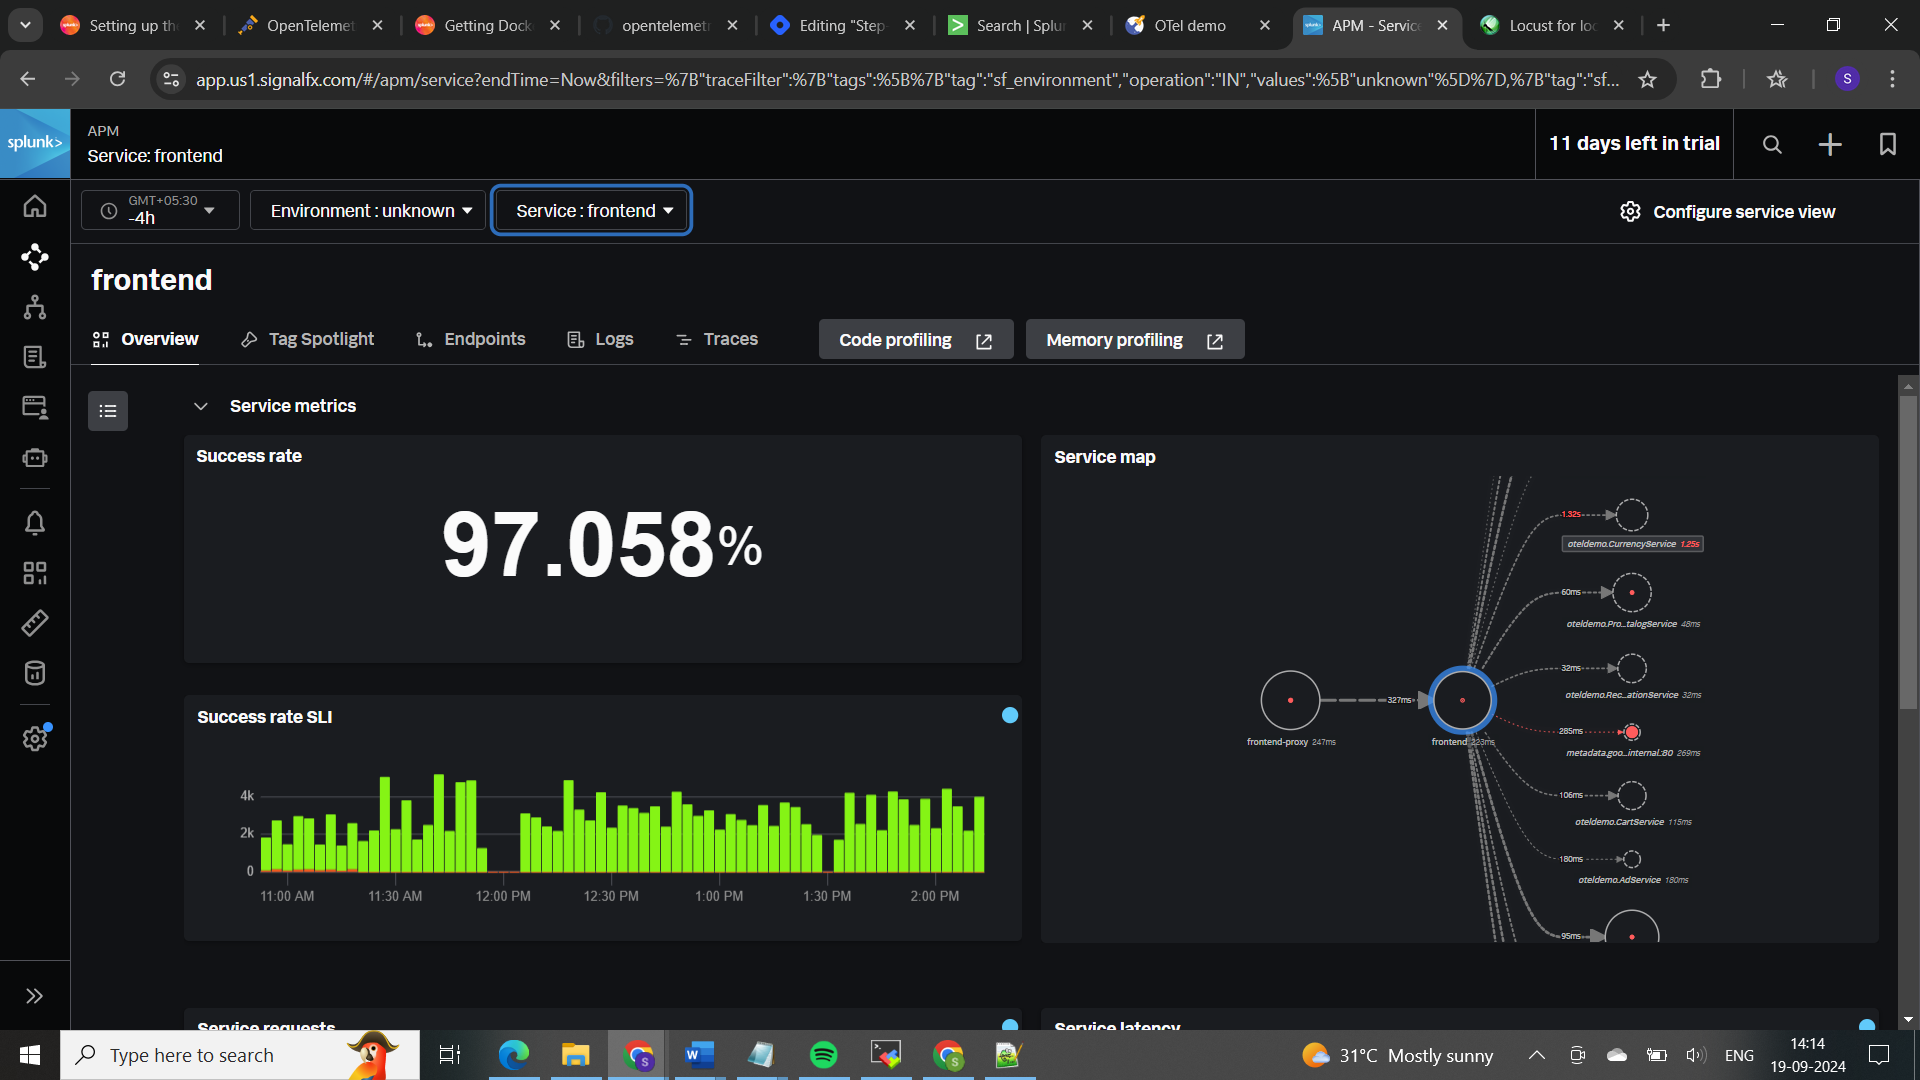
𝐓𝐨 𝐜𝐡𝐞𝐜𝐤 𝐬𝐮𝐜𝐜𝐞𝐬𝐬 𝐫𝐚𝐭𝐞:
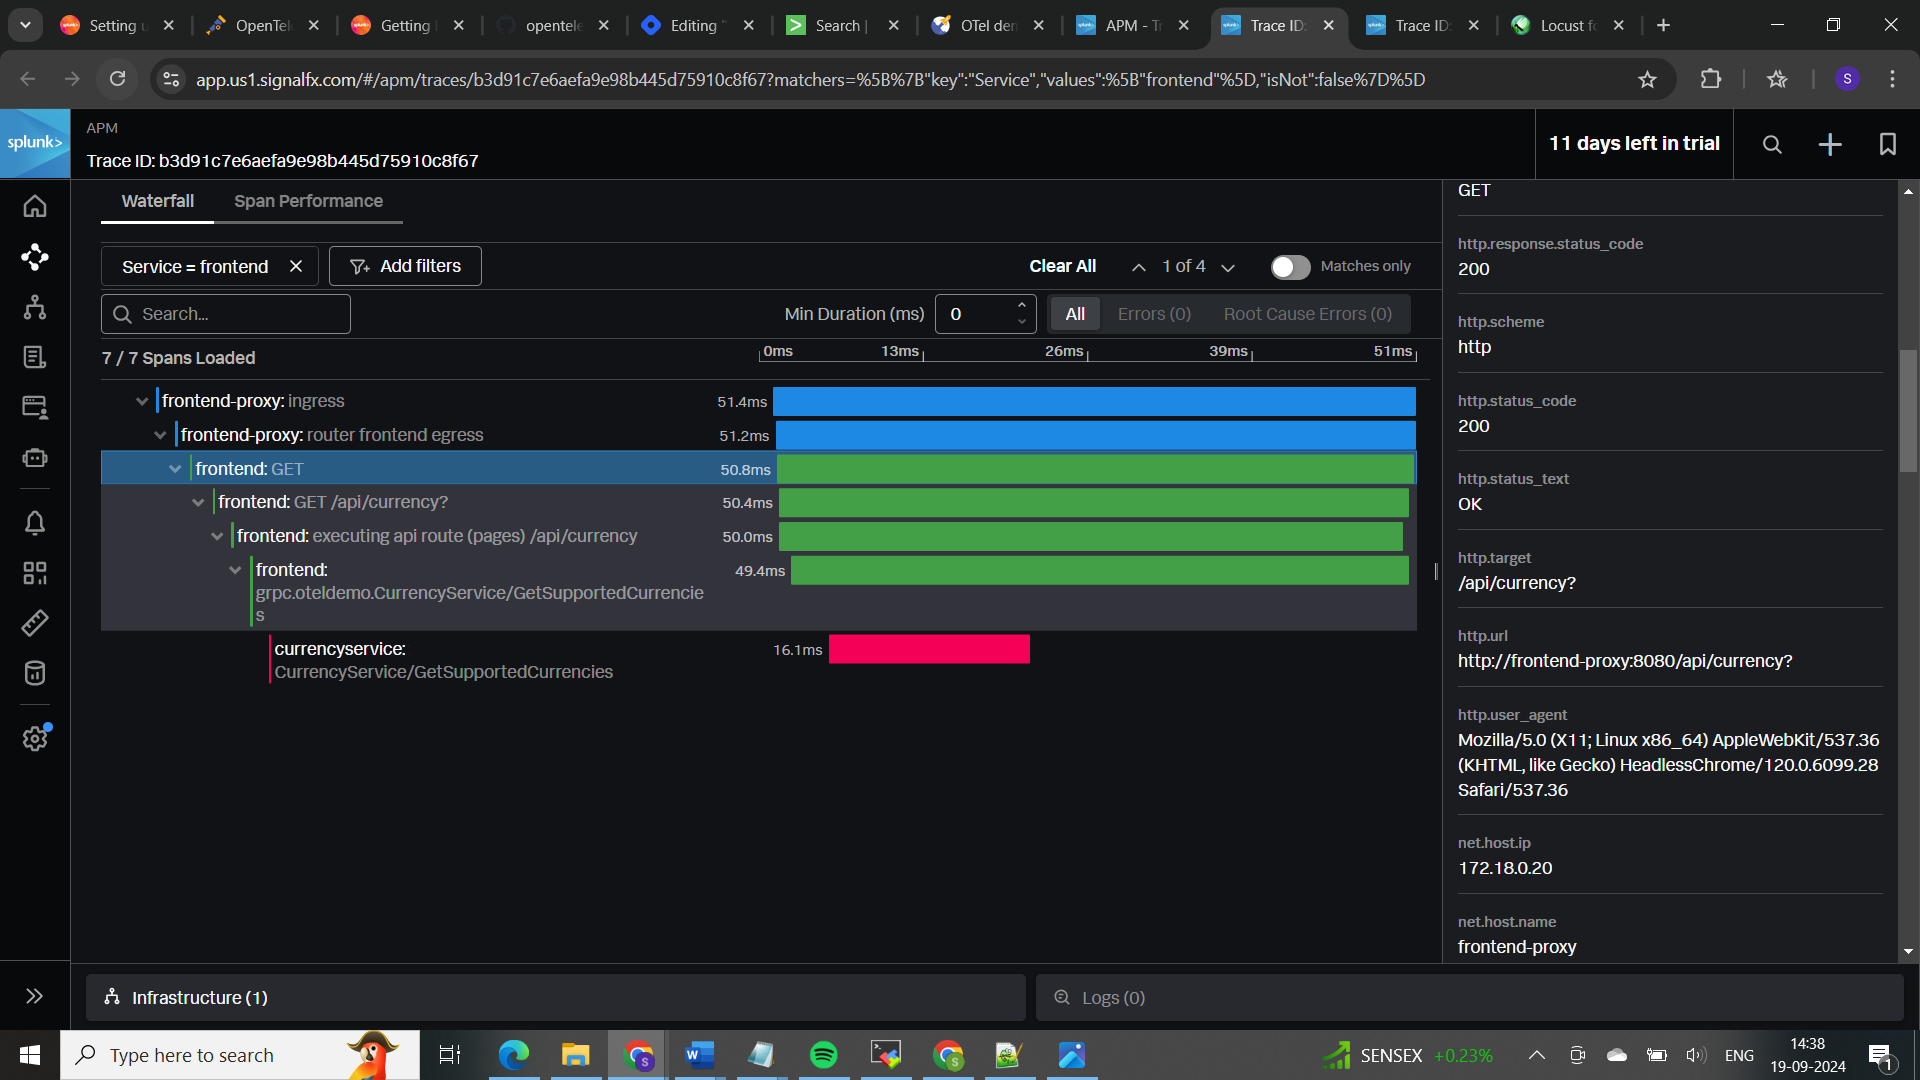
tracing based on traceid in a service allows you to follow the path of a request across different services, helping to understand the end-to-end execution of transactions.
Useful links for more info:
https://lantern.splunk.com/Data_Descriptors/Docker/Setting_up_the_OpenTelemetry_Demo_in_Docker
https://lantern.splunk.com/Data_Descriptors/Docker/Getting_Docker_log_data_into_Splunk_Cloud_Platform_with_OpenTelemetry
https://opentelemetry.io/docs/demo/
𝖳𝗁𝖾𝗌𝖾 𝗌𝗍𝖾𝗉𝗌 𝗐𝗂𝗅𝗅 𝗁𝖾𝗅𝗉 𝗒𝗈𝗎 𝗌𝖾𝗍 𝗎𝗉 𝖺𝗇 𝗈𝖻𝗌𝖾𝗋𝗏𝖺𝖻𝗂𝗅𝗂𝗍𝗒 𝖽𝖾𝗆𝗈 𝖾𝗇𝗏𝗂𝗋𝗈𝗇𝗆𝖾𝗇𝗍 𝗐𝗂𝗍𝗁 𝖮𝗉𝖾𝗇𝖳𝖾𝗅𝖾𝗆𝖾𝗍𝗋𝗒 𝖺𝗇𝖽 𝖣𝗈𝖼𝗄𝖾𝗋, 𝖺𝗅𝗅𝗈𝗐𝗂𝗇𝗀 𝗒𝗈𝗎 𝗍𝗈 𝖽𝗂𝗏𝖾 𝗂𝗇𝗍𝗈 𝖽𝗂𝗌𝗍𝗋𝗂𝖻𝗎𝗍𝖾𝖽 𝗍𝗋𝖺𝖼𝗂𝗇𝗀 𝖺𝗇𝖽 𝖾𝖿𝖿𝖾𝖼𝗍𝗂𝗏𝖾𝗅𝗒 𝗆𝗈𝗇𝗂𝗍𝗈𝗋 𝖺𝗇𝖽 𝗍𝗋𝗈𝗎𝖻𝗅𝖾𝗌𝗁𝗈𝗈𝗍 𝗆𝗂𝖼𝗋𝗈𝗌𝖾𝗋𝗏𝗂𝖼𝖾𝗌 𝖺𝗉𝗉𝗅𝗂𝖼𝖺𝗍𝗂𝗈𝗇𝗌.
Subscribe to my newsletter
Read articles from Sakeena Shaik directly inside your inbox. Subscribe to the newsletter, and don't miss out.
Written by

Sakeena Shaik
Sakeena Shaik
🌟 DevOps Specialist | CICD | Automation Enthusiast 🌟 I'm a passionate DevOps engineer who deeply loves automating processes and streamlining workflows. My toolkit includes industry-leading technologies such as Ansible, Docker, Kubernetes, and Argo-CD. I specialize in Continuous Integration and Continuous Deployment (CICD), ensuring smooth and efficient releases. With a strong foundation in Linux and GIT, I bring stability and scalability to every project I work on. I excel at integrating quality assurance tools like SonarQube and deploying using various technology stacks. I can handle basic Helm operations to manage configurations and deployments with confidence. I thrive in collaborative environments, where I can bring teams together to deliver robust solutions. Let's build something great together! ✨