AWS RDS PostgreSQL Hardening
 Mohamed El Eraki
Table of contents
- Inception
- Overview
- Tuning AWS RDS
- Hardening AWS RDS
- pg_prewarm — preload relation data into buffer caches
- AWS RDS Proxy
- max_wal_size
- pg_proctab extension
- Minor version upgrade
- Ensure the log destinations are set correctly
- Ensure the logging collector is enabled
- Ensure the correct messages are written to the server log
- Ensure the correct SQL statements generating errors are recorded
- Ensure 'log_statement' is set correctly
- Ensure the PostgreSQL Audit Extension (pgAudit) is enabled
- Ensure logging of replication commands is configured
- Ensure auto backups are configured and functional
- Managing Snapshots
- Enable random_page_cost
- Monitoring RDS Performance
- Resources
Inception
Hello everyone, This article is part of The Terraform + AWS series, And it depends on The AWS RDS Concept Essentials Article, I use this series to publish-out AWS + Terraform Projects & Knowledge.
This Article is written down based on practical experience, AWS Documentation, and CIS Benchmarks with summarizing, collecting, and listing down the important points.
Overview
Hello Gurus, Hardening RDS is a little tricky and its values differ from one situation to another, from company to another as well. Meanwhile, it’s a mandatory step after provisioning a server, database, etc.
The Hardening configurations ensure proper access, controls, collecting logs, audit, protection of data, Allowed ports, etc. It aims to reduce the risk of vulnerabilities.
What is the CIS Benchmark
While Hardening your systems is mandatory, it’s not easy to wade through all system parts and harden them. while hardening and tuning your system you should consider some factors like allowing only the ports and functions that your system depends on, ensuring you’re allowing all system dependencies to avoid affecting your system, and following a general guide that assists you wade through all system parts and here we come to The CIS Benchmarks.
The CIS Benchmark is a set of security best practices and configuration guidelines developed by the Center for Internet Security (CIS). These benchmarks are designed to improve the security posture of multiple platforms (i.e. Linux machines, windows, PostgreSQL Database) by providing recommendations for hardening configurations, ensuring proper access controls, and protecting data. They include measures for securing authentication, encryption, logging, and other critical parts of management areas to reduce the risk of vulnerabilities. Check out the resources below for more information.
Today’s Article will walk through Tuning & Hardening RDS configurations, as I have filtered the CIS Benchmarks and AWS best practices.
Tuning AWS RDS
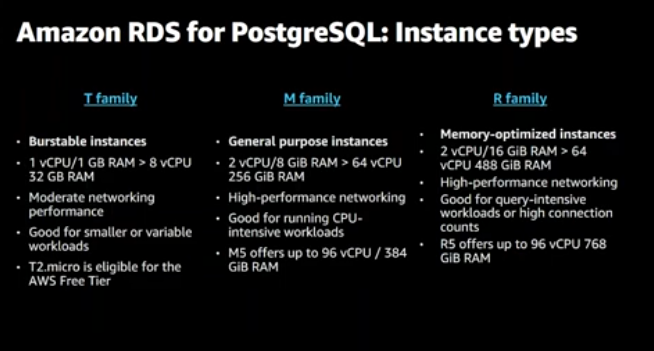
Instance types
Make sure to specify the right RDS instance type suite for your Datadriven usage. The screenshot below clear the common instance type families.
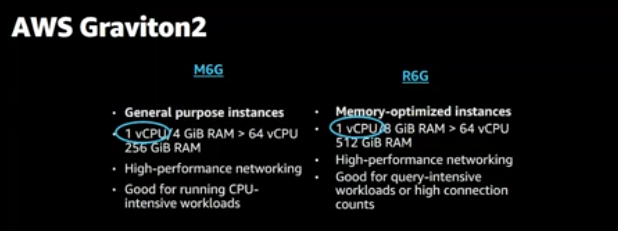
Consider using AWS Gravition2 for cost-saving and better CPU performance almost 30% higher
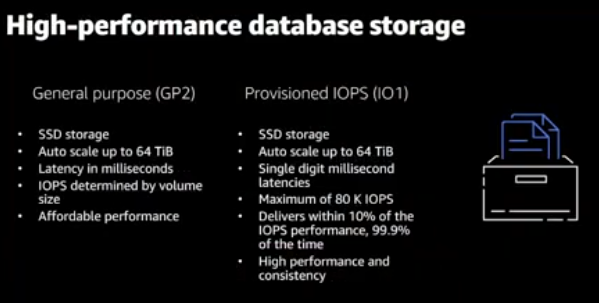
High-performance GP2 vs IOPS (1O1)
GP2 provides an SSD affordable performance storage with auto-scale up to 64 TiB, on the other hand, IOPS provides almost the same and it is directed to high-performance Input and output data-driven.
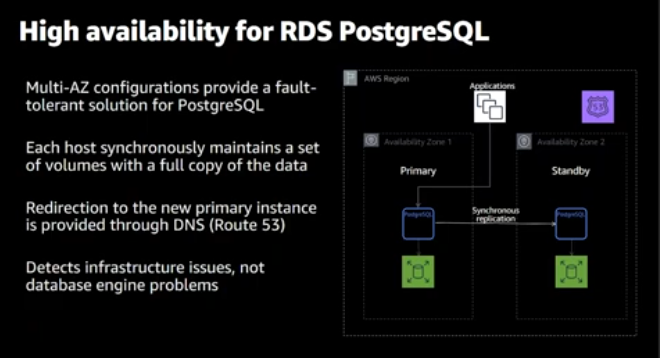
Multi-az RDS
Using multi-az RDS in separate to multiple availability zones is highly recommended.
AWS provides multiple options for High-availability RDS database
Read-replica: manually create an RDS then Create a read-replica, the read-replica RDS will accept the application connection for read-only. However, you will manage the failover manually.
Multi-az Instance: provides you with an RDS primary and another one as standby, The standby will not accept application connection. However, AWS Manages the failover.
Multi-az cluster: Provides an RDS with two Stand-by RDSs. One of them accepts the read connection.
Hardening AWS RDS
pg_prewarm — preload relation data into buffer caches
The pg_prewarm module provides a convenient way to load relation data into either the operating system buffer cache or the PostgreSQL buffer cache. Prewarming can be performed manually using the pg_prewarm function, or can be performed automatically by including pg_prewarm in shared_preload_libraries. In the latter case, the system will run a background worker which periodically records the contents of shared buffers in a file called autoprewarm.blocks and will, using 2 background workers, reload those same blocks after a restart.
While restarting the database for example, The issue lies in the time to come back to the upstate from the last cache file, It takes a long to be able to start response. to solve that enable pg_prewarm.
The Screenshot below clear the time the RDS will take to start a response after restarting without using pg_prewarm.
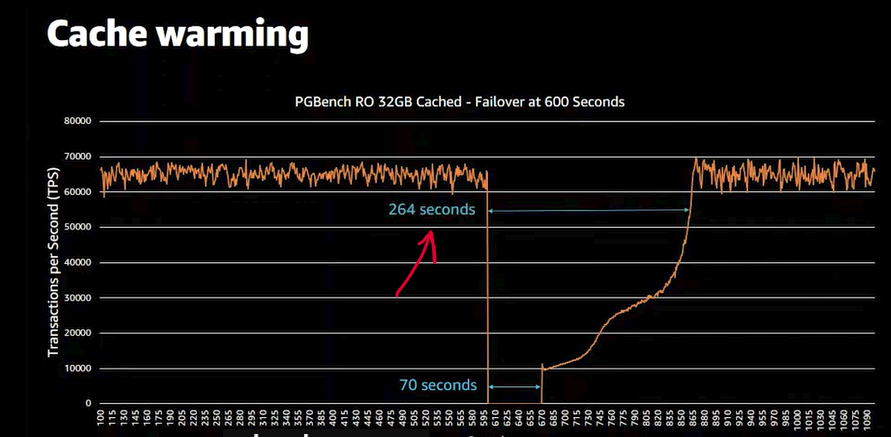
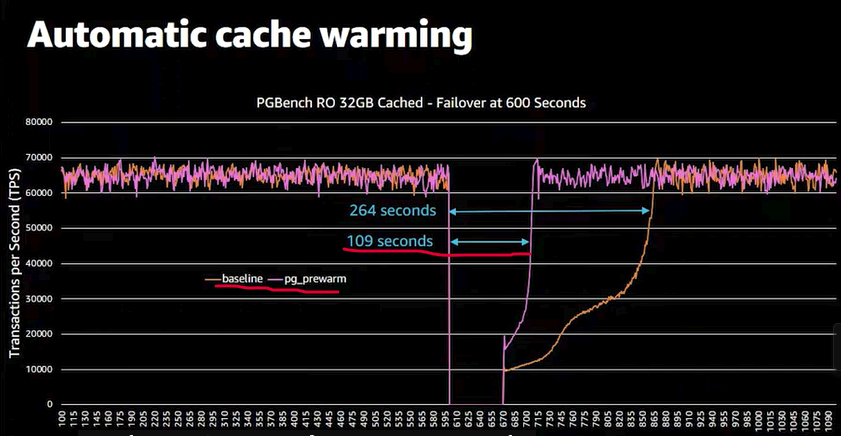
The pg_prewarm is working by pushing all the cache files to the standby; So, will end up having the same cache file on both instances.
The Screenshot below clear the time the RDS will take to start a response after restarting using pg_prewarm against without it.
Configure pg_prewarm
Step 1: Ensure pg_prewarm is Loaded
Verify
pg_prewarmis inshared_preload_libraries:SHOW shared_preload_libraries;Ensure that
pg_prewarmappears in the list. If it does not, add it into theshared_preload_librariesparameters group and restart the RDS. you can append multiple values with comma separated
e.g.pg_cron,pg_prewarm,pg_stat_statements,auto_explain
Step 2: Verify Extension Installation
Check if
pg_prewarmis installed:SELECT * FROM pg_available_extensions WHERE name = 'pg_prewarm';Enable the
pg_prewarmExtension (if not already enabled):CREATE EXTENSION pg_prewarm;
Step 3: Enable and Verify autoprewarm
Enable
pg_prewarm.autoprewarmParameter:Ensure that the pg_prewarm.autoprewarm into parameters group is set to ON.

Start the Autoprewarm Worker:
SELECT autoprewarm_start_worker();This command will output with an error: autoprewarm worker is already running.
AWS RDS Proxy
By using Amazon RDS Proxy, you can allow your applications to pool and share database connections to improve their ability to scale. RDS Proxy makes applications more resilient to database failures by automatically connecting to a standby DB instance while preserving application connections. By using RDS Proxy, you can also enforce AWS Identity and Access Management (IAM) authentication for databases, and securely store credentials in AWS Secrets Manager. check AW RDS proxy for more info.
In the case of failover, the RDS proxy will hold the application connection; Thus, the application shouldn’t re-establish the connection again.
Meanwhile, ensure that the AWS Proxy limitation does not affect your Aims, Check AWS RDS limitations for more info.
max_wal_size
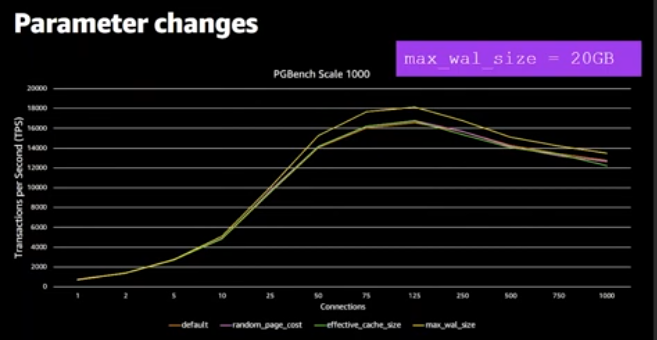
PostgreSQL uses max_wal_size logging changes running on the database before submitting it, ensuring data integrity.
The max_wal_size controls the maximum size of WAL files can reach before trigger a checkpoint, and writing all changes into the WAL pages (i.e. saved into the buffer) to the disk and resetting the WAL again.
by default max_wall_size is set to 2GB approximately, setting it higher will provide better performance. As the below screenshot when you set that to 20GB That makes your transaction log size bigger there for get the fastest response avoiding checkpoints. However, when set max_wal_size higher the database will take a longer time to fail-over. That is the business decision you have to make.
pg_proctab extension
pg_proctabe Gives us deeper visibility into what running on the Database by creating functions that expose system metrics through SQL command, install it by using the below command
create extension <extension_name>
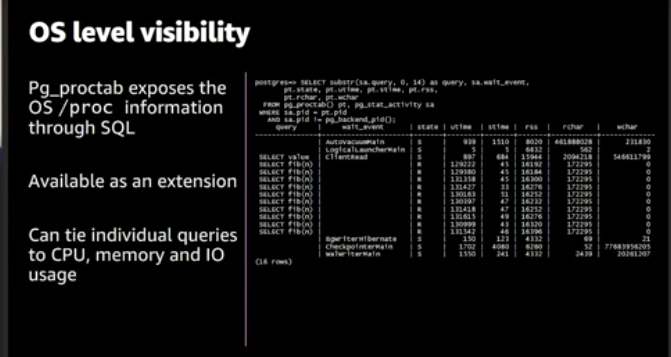
plporfile provides deeper output to use it you should append it to the shared_preload_libraries of parameter group, then create an extension for plprofile as below screenshot. this extension should be working beside pg_proctab, View more examples in the video resource below in the profile stored procedure section.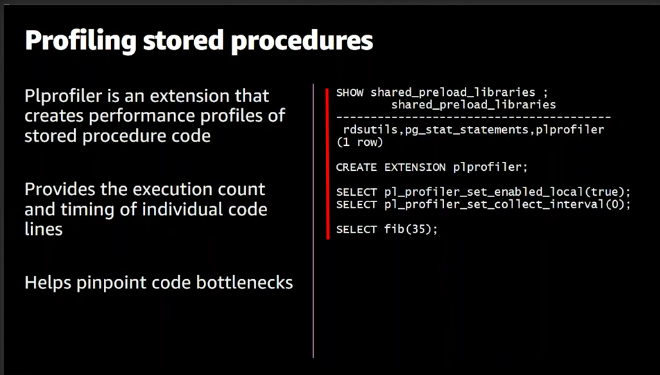
Minor version upgrade
While creating an RDS There’s an option to enable or disable the minor version upgrade, by enabling it ensures your database keeps updated with patches, new features, etc.
The Upgrade can be done automatically in the configured maintenance windows, or even manually.
Ensure the log destinations are set correctly
PostgreSQL supports several methods for logging server messages, including stderr, csvlog , syslog, and jsonlog . One or more of these destinations should be set for server log output. By default the log_destination set to stderr you can append csvlog as well.
update The log_destination RDS parameter group as follows: csvlog, stderr
Ensure the logging collector is enabled
The logging collector is a background process that captures log messages sent to stderr and redirects them into log files. The logging_collector setting must be enabled in order for this process to run. enabling this by set 1 value to logging_collector RDS parameter group.
log_destination is either stderr or csvlog or logs will be lost. Certain other logging parameters require it as well.Execute the following SQL statement and confirm that the logging_collector is enabled ( on ):
postgres=# show logging_collector;
logging_collector

on
(1 row)
Ensure the correct messages are written to the server log
The log_min_messages setting specifies the message levels that are written to the server log. Each level includes all the levels that follow it. The lower the level (vertically, below) the fewer messages are logged. Valid values are:
DEBUG5 <-- exceedingly chatty
DEBUG4
DEBUG3
DEBUG2
DEBUG1
INFO
NOTICE
WARNING <-- default
ERROR
LOG
FATAL
PANIC <-- practically mute
Choosing which level depends on your situation. However, The log level is logging the most needed logs. configure this by adjusting the parameter group as well.
as well as ensure configuring the following parameters, cron.log_min_message controls the auto-run logging verbosity, pgactive.log_min_message This would be similar to cron.log_min_messages but applied to the pgactive extension or functionality. It allows fine-grained control over the logging for this specific module.

Ensure the correct SQL statements generating errors are recorded
The log_min_error_statement setting causes all SQL statements generating errors at or above the specified severity level to be recorded in the server log. Each level includes all the levels that follow it. The lower the level (vertically, below,) the fewer messages are recorded. Valid values are:
DEBUG5 <-- exceedingly chatty
DEBUG4
DEBUG3
DEBUG2
DEBUG1
INFO
NOTICE
WARNING
ERROR <-- default
LOG
FATAL
PANIC <-- practically mute
is considered the best practice setting. Changes should only be made in accordance with your organization's logging policy. ERROR. Adjusting this value into The RDS parameter group
Execute the following SQL statement to verify the setting is correct:
postgres=# show log_min_error_statement;

log_min_error_statement

error (1 row)
Ensure 'log_statement' is set correctly
The log_statement setting specifies the types of SQL statements that are logged, the values are:
none (off)
ddl
only Data Definition Language (DDL) statements are logged. DDL statements are commands that defineCREATE,ALTER,DROP,TRUNCATE,COMMENTdatabase objects such as tables, indexes, and schemas.mod
modification statements are logged. This includes all Data Manipulation Language (DML) statements that modify data, such asINSERT,UPDATE,DELETE, andCOPY.all (all statements)
CIS Benchmarks recommend setting to ddl. However, I tried to set it to dll, mod ensure to collect all statements and then utilize another system to filter and analyze logs
Configure this by adjusting The RDS parameter group as follows as well as enable its cron job:

Execute the following SQL statement to verify the setting is correct:
postgres=# show log_statement;

log_statement
none (1 row)
Ensure the PostgreSQL Audit Extension (pgAudit) is enabled
The pgaudit extension (PostgreSQL Audit) is a PostgreSQL extension designed to provide detailed logging of database activities for auditing purposes. It enhances PostgreSQL's built-in logging capabilities by allowing more granular control over which types of SQL statements are logged, making it easier to track user activity, changes to the database, and access to sensitive data. This extension is particularly useful for meeting regulatory and compliance requirements, such as GDPR, PCI-DSS, or HIPAA, which require detailed audit logs of database access and modifications.
enable it by appending it to the shared_preload_libraries and the other pgaudit parameters as follows:
| parameter name | value |
| pgaudit.log | dll,write |
| pgaudit.log_catalog | 1 |
| pgaudit.log_level | log |
| pgaudit.log_parameter | 1 |
| shared_preload_libraries | pg_cron,pg_prewarm,pg_state_statements,auto_explian,pgaudit |
verify pgAudit is enabled by running the following commands:
postgres=# show shared_preload_libraries;
shared_preload_libraries
(1 row)
If the output does not contain the desired auditing components, this is a fail.
The list below summarizes pgAudit.log components:
READ: SELECT and COPY when the source is a relation or a query.
WRITE: INSERT, UPDATE, DELETE, TRUNCATE, and COPY when the destination is a relation.
FUNCTION: Function calls and DO blocks.
ROLE: Statements related to roles and privileges: GRANT, REVOKE, CREATE/ALTER/DROP ROLE.
DDL: All DDL that is not included in the ROLE class.
MISC: Miscellaneous commands, e.g. DISCARD, FETCH, CHECKPOINT, VACUUM.
Ensure logging of replication commands is configured
Enabling the log_replication_commands setting causes each attempted replication from the server to be logged. and Note that it does not log failover done by AWS.
Enabling this by setting 1 value to log_replication_commands parameter.
Check the current value of log_replication_commands :
postgres=# show log_replication_commands;

log_replication_commands
off (1 row)
Ensure auto backups are configured and functional
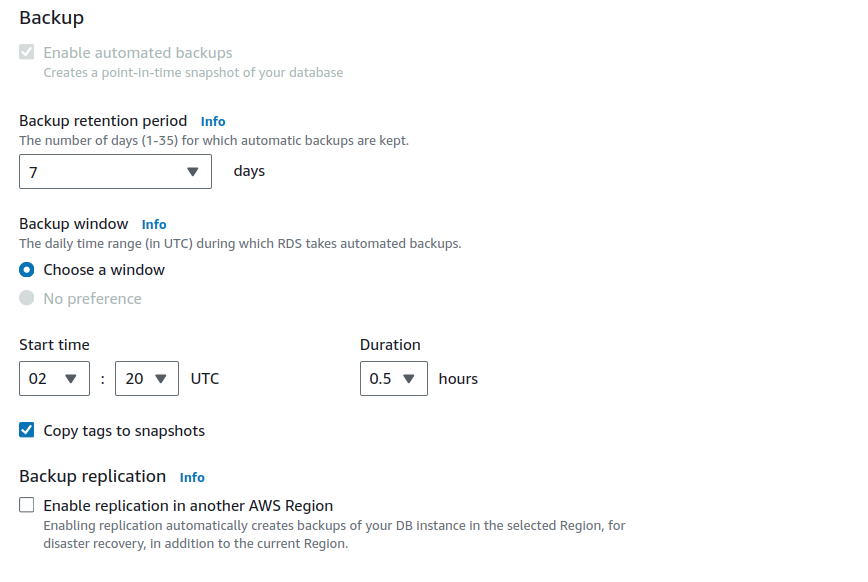
Setting up an auto backup is a crucial function that enables you to sort backups and revert back to them, Configuring automatic backup while creating/editing The RDS at the backup section as follows, Ensure the backup is enabled and set the retention to 7 days. Then, Check Automated backups to view taken backups.
Managing Snapshots
Creating manual snapshots is very useful while updating/Changing your database and want to take a checkpoint before any action. Snapshots assist you achieve that.
You can create snapshots by pressing Snapshots on the left panel from the RDS page.
Enable random_page_cost
The random_page_cost parameter helps the PostgreSQL query planner decide the most efficient way to execute a query. It influences the choice between using an index scan and a sequential scan.
Adjust the random_page_cost Parameter group with 1 value.
Monitoring RDS Performance
Amazon RDS basic operational guidelines
Use metrics to monitor your memory, CPU, replica lag, and storage usage. You can set up Amazon CloudWatch to notify you when the usage patterns change or when your deployment approaches capacity limits. This allows you to maintain system performance and availability.
Scale up your DB instance when you are approaching storage capacity limits. You should have some buffer in storage and memory to accommodate unforeseen increases in demand from your applications.
Enable automatic backups and set the backup window to occur during the daily low in write IOPS. That's when a backup is least disruptive to your database usage. will talk about this shortly.
If your database workload requires more I/O than you have provisioned, recovery after a failover or database failure will be slow. To increase the I/O capacity of a DB instance, do any or all of the following:
Migrate to a different DB instance class with high I/O capacity.
Convert from magnetic storage to either General Purpose or Provisioned IOPS storage, depending on how much of an increase you need. For information on available storage types, see Amazon RDS storage types.
If you convert to Provisioned IOPS storage, make sure you also use a DB instance class that is optimized for Provisioned IOPS. For information on Provisioned IOPS, see Provisioned IOPS SSD storage.
If you are already using Provisioned IOPS storage, provision additional throughput capacity.
If your client application is caching the Domain Name Service (DNS) data of your DB instances, set a time-to-live (TTL) value of less than 30 seconds. The underlying IP address of a DB instance can change after a failover. Caching the DNS data for an extended time can thus lead to connection failures. Your application might try to connect to an IP address that's no longer in service.
Test failover for your DB instance to understand how long the process takes for your particular use case. Also, test failover to ensure that the application that accesses your DB instance can automatically connect to the new DB instance after failover occurs.
Test Failover:
From the "Actions" menu, choose "Failover".
Confirm the failover operation when prompted.
DB instance RAM recommendations
An Amazon RDS performance best practice is to allocate enough RAM so that your working set resides almost completely in memory. The working set is the data and indexes that are frequently in use on your instance. The more you use the DB instance, the more the working set will grow.
To tell if your working set is almost all in memory, check the ReadIOPS metric (using Amazon CloudWatch) while the DB instance is under load. The value of ReadIOPS should be small and stable. In some cases, scaling up the DB instance class to a class with more RAM results in a dramatic drop in ReadIOPS. In these cases, your working set was not almost completely in memory. Continue to scale up until ReadIOPS no longer drops dramatically after a scaling operation, or ReadIOPS is reduced to a very small amount. For information on monitoring a DB instance's metrics, see Viewing metrics in the Amazon RDS console.
Using Enhanced Monitoring to Identify Operating System Issues
When Enhanced Monitoring is enabled, Amazon RDS provides metrics in real time for the operating system (OS) that your DB instance runs on. You can view the metrics for your DB instance using the console. You can also consume the Enhanced Monitoring JSON output from Amazon CloudWatch Logs in a monitoring system of your choice. For more information about Enhanced Monitoring, see Monitoring OS metrics with Enhanced Monitoring.
Performance metrics
You should monitor performance metrics on a regular basis to see the average, maximum, and minimum values for a variety of time ranges. If you do so, you can identify when performance is degraded. You can also set Amazon CloudWatch alarms for particular metric thresholds so you are alerted if they are reached.
To troubleshoot performance issues, it's important to understand the baseline performance of the system. When you set up a DB instance and run it with a typical workload, capture the average, maximum, and minimum values of all performance metrics. Do so at a number of different intervals (for example, one hour, 24 hours, one week, two weeks). This can give you an idea of what is normal. It helps to get comparisons for both peak and off-peak hours of operation. You can then use this information to identify when performance is dropping below standard levels.
If you use Multi-AZ DB clusters, monitor the time difference between the latest transaction on the writer DB instance and the latest applied transaction on a reader DB instance. This difference is called replica lag. For more information, see Replica lag and Multi-AZ DB clusters.
You can view the combined Performance Insights and CloudWatch metrics in the Performance Insights dashboard and monitor your DB instance. To use this monitoring view, Performance Insights must be turned on for your DB instance. For information about this monitoring view, see Viewing combined metrics in the Amazon RDS console.
You can create a performance analysis report for a specific time period and view the insights identified and the recommendations to resolve the issues. For more information see, Creating a performance analysis report.
View performance metrics
Sign in to the AWS Management Console and open the Amazon RDS console at https://console.aws.amazon.com/rds/
In the navigation pane, choose Databases, and then choose a DB instance.
Choose Monitoring.
The dashboard provides the performance metrics. The metrics default to show the information for the last three hours.
Use the numbered buttons in the upper-right to page through the additional metrics, or adjust the settings to see more metrics.
Choose a performance metric to adjust the time range in order to see data for other than the current day. You can change the Statistic, Time Range, and Period values to adjust the information displayed. For example, you might want to see the peak values for a metric for each day of the last two weeks. If so, set Statistic to Maximum, Time Range to Last 2 Weeks, and Period to Day.
You can also view performance metrics using the CLI or API. For more information, see Viewing metrics in the Amazon RDS console.
Set a CloudWatch alarm
Sign in to the AWS Management Console and open the Amazon RDS console at https://console.aws.amazon.com/rds/
In the navigation pane, choose Databases, and then choose a DB instance.
Choose Logs & events.
In the CloudWatch alarms section, choose Create alarm.
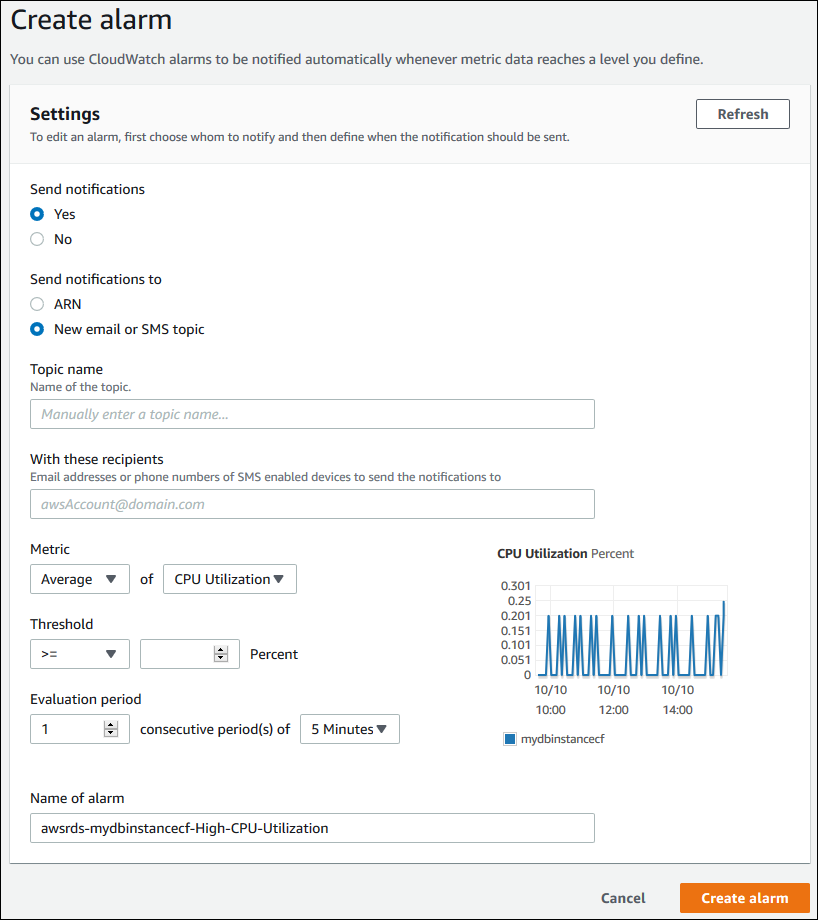
For Send notifications, choose Yes, and for Send notifications to, choose New email or SMS topic.
For Topic name, enter a name for the notification, and for With these recipients, enter a comma-separated list of email addresses and phone numbers.
For Metric, choose the alarm statistic and metric to set.
For Threshold, specify whether the metric must be greater than, less than, or equal to the threshold, and specify the threshold value.
For Evaluation period, choose the evaluation period for the alarm. For consecutive period(s) of, choose the period during which the threshold must have been reached in order to trigger the alarm.
For Name of alarm, enter a name for the alarm.
Choose Create Alarm.
The alarm appears in the CloudWatch alarms section.
Forward logs to AWS S3
AWS provides you aws_s3 extension that enables you to forward RDS Logs to S3 bucket. However, I do not recommend this option as its mechanism works by uploading all database logs into RDS tables then the RDS manages to send these logs to S3. This operation overwhelms the RDS with nonmain function.
Follow up this link for more:
https://aws.amazon.com/blogs/database/automate-postgresql-log-exports-to-amazon-s3-using-extensions/
Fetching logs to centralize machine
while working with fetching RDS logs to a centralized place you have many options as using aws_s3 extension and lambda function fetching the logs to another place. Also, you can use a very simple AWS CLI command to fetch the logs with your customized filtration.
The below code sample fetches postgres user login/logout logs every 10 MIN.
aws logs filter-log-events  --log-group-name <"log/group/name"> \
--log-stream-names <"log-stream-name"> \
--filter-pattern '"connection authorized: user=postgres"'    \
--start-time $(date -d '10 minutes ago' +%s000) \
--region <"region">
Resources
That's it, Very straightforward, very fast🚀. Hope this article inspired you and will appreciate your feedback. Thank you
Subscribe to my newsletter
Read articles from Mohamed El Eraki directly inside your inbox. Subscribe to the newsletter, and don't miss out.
Written by

Mohamed El Eraki
Mohamed El Eraki
Cloud & DevOps Engineer, Linux & Windows SysAdmin, PowerShell, Bash, Python Scriptwriter, Passionate about DevOps, Autonomous, and Self-Improvement, being DevOps Expert is my Aim.