Discover the Power of Waterfall Charts | Fusioncharts
 Fusion Charts
1 min read
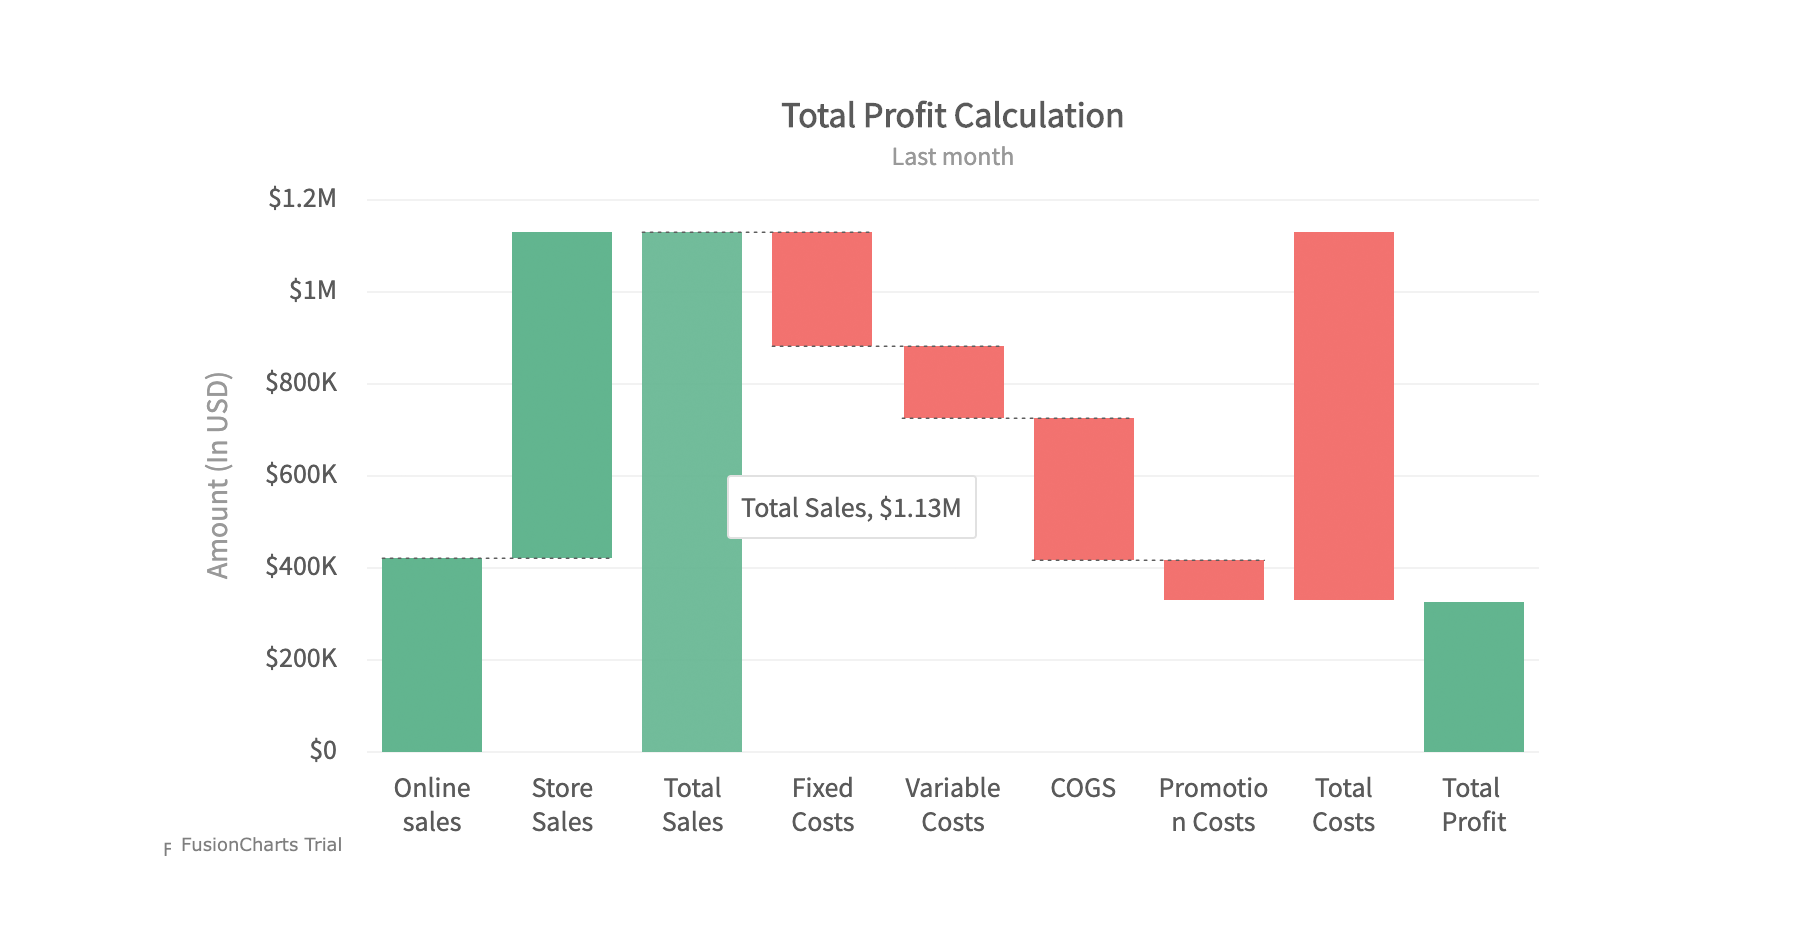
Curious about how waterfall charts can help visualize cumulative data and show how individual contributions lead to a total? Learn the fundamentals of waterfall charts, including their structure, key features, and how they can simplify complex data trends in business, finance, and more. Dive into this guide for a clear understanding of how to make informed decisions using this powerful visualization tool.

0
Subscribe to my newsletter
Read articles from Fusion Charts directly inside your inbox. Subscribe to the newsletter, and don't miss out.
Written by
