How To Use a Siem tool in a real-life situation
 alice eneyo

google pics
In this guide, I’ll walk you through the steps to set up a home lab for Elastic Stack Security Information and Event Management (SIEM) using AWS EC2 Ubuntu and Elastic Cloud. You’ll also learn how to generate security events, configure an agent to forward data to the SIEM, and query and analyze the Elastic Cloud SIEM platform logs.
Prerequisites
Before we begin, ensure you have the following in place:
Access to AWS EC2 Ubuntu or a similar cloud-based environment
An Elastic Cloud account
A basic understanding of Linux and cloud infrastructure.
Task Overview:
Sign up for a free Elastic Cloud account.
Launch an Ubuntu instance on AWS EC2.
Install and configure the Elastic Agent on the Ubuntu instance to collect logs and forward them to Elastic SIEM.
Generate security events on the Ubuntu instance using the
nmapcommand.Query and analyze the security events in Elastic SIEM.
Create a dashboard to visualize the security events.
Set up alerts for critical security events.
Please note that the look and layout of the Elastic Cloud console may change with updates. These instructions are accurate as of the time of writing but may need revisions for future versions. If you notice any discrepancies or changes that affect the accuracy of these instructions, please let me know in the comments so I can update them accordingly.
Task 1: Create an Elastic Account
To get started, you must create a free account and set up a cloud-based Elastic instance to run the SIEM. Follow these steps:
Sign up for a free trial of Elastic Cloud at https://cloud.elastic.co/registration
After creating your account, log in to the Elastic Cloud console at https://cloud.elastic.co
Click “Start your free trial.”
Select “Create Deployment” and choose “Elasticsearch” as the deployment type.
Pick a region and deployment size that suits your needs, then click “Create Deployment.”
Wait for the setup process to finish.
Once the deployment is ready, click “Continue.”
Task 2: Setting up an AWS EC2 Ubuntu Instance
Next, we’ll set up a Linux server using an AWS EC2 instance with Ubuntu. Follow these steps:
Sign in to your AWS account or create one at https://aws.amazon.com
In the AWS Management Console, navigate to the EC2 Dashboard.
Click “Launch Instance” and choose “Ubuntu” as the operating system from the list of available AMIs (Amazon Machine Images).
Select an instance type that fits your needs (e.g., t2.micro for the free tier) and click “Next.”
Configure the instance details, such as the number of instances and network settings, then click “Next: Add Storage.”
Adjust storage settings if necessary, then click “Next: Add Tags.”
Add tags to help manage your instance, then click “Next: Configure Security Group.”
Set up a security group to allow SSH access (port 22), and any other necessary ports, then click “Review and Launch.”
Review your settings and click “Launch.” Make sure to create or choose an existing key pair to securely access your instance.
Once the instance is running, connect to it using SSH and the key pair you specified.
Note: If you encounter any difficulties, you can find tutorials on YouTube like “How to launch an Ubuntu EC2 instance on AWS.”
Task 3: Setting up the Agent to Collect Logs
An agent is a software program installed on a server or endpoint that collects and sends data to a centralized system for analysis and monitoring. In this case, the agent will collect and forward security-related events from your AWS EC2 Ubuntu instance to your Elastic SIEM.
To configure the agent to collect logs from your Ubuntu instance and send them to Elastic SIEM, follow these steps:
Log in to your Elastic Cloud instance.
Navigate to the Integrations page by clicking on the Kibana main menu (top-left corner) and selecting “Integrations” at the bottom.
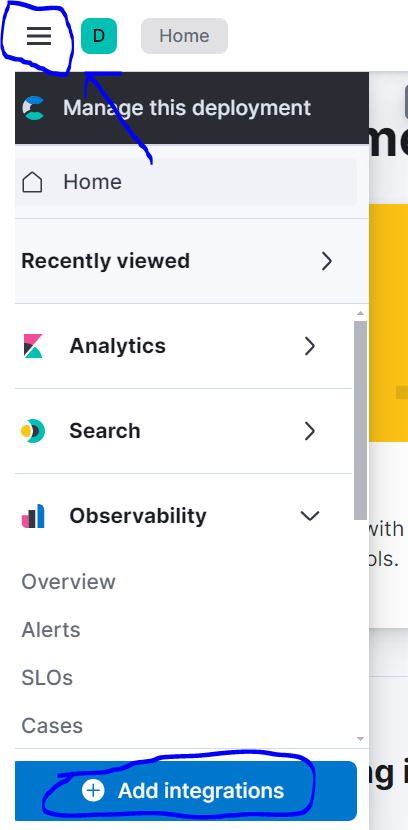
2. Type “Elastic Defend” in the search bar and select it to open the integration page.

3. Click on “Install Elastic Defend” and follow the instructions on the integration page to set up the agent on your AWS EC2 Ubuntu instance. On the right side of the page, enter a name for the integration (you can choose any name you prefer), scroll down, and then click “Save and Continue.” To add the Elastic Agent to your host, go to “Add Agent” on the right, ensure “Linux” is selected, and then copy the command to your clipboard.
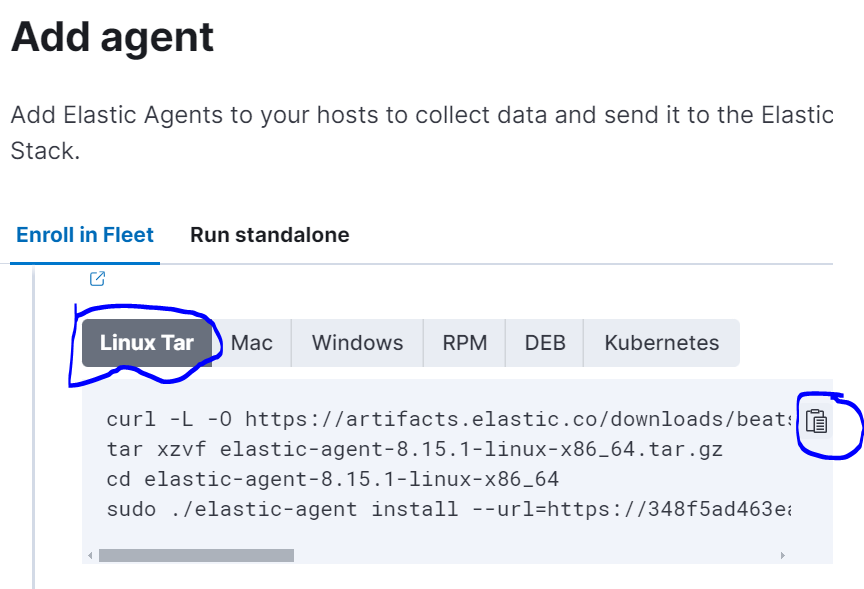
4. Paste the command into the terminal on your AWS EC2 Ubuntu instance. Once the agent is installed, which may take a few minutes, you’ll receive a message confirming that “Elastic Agent has been successfully installed.” The agent will automatically begin collecting and forwarding logs to your Elastic SIEM instance, though it may take some time for the logs to appear in the SIEM.
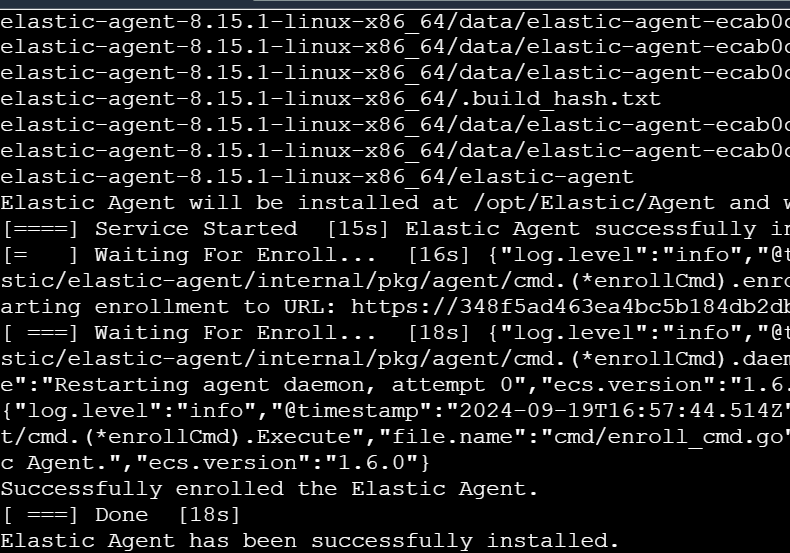
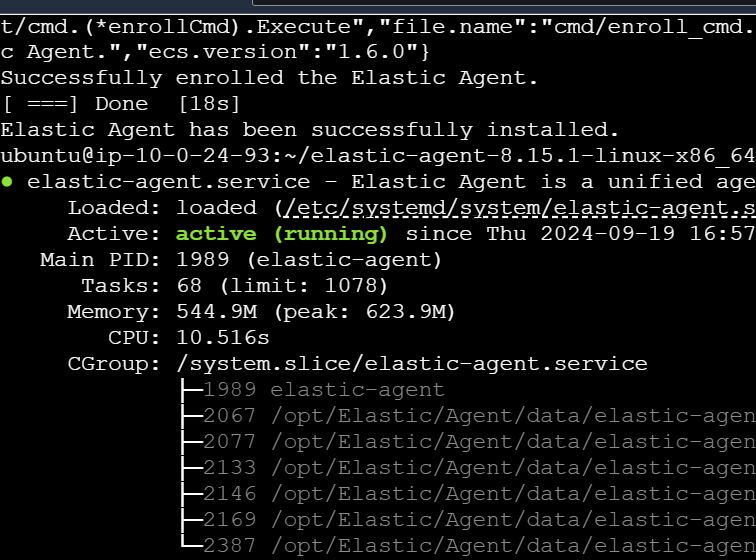
You can verify that the agent has been installed correctly by running the command sudo systemctl status elastic-agent.service.
If you encounter an error while installing the agent, ensure that your AWS EC2 Ubuntu instance is connected to the internet by running the command ping google.com before proceeding.
Task 4: Generating Security Events on the AWS EC2 Ubuntu Instance
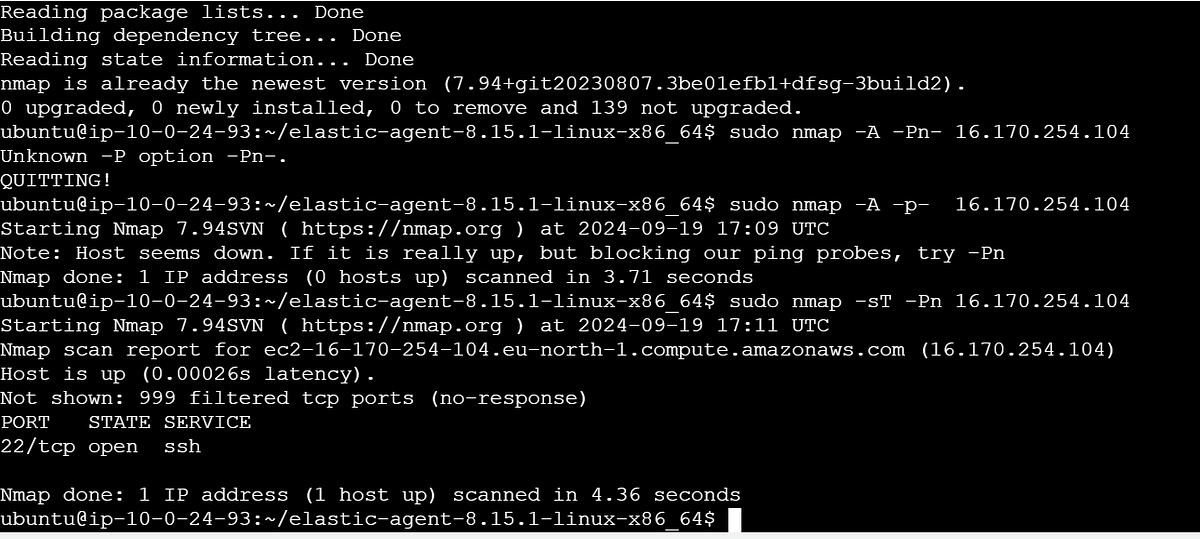
To verify that the agent is functioning correctly, you can generate security-related events on your AWS EC2 Ubuntu instance using Nmap. Nmap (Network Mapper) is a free and open-source utility for network exploration, management, and security auditing. It helps discover hosts and services on a network, creating a “map” of the environment. Nmap can scan for open ports, identify the operating system and software running on a target system, and gather additional information about the network.
To perform an Nmap scan, follow these steps:
- Update your package list and install Nmap by running the following commands in the terminal:
sudo apt update
sudo apt install nmap
2. Once installed, you can run various scans. For a detailed scan of a specific IP address, use:
sudo nmap -A -Pn <ip-address>
This command enables OS detection, version detection, script scanning, and traceroute.
3. For a simple TCP connect scan, run:
sudo nmap -sT -Pn <ip-address>
You can also scan your host machine if your Ubuntu instance is set to a “bridged” network configuration.
Task 5: Querying for Security Events in the Elastic SIEM
Now that you’ve forwarded data from your AWS EC2 Ubuntu instance to Elastic SIEM, you can begin querying and analyzing the logs.
To do this, follow these steps:
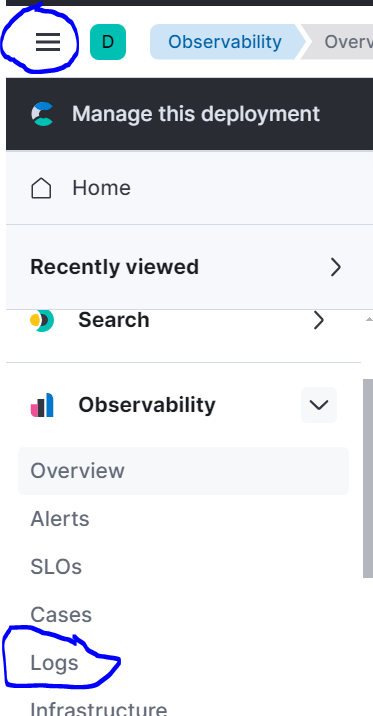
Inside your Elastic Deployment, click the menu icon at the top-left corner (represented by three horizontal lines).
Select the “Logs” tab under the “Observability” section to view the logs from your AWS EC2 Ubuntu instance.
2. In the search bar, enter a query to filter the logs. For example, to find all logs related to Nmap scans, use the following query: event.action: "nmap_scan" or process.args: "sudo".
3. Click the “Search” button to execute your query. Keep in mind that it may take some time for events to populate in the SIEM, so this query might not yield immediate results.
4. The search results will be displayed in the table below. You can click the three dots next to each event to view more details.
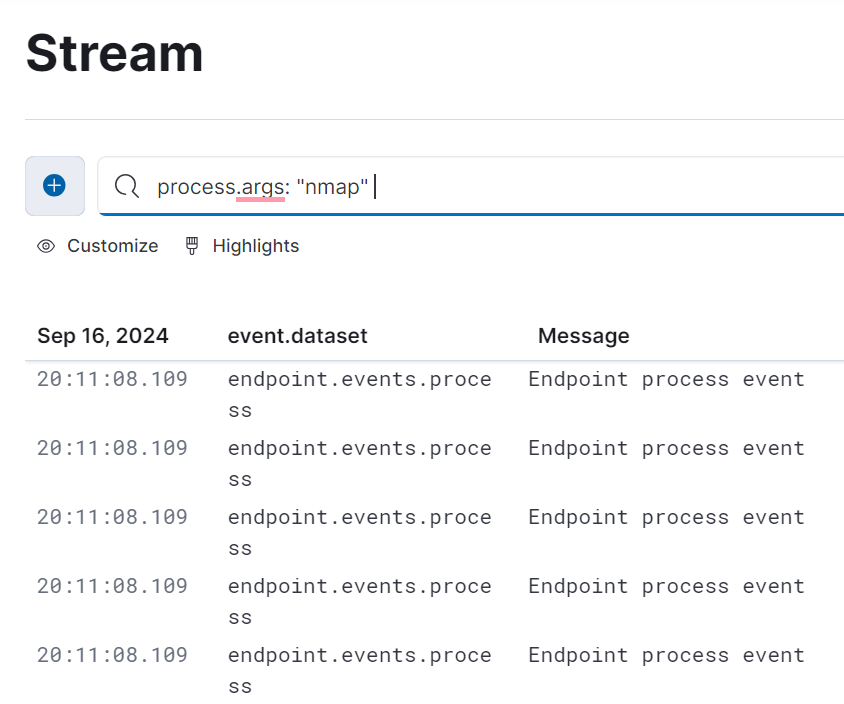
By generating and analyzing various types of security events in Elastic SIEM, such as the Nmap scan example on your AWS EC2 Ubuntu instance, or by creating authentication failures (e.g., entering the wrong password for a user or attempting SSH logins with an incorrect password), you can gain a clearer understanding of how security incidents are detected, investigated, and responded to in real-world scenarios. This practice will enhance your insight into the mechanisms of incident detection and response.
Task 6: Create a Dashboard to Visualize the Events
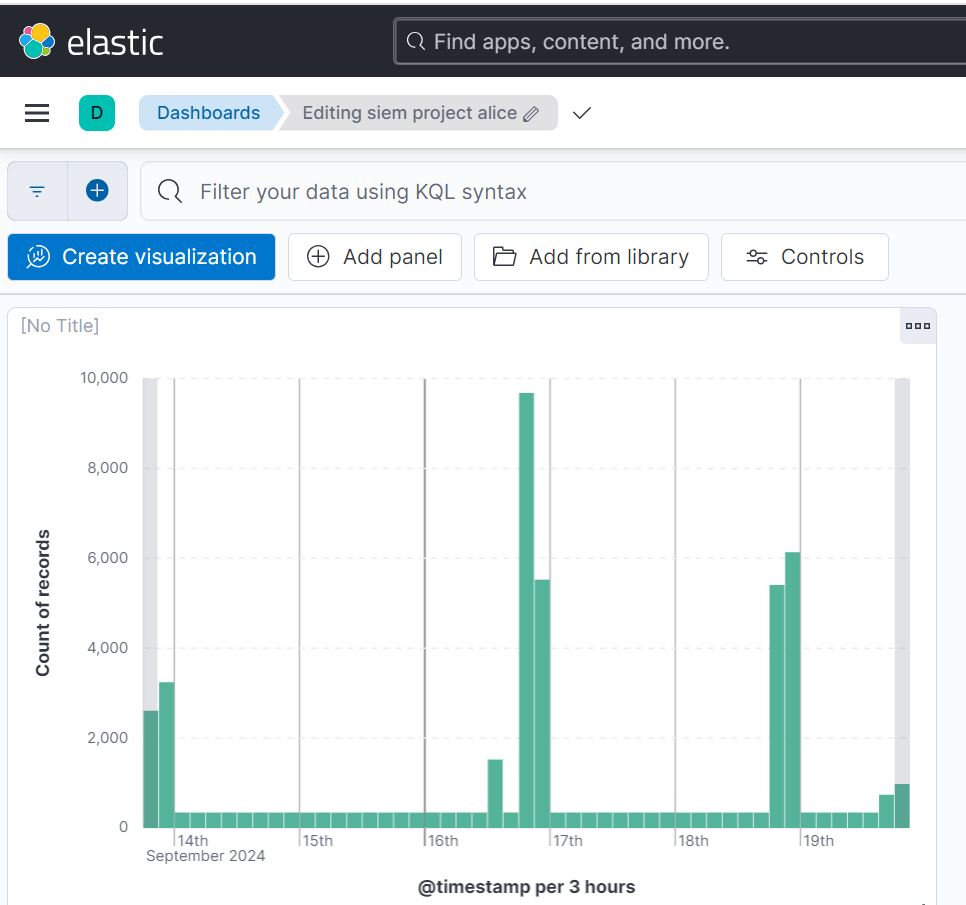
You can utilize the visualizations and dashboards in the SIEM app to analyze logs and identify patterns or anomalies in the data. For example, you can create a simple dashboard that displays a count of security events over time.
To create a dashboard, follow these steps:
Navigate to the Elastic web portal at https://cloud.elastic.co/
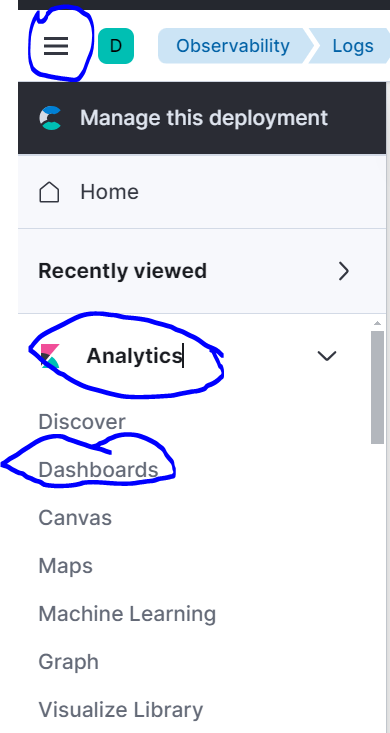
Click on the menu icon in the top-left corner, then select “Dashboards” under the “Analytics” section.
3. Click on the “Create dashboard” button in the top-right corner to start a new dashboard.
4. Click on the “Create Visualization” button to add a new visualization to the dashboard.
5. Choose either “Area” or “Line” as the visualization type, based on your preference. This will create a chart that displays the count of events over time.
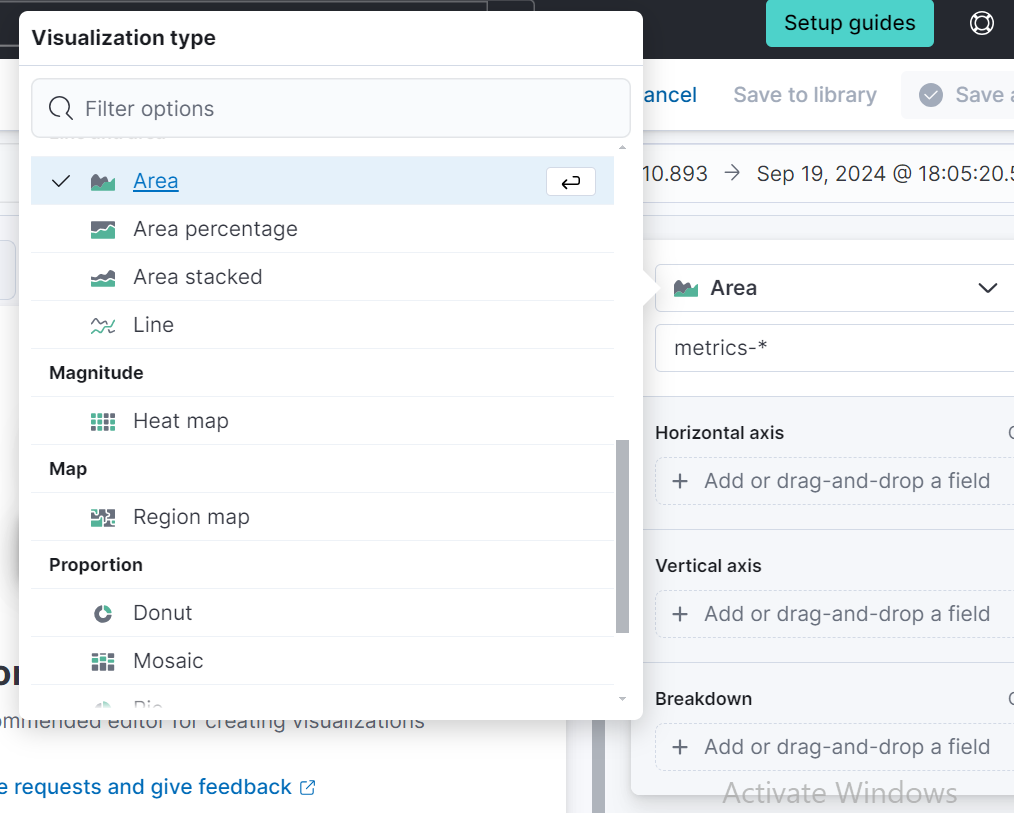
6. In the “Metrics” section of the visualization editor on the right, select “Count” as the vertical field type and “Timestamp” as the horizontal field. This will display the count of events over time.
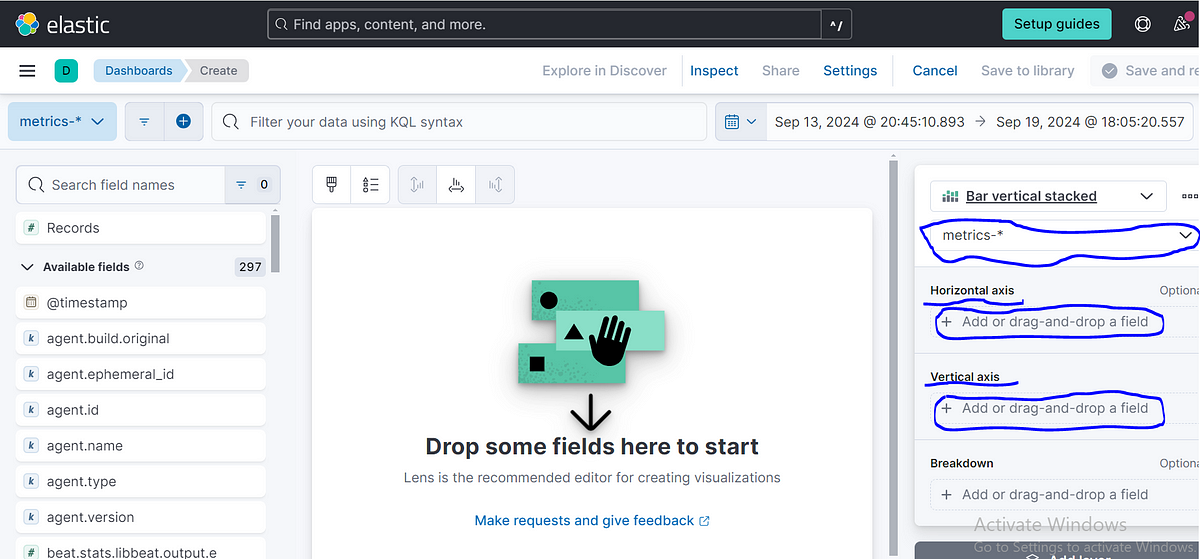
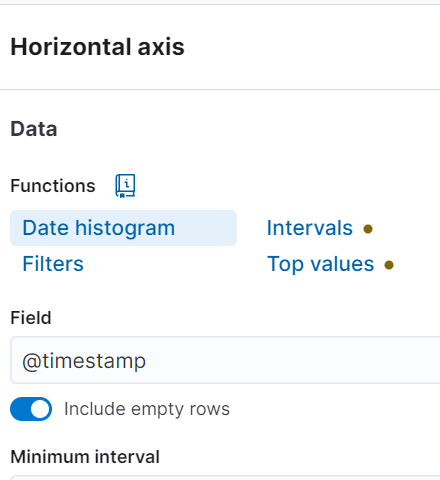
click “close” once you’re done.
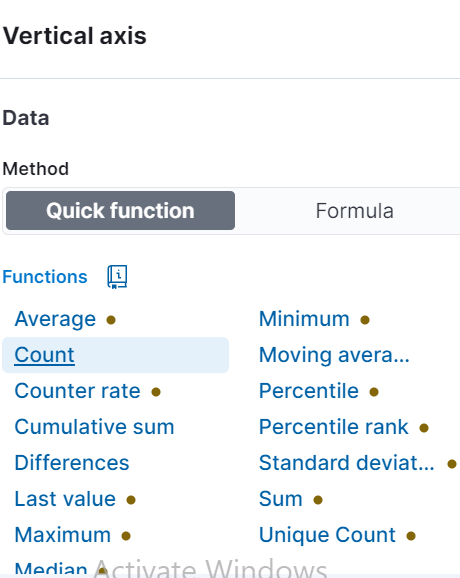
click “close” once you’re done.
7. Click on the “Save” button to save the visualization, and then complete the rest of the settings as needed.
Task 7: Create an Alert
Alerts play a vital role in a SIEM by helping detect security incidents and enabling timely responses. These alerts are generated based on predefined rules or custom queries and can be configured to trigger specific actions when certain criteria are met. In this task, we will guide you through the process of creating an alert in your Elastic SIEM instance to detect Nmap scans. By following these steps, you’ll set up an alert to monitor your logs for Nmap scan events and receive notifications when they occur.
Here are the steps:
Click on the menu icon in the top-left corner, then navigate to “Security” and select “Alerts.”
Click on “Manage rules” in the top-right corner.

3. Click on the “Create new rule” button in the top-right corner.
4. Under the “Define rule” section, select the “Custom query” option from the dropdown menu.
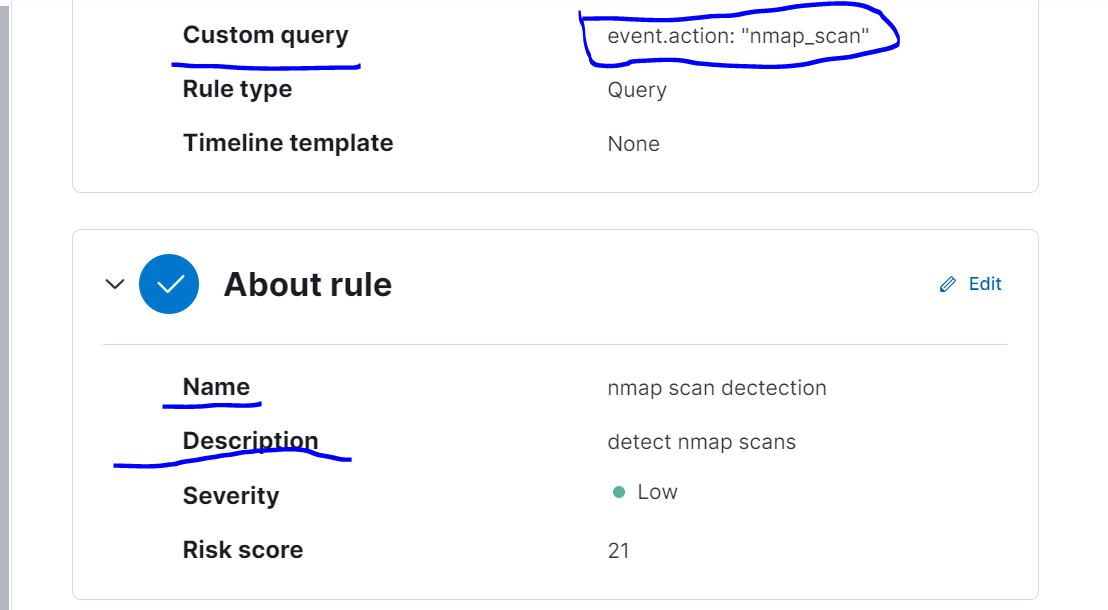
5. In the “Custom query” section, specify the conditions for the rule. You can use the following query to detect Nmap scan events.

This query will identify all events associated with the action “nmap_scan.” Once done, click “Continue.”
6. In the “About rule” section, provide a name for your rule along with a description (e.g., “Nmap Scan Detection”).
7. Assign a severity level to the alert to assist in prioritizing alerts based on their significance. Leave the remaining default settings under “Schedule rule” and click “Continue.”
8. In the “Actions” section, choose the action you wish to execute when the rule is triggered. You can opt to send an email notification, create a Slack message, or trigger a custom webhook.
9. Finally, click the “Create and enable rule” button to finalize the alert setup.
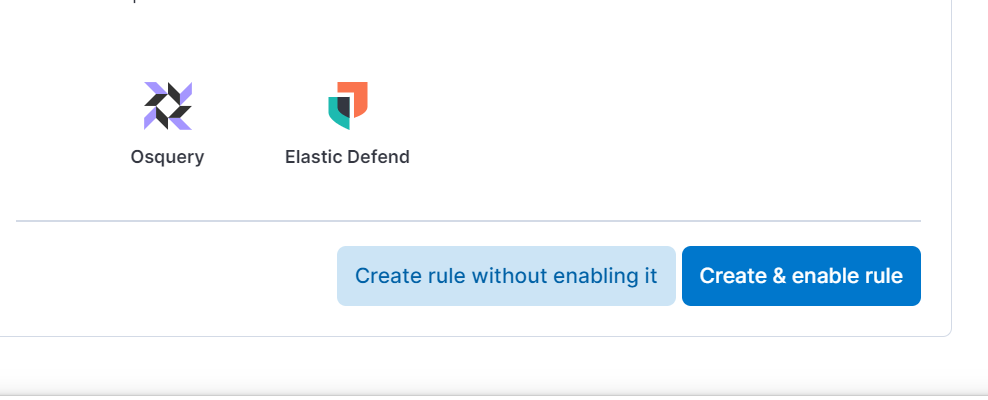
Once the alert is created, it will monitor logs for Nmap scan events, triggering the selected action upon detection. You can manage your alerts in the “Alerts” section under “Security.”
Conclusion
In this guide, we set up a home lab using Elastic SIEM and an AWS EC2 Ubuntu instance. We forwarded data from the Ubuntu VM to the SIEM via the Elastic Beats agent, generated security events with Nmap, and analyzed the logs through the Elastic web interface. We also created a dashboard for visualizing security events and established an alert for detection.
This home lab offers a valuable environment for learning essential skills in security monitoring and incident response with Elastic SIEM. By following these steps, you’ll gain hands-on experience that can enhance your capabilities as a security analyst or engineer.
Next Steps
Generate various security events on your Ubuntu VM and query them in Elastic SIEM.
Test your alert by conducting Nmap scans on the Ubuntu instance.
Familiarize yourself with Elastic SIEM’s analysis and visualization tools to improve your log analysis skills.
Explore integrations with cloud providers like AWS or Azure, and collect data from sources like Windows event logs or syslog to broaden your Elastic SIEM expertise.
Thank you for reading! I hope you found this guide helpful. For more insights, check out Elastic’s YouTube channel for tutorials on using their SIEM. Until next time, take care!
Subscribe to my newsletter
Read articles from alice eneyo directly inside your inbox. Subscribe to the newsletter, and don't miss out.
Written by

alice eneyo
alice eneyo
Compliance Analyst with 2+ years of hands-on experience driving risk assessments, regulatory compliance, and governance initiatives across GRC frameworks including ISO 27001, NIST SP 800-53, SOC 2, and GDPR. Adept at developing and enforcing security policies, conducting internal audits, maintaining risk registers, managing third-party compliance, and supporting ISO 27001 certification readiness. Strong understanding of cybersecurity best practices and risk mitigation strategies. Known for strengthening operational resilience through proactive governance and cross-functional collaboration. Actively seeking opportunities in Compliance, GRC (Governance, Risk & Compliance), or Cybersecurity Analyst roles.