Evaluating Classification Models: A Comprehensive Guide to Key Metrics
 Muhammad Fahad Bashir
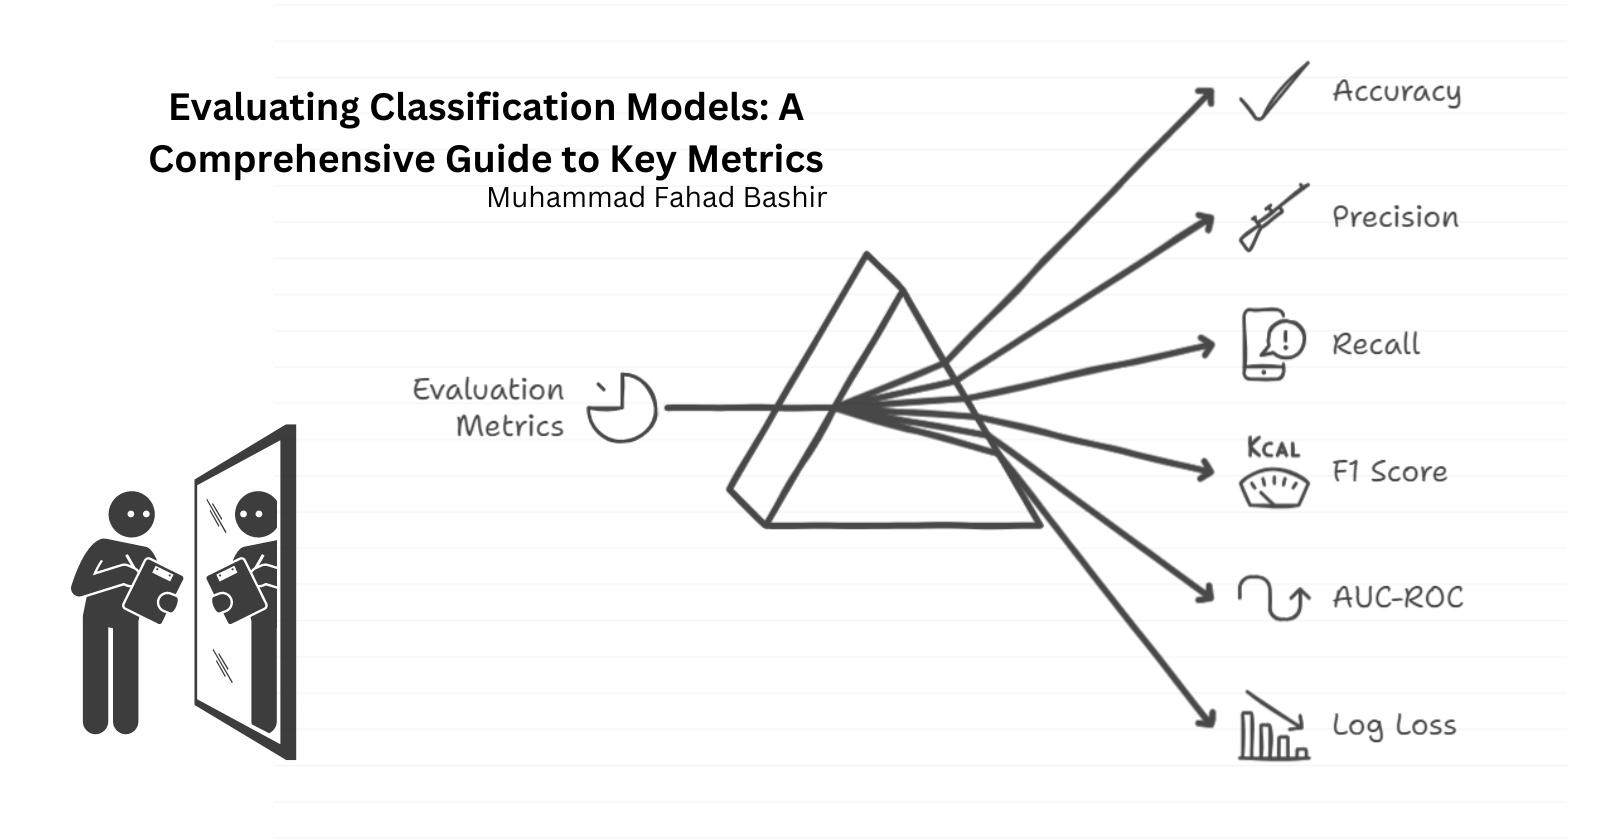
Evaluating the performance of a model is a crucial step in any machine-learning project. Evaluation metrics help us assess how well our model performs, whether we can rely on its predictions, and how it will behave with new, unseen data. Without proper evaluation, we may face issues like overfitting or underfitting.
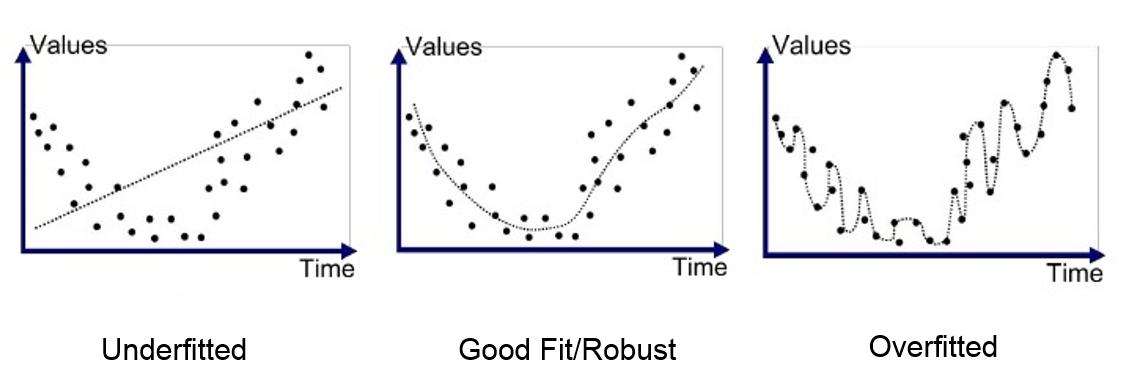
Overfitting
Overfitting occurs when the model learns too much from the training data, leading to poor generalization on unseen data. This results in high variance, meaning the model’s performance is specific to the training data and fails on new inputs.
Underfitting
Underfitting happens when the model is too simple or has insufficient data, making it unable to learn and recognize patterns. This leads to high bias, where the model fails to capture the underlying trends in the data.
An ideal model strikes a balance between underfitting and overfitting.
Evaluation Metrics for Classification
For classification problems (binary or multi-class), we often use several metrics to evaluate the model’s performance. A classification problem involves predicting the class or category a given instance belongs to, such as determining whether a person is a smoker or non-smoker.
Accuracy
Accuracy is the most common evaluation metric, but it's not always the best measure—especially when dealing with imbalanced data (e.g., 90:10 or 80:20 class distribution). Accuracy works well for balanced data, but in cases of imbalance, it can give misleading results, as the model may simply predict the majority class.

Confusion Matrix
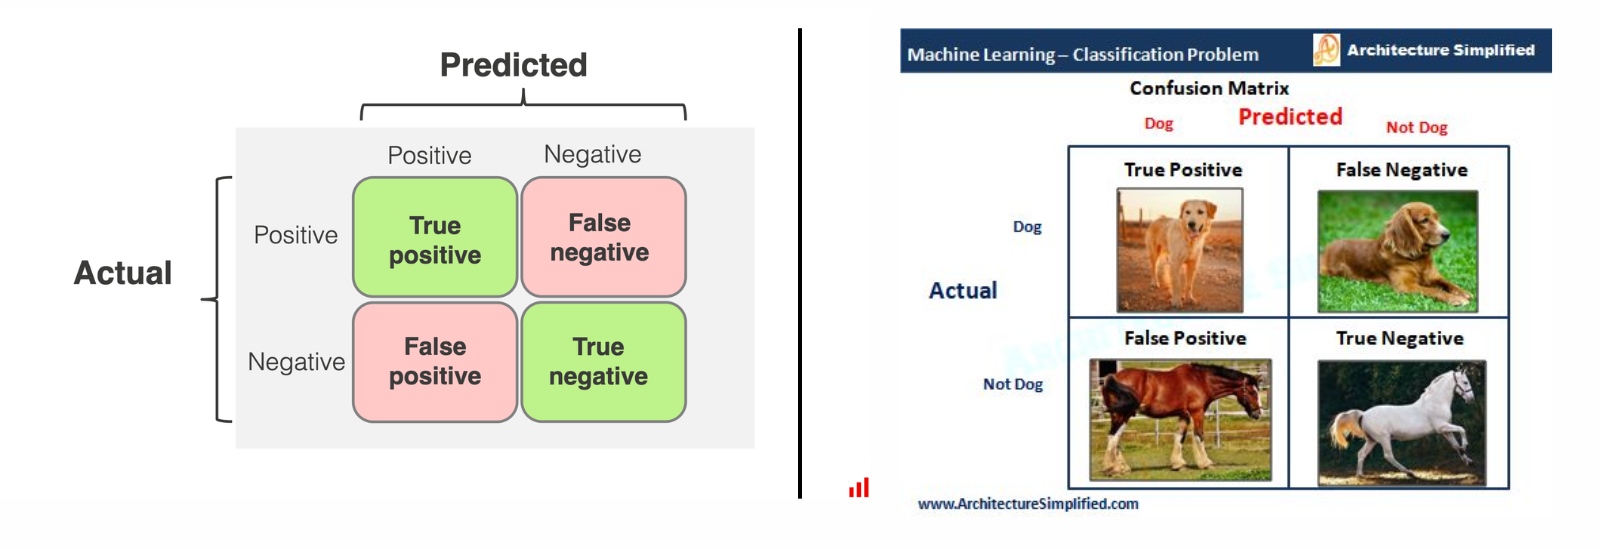
A confusion matrix provides a detailed breakdown of a model’s predictions and is a foundation for several other evaluation metrics. It consists of four key components in the case of binary classification.The confusion matrix helps evaluate the performance of a model by categorizing its predictions.
For example, imagine a model designed to predict whether an image contains a dog or not a dog. If the model correctly identifies a dog in the image, it’s a True Positive (TP), while if it incorrectly identifies a non-dog (like a horse) as a dog, it’s a False Positive (FP).
On the other hand, if the model fails to identify a dog and predicts it as not a dog, it’s a False Negative (FN). Lastly, when the model correctly predicts that an image does not contain a dog (e.g., identifying a horse as not a dog), it’s a True Negative (TN). These categories help calculate performance metrics like accuracy, precision, and recall.
True Positive (TP): The model correctly predicts the positive class.
False Positive (FP): The model predicts the positive class, but the actual class is negative.
False Negative (FN): The model predicts the negative class, but the actual class is positive.
True Negative (TN): The model correctly predicts the negative class.
From the confusion matrix, we can derive other useful metrics:
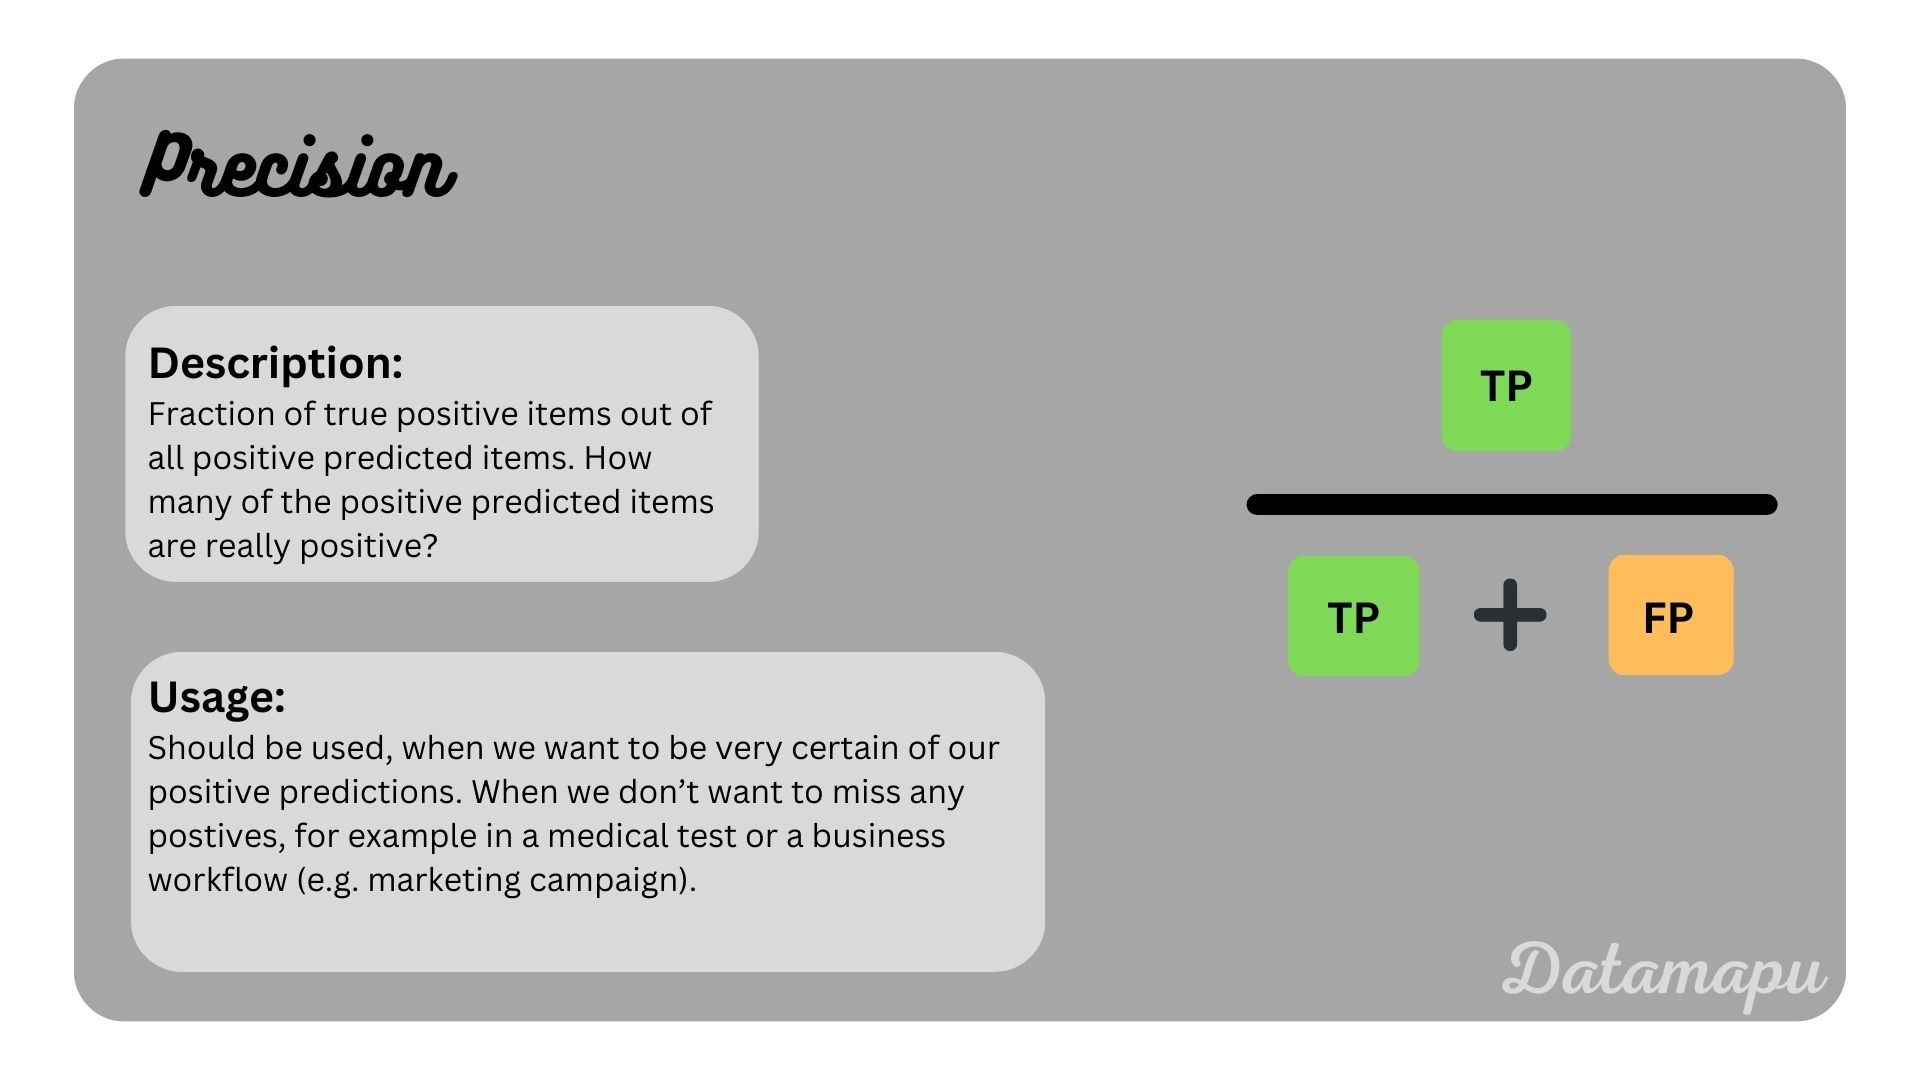
Precision
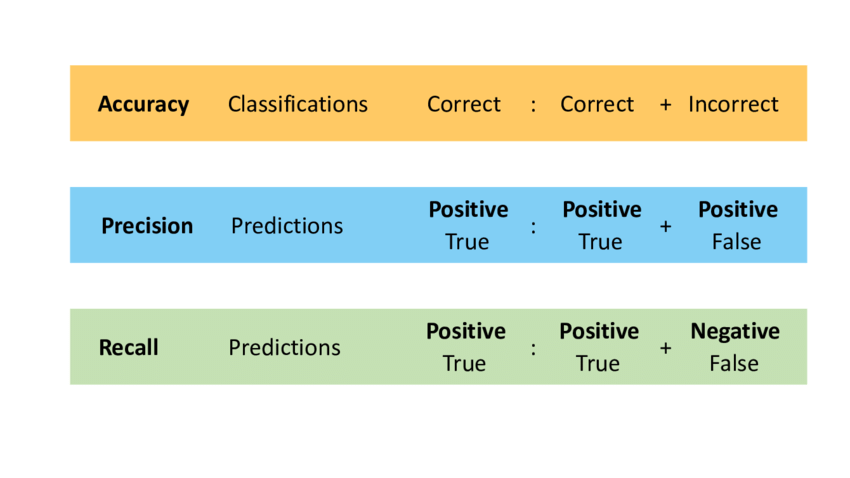
Precision measures the proportion of true positives out of all predicted positives. It aims to minimize false positives.
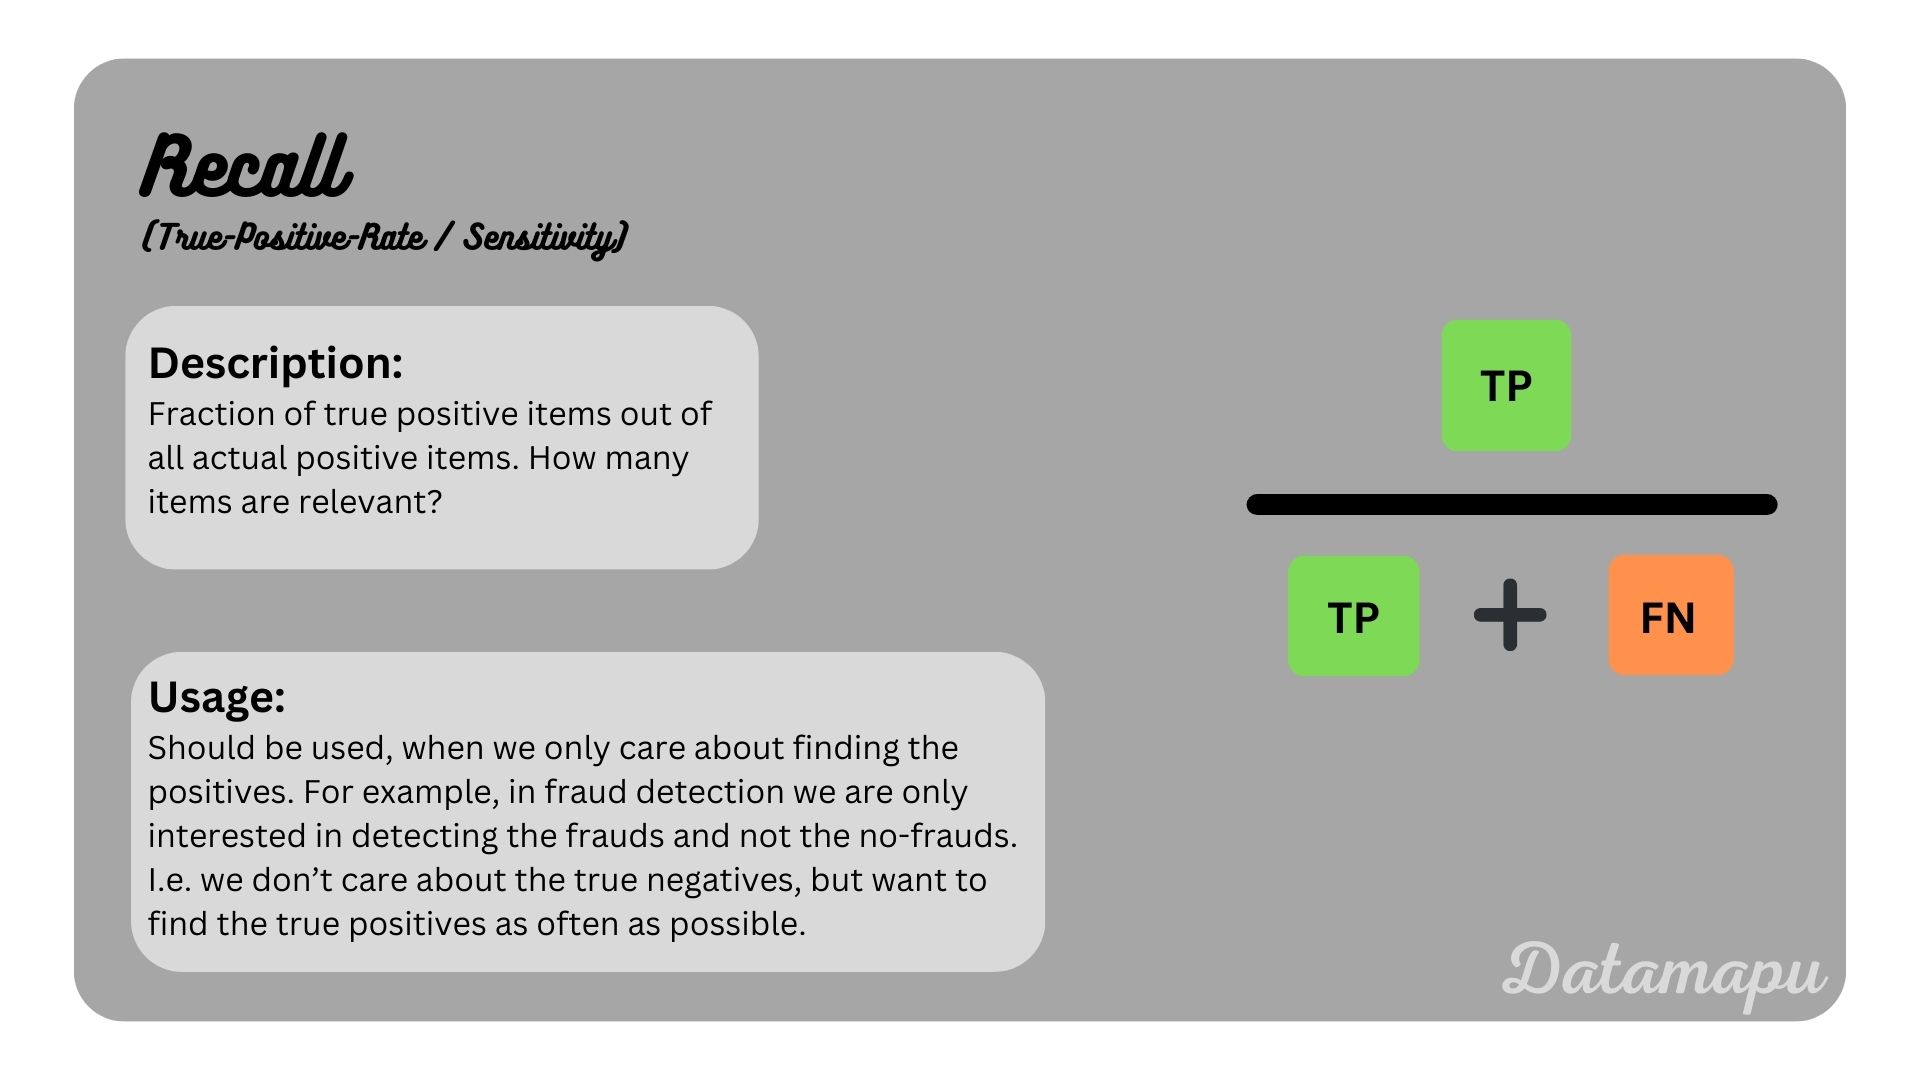
Recall (Sensitivity/True Positive Rate)
Recall measures the proportion of actual positives that were correctly predicted. It aims to minimize false negatives.
A comparison between accuracy, Precision & Recall
Precision-Recall Curve
The Precision-Recall curve plots precision against recall, helping visualize the trade-off between them. This is particularly useful for imbalanced datasets.
AUC-ROC Curve
The AUC-ROC (Area Under the Curve - Receiver Operating Characteristic) curve plots the true positive rate against the false positive rate. A higher AUC value indicates a better-performing model.Image reference

F 1-Score
The F1-Score is the harmonic mean of precision and recall, providing a balanced metric that considers both false positives and false negatives. A higher F1-score indicates better model performance.

Logarithmic Loss (Log Loss)
Logarithmic Loss, or Log Loss, is used to measure the performance of a classification model where the output is a probability value between 0 and 1. It penalizes the false classifications based on the confidence of the prediction, meaning the model is punished more for being confidently wrong.
It helps when your model gives probabilities rather than a hard classification (dog or not a dog). It evaluates how much the predictions deviate from the actual labels. The closer the prediction is to the actual class, the lower the log loss.
Example: If your model predicts a dog with a 0.8 probability, and it's correct, the log loss will be lower. However, if it predicts a dog with 0.8 probability but the actual label is not a dog, the log loss will be higher, penalizing the incorrect confident prediction.

Conclusion
Choosing the right evaluation metric is crucial for building reliable machine learning models, especially for classification problems. While accuracy is a commonly used metric, it's important to consider other metrics like precision, recall, F1-score, and AUC-ROC to get a more complete understanding of model performance—especially in cases of imbalanced data. Each metric gives a different insight into how well the model is performing, making it essential to evaluate based on the specific needs of your project.
Subscribe to my newsletter
Read articles from Muhammad Fahad Bashir directly inside your inbox. Subscribe to the newsletter, and don't miss out.
Written by
