Comprehensive DevOps Monitoring: Prometheus, Node Exporter, Blackbox & Alert manager with Email Notifications
 Shubham Taware
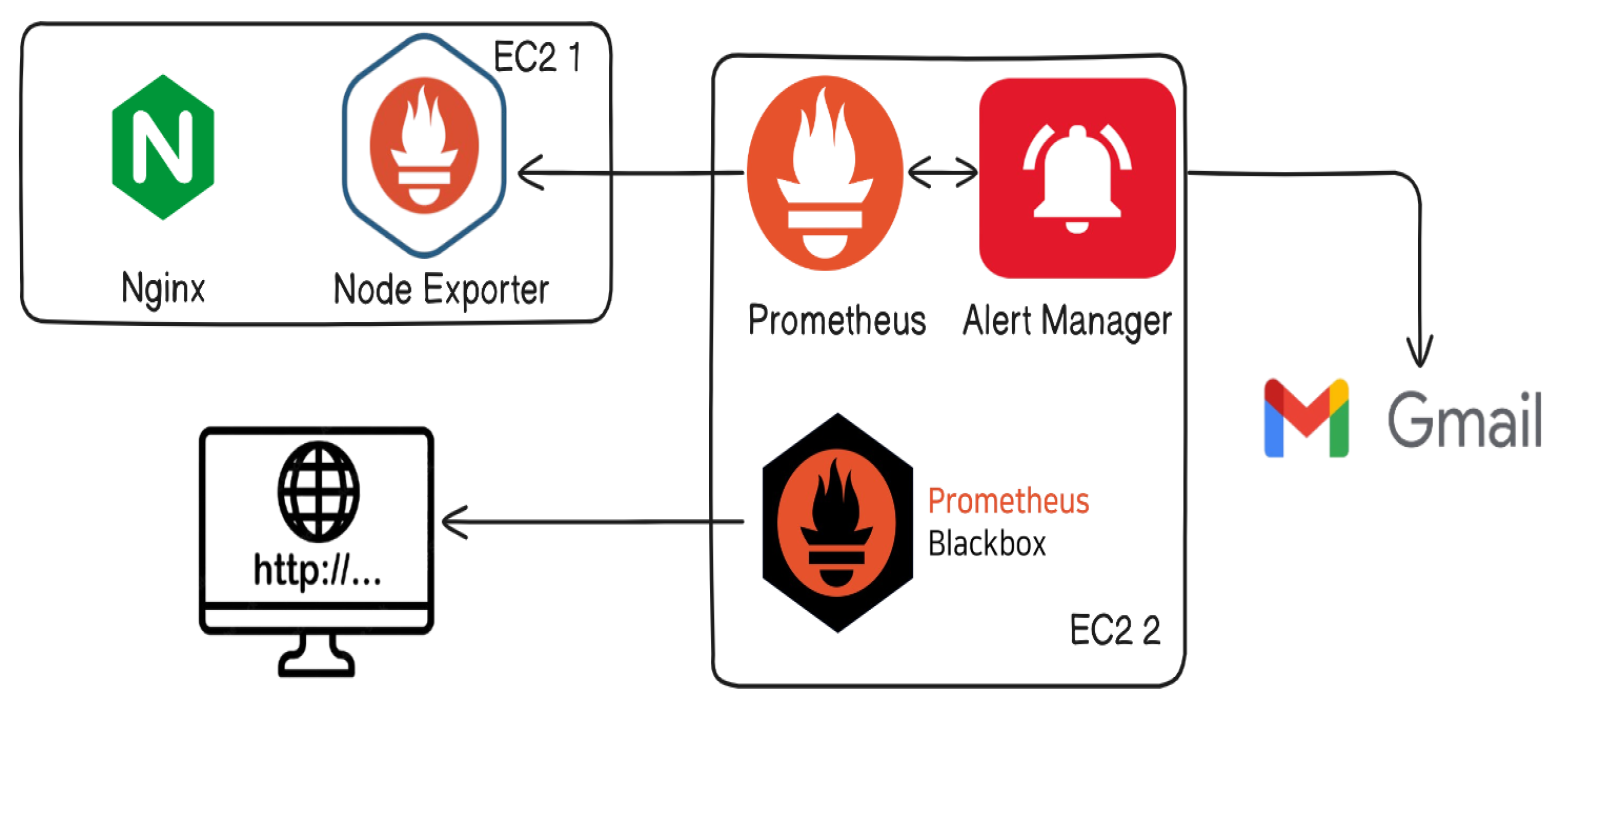
In this project, we will build a comprehensive DevOps monitoring solution using Blackbox Exporter, Node Exporter, Alert manager, and Prometheus. The goal is to set up a robust monitoring system that ensures high availability and performance for applications by continuously tracking system metrics and availability.
We will configure the Blackbox Exporter to monitor endpoints and ensure service uptime, while the Node Exporter will be used to collect key metrics from system hardware. Prometheus will act as the core monitoring and alerting tool, scraping the metrics and storing them efficiently. Additionally, we will configure Alert manager to handle alerts based on predefined conditions, including setting up email notifications for prompt issue resolution.
This project demonstrates the full monitoring lifecycle for a system, making it an essential part of any DevOps workflow, ensuring stability, performance, and rapid response to system failures.
Prerequisites:
2 - t2.medium ec2 with 20 GB each. (say instance 1 as monitoring and 2 as app vm)
Deploy one web page using apache or nginx on one instance.
Information:
Prometheus port: 9090
BlackBox Exporter port: 9115
Node Exporter port: 9100
Alert Manager port: 9093
1. Installing and Setup Monitoring tools:
SSH into the monitoring ec2 instance and update the packages using:
sudo apt updateDownload prometheus:
Go to prometheus.io
Copy prometheus download link and download using:
 #Download the prometheus
 wget https://github.com/prometheus/prometheus/releases/download/v2.54.1/prometheus-2.54.1.linux-amd64.tar.gz

 #Untar the prometheus downloaded package
 tar -xvf prometheus.xyz.tar.gz

 #Rename unzip file to prometheus
 mv prometheus.xyz.tar.gz/ prometheus
Download BlackBox Exporter:
Go to prometheus.io.
Copy BlackBox exporter download link and download using:
 #Download blackbox exporter using the link
 wget https://github.com/prometheus/blackbox_exporter/releases/download/v0.25.0/blackbox_exporter-0.25.0.linux-amd64.tar.gz

 #Untar the tar file
 tar -xvf blackbox_exporter-0.25.0.linux-amd64.tar.gz

 #Rename unzip file to blackbox for ease
 mv blackbox_exporter-0.25.0.linux-amd64.tar.gz blackbox
Download Alert Manager:
Go to prometheus.io.
Copy Alert exporter download link and download using:
 #Download Alert Manager using the link
 wget https://github.com/prometheus/alertmanager/releases/download/v0.27.0/alertmanager-0.27.0.linux-amd64.tar.gz

 #Untar the tar file
 tar -xvf alertmanager-0.27.0.linux-amd64.tar.gz

 #Rename unzip file to blackbox for ease
 mv alertmanager-0.27.0.linux-amd64.tar.gz alertmanager
Setup Alert rules in Prometheus:
Go into the prometheus folder:
cd prometheusCreate file
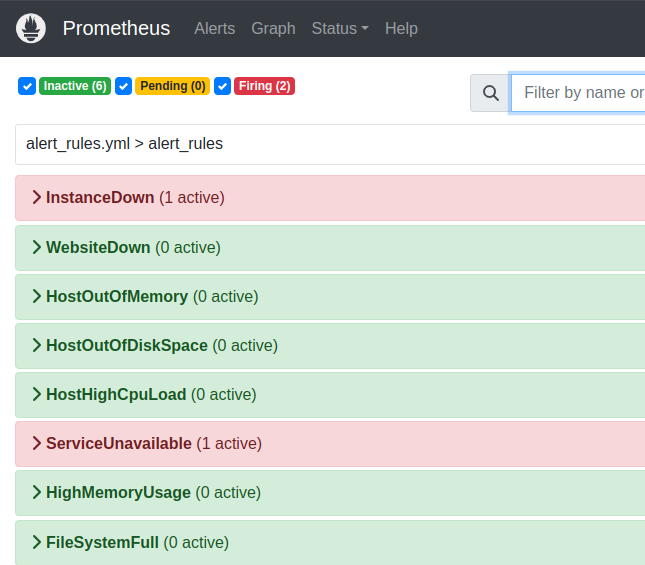
alert_rules.ymland put the below content in it.--- groups: - name: alert_rules rules: - alert: InstanceDown expr: up == 0 for: 1m labels: severity: critical annotations: summary: 'Endpoint {{ $labels.instance }} down' description: >- {{ $labels.instance }} of job {{ $labels.job }} has been down for more than 1 minute. - alert: WebsiteDown expr: probe_success == 0 for: 1m labels: severity: critical annotations: description: 'The website at {{ $labels.instance }} is down.' summary: Website down - alert: HostOutOfMemory expr: node_memory_MemAvailable / node_memory_MemTotal * 100 < 25 for: 5m labels: severity: warning annotations: summary: 'Host out of memory (instance {{ $labels.instance }})' description: |- Node memory is filling up (< 25% left) VALUE = {{ $value }} LABELS: {{ $labels }} - alert: HostOutOfDiskSpace expr: >- (node_filesystem_avail{mountpoint="/"} * 100) / node_filesystem_size{mountpoint="/"} < 50 for: 1s labels: severity: warning annotations: summary: 'Host out of disk space (instance {{ $labels.instance }})' description: |- Disk is almost full (< 50% left) VALUE = {{ $value }} LABELS: {{ $labels }} - alert: HostHighCpuLoad expr: >- (sum by (instance)(irate(node_cpu{job="node_exporter_metrics",mode="idle"}[5m]))) > 80 for: 5m labels: severity: warning annotations: summary: 'Host high CPU load (instance {{ $labels.instance }})' description: |- CPU load is > 80% VALUE = {{ $value }} LABELS:{{ $labels }} - alert: ServiceUnavailable expr: 'up{job="node_exporter"} == 0' for: 2m labels: severity: critical annotations: summary: 'Service Unavailable (instance {{ $labels.instance }})' description: |- The service {{ $labels.job }} is not available VALUE = {{ $value }} LABELS: {{ $labels }} - alert: HighMemoryUsage expr: (node_memory_Active / node_memory_MemTotal) * 100 > 90 for: 10m labels: severity: critical annotations: summary: 'High Memory Usage (instance {{ $labels.instance }})' description: |- Memory usage is > 90% VALUE = {{ $value }} LABELS: {{ $labels }} - alert: FileSystemFull expr: (node_filesystem_avail / node_filesystem_size) * 100 < 10 for: 5m labels: severity: critical annotations: summary: 'File System Almost Full (instance {{ $labels.instance}})' description: |- File system has < 10% free space VALUE = {{ $value }} LABELS: {{ $labels }}Now we will edit the
prometheus.yml.vi prometheus.ymlGive our rule file name under the rule_files section as alert_rules.yml

Start/Restart Prometheus so that alert rules will reflect. It will run on port <ec2-publicip-prometheus>:9090.
 #To stop previously running prometheus service
 prgrep prometheus

 #Use the above command output as id
 kill id

 #Start the prometheus
 ./prometheus &
2. Install Node Exporter on App VM:
You need to install the node exporter to capture and send the metrics of the running web application to prometheus, for that node exporter should be installed on app vm where your web application is running.
Download Node Exporter:
Go to prometheus.io.
Copy Node Exporter download link and download using:
 #Download Alert Manager using the link
 wget https://github.com/prometheus/node_exporter/releases/download/v1.8.2/node_exporter-1.8.2.linux-amd64.tar.gz

 #Untar the tar file
 tar -xvf node_exporter-1.8.2.linux-amd64.tar.gz

 #Rename unzip file to blackbox for ease
 mv node_exporter-1.8.2.linux-amd64.tar.gz node_exporter

 #Change directory to prometheus
 cd node_exporter

 #Run prometheus in background
 ./node_exporter &
3. Configure Alert Manager Node and Blackbox Exporter in Prometheus:
Go into the prometheus folder and open prometheus.yml:
  cd prometheus

  #Open prometheus.yml
  vi prometheus.yml
Configure Alert Manager:
Under alert manager configuration in target section provide <public-ip-alert-manager>:9093 where alert manager is running.

Configure Node Exporter:
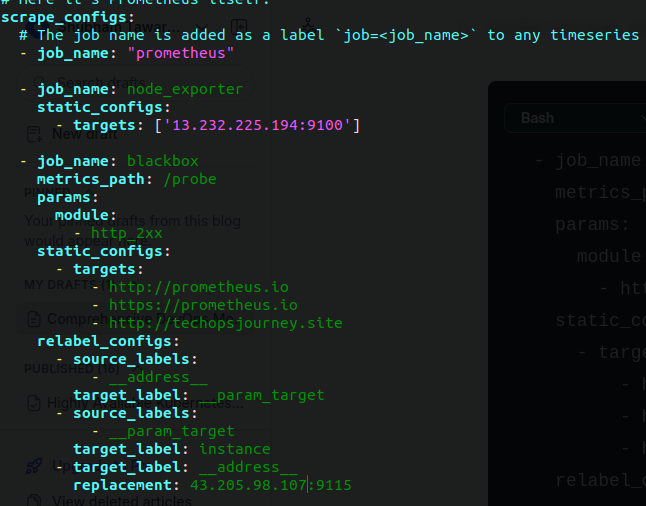
Under scrape _configs section we need to add the job for Node exporter.
 - job_name: node_exporter
   static_configs:
       - targets: ['<public-ip-nodeexporter>:9100']
Restart the prometheus if already started and you will see that the node exporter is added to prometheus targets section.
Configure BlackBox exporter:
Under scrape _configs section we need to add the job for BlackBox exporter.
   - job_name: blackbox
     metrics_path: /probe
     params:
       module:
         - http_2xx
     static_configs:
       - targets:
           - http://prometheus.io
           - https://prometheus.io
           - http://your-website-ip:8080
     relabel_configs:
       - source_labels:
           - __address__
         target_label: __param_target
       - source_labels:
           - __param_target
         target_label: instance
       - target_label: __address__
         replacement: <public-ip-blackbox>:9115
Restart/Start the prometheus and blackbox exporter, you will see that the blackbox exporter is added to prometheus targets section.
4. Configure alerts using Alert Manager:
Go inside folder alert manager:
  cd alert_manager

  #Remove the previous alertmanager.yml
  rm alertmanager.yml

  #Create new alertmanager.yml
  vi alertmanager.yml
Paste the below content in
alertmanager.yml--- route: group_by: [ 'alertname' ] group_wait: 30s group_interval: 5m repeat_interval: 1h receiver: 'email-notifications' receivers: - name: 'email-notifications' email_configs: - to: shubhamtaware2001@gmail.com from: monitoring@gmail.com smarthost: 'smtp.gmail.com:587' auth_username: shubham.ajspire@gmail.com auth_identity: shubham.ajspire@gmail.com auth_password: "wsdl imvc auzb kihw" send_resolved: true inhibit_rules: - source_match: severity: 'critical' target_match: severity: 'warning' equal: ['alertname', 'dev', 'instance']Start the alert manager using:
  cd alertmanager

  #Starting the alert manager in background
  ./alertmanager &
Here we are done with the configuration part now we will test, weather the tools configured are working.
5. Testing the Alert Manager:
By stopping the web application:
Stop the running web application on the VM.Go to prometheus > Alert > Website Down alert will be fired and you will get the mail to the configured mail id.
By taking down node exporter:
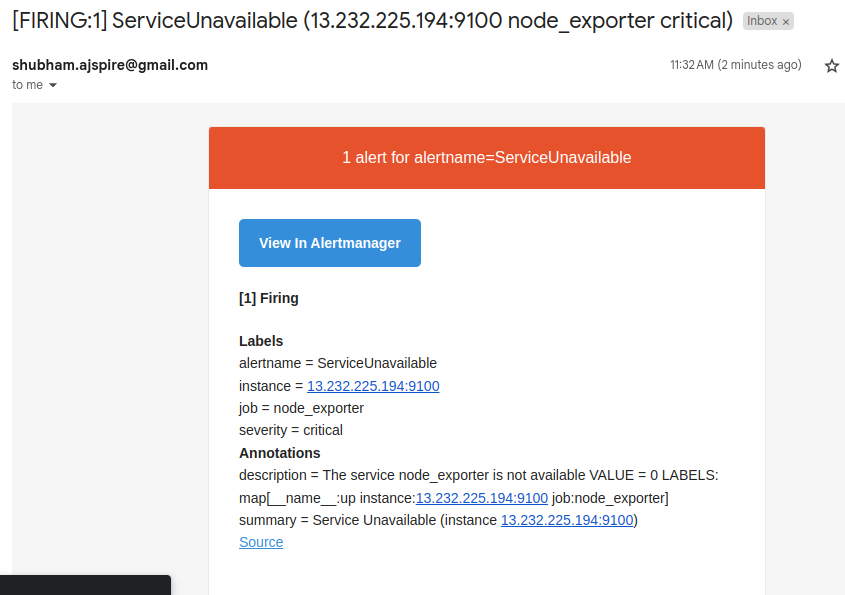
We will stop the node exporter service so that it will fire the email for Service unavailable and instance down.

Below is the screenshot showcasing the alert that we got through email regarding the service unavailable.

Conclusion:
In this project, we successfully set up a full-fledged DevOps monitoring solution using Prometheus, Blackbox Exporter, Node Exporter, and Alertmanager. This comprehensive setup enables real-time system and application monitoring, allowing you to track vital metrics and ensure service uptime. By integrating Alertmanager with email notifications, we’ve established a proactive alerting system that ensures timely responses to potential issues, helping teams maintain high system reliability and performance.
For more insightful content on technology, AWS, and DevOps, make sure to follow me for the latest updates and tips. If you have any questions or need further assistance, feel free to reach out—I’m here to help!
Streamline, Deploy, Succeed-- Devops Made Simple!☺️
Subscribe to my newsletter
Read articles from Shubham Taware directly inside your inbox. Subscribe to the newsletter, and don't miss out.
Written by

Shubham Taware
Shubham Taware
👨💻 Hi, I'm Shubham Taware, a Systems Engineer at Cognizant with a passion for all things DevOps. While my current role involves managing systems, I'm on an exciting journey to transition into a career in DevOps by honing my skills and expertise in this dynamic field. 🚀 I believe in the power of DevOps to streamline software development and operations, making the deployment process faster, more reliable, and efficient. Through my blog, I'm here to share my hands-on experiences, insights, and best practices in the DevOps realm as I work towards my career transition. 🔧 In my day-to-day work, I'm actively involved in implementing DevOps solutions, tackling real-world challenges, and automating processes to enhance software delivery. Whether it's CI/CD pipelines, containerization, infrastructure as code, or any other DevOps topic, I'm here to break it down, step by step. 📚 As a student, I'm continuously learning and experimenting, and I'm excited to document my progress and share the valuable lessons I gather along the way. I hope to inspire others who, like me, are looking to transition into the DevOps field and build a successful career in this exciting domain. 🌟 Join me on this journey as we explore the world of DevOps, one blog post at a time. Together, we can build a stronger foundation for successful software delivery and propel our careers forward in the exciting world of DevOps. 📧 If you have any questions, feedback, or topics you'd like me to cover, feel free to get in touch at shubhamtaware15@gmail.com. Let's learn, grow, and DevOps together!