🚀 `Vector.dev` The Perfect Observability Solution for Thousands of Remote Edges 1/n 🌐
 Naren P
Table of contents

A lightweight, ultra-fast tool for building observability pipelines
Vector is a high-performance, end-to-end (agent & aggregator) observability data pipeline that puts you in control of your observability data. Collect, transform, and route all your logs and metrics to any vendors you want today and any other vendors you may want tomorrow. Vector enables dramatic cost reduction, novel data enrichment, and data security where you need it, not where it is most convenient for your vendors. Additionally, it is open source and up to 10x faster than every alternative in the space.
More details: vector.dev
Example Installation
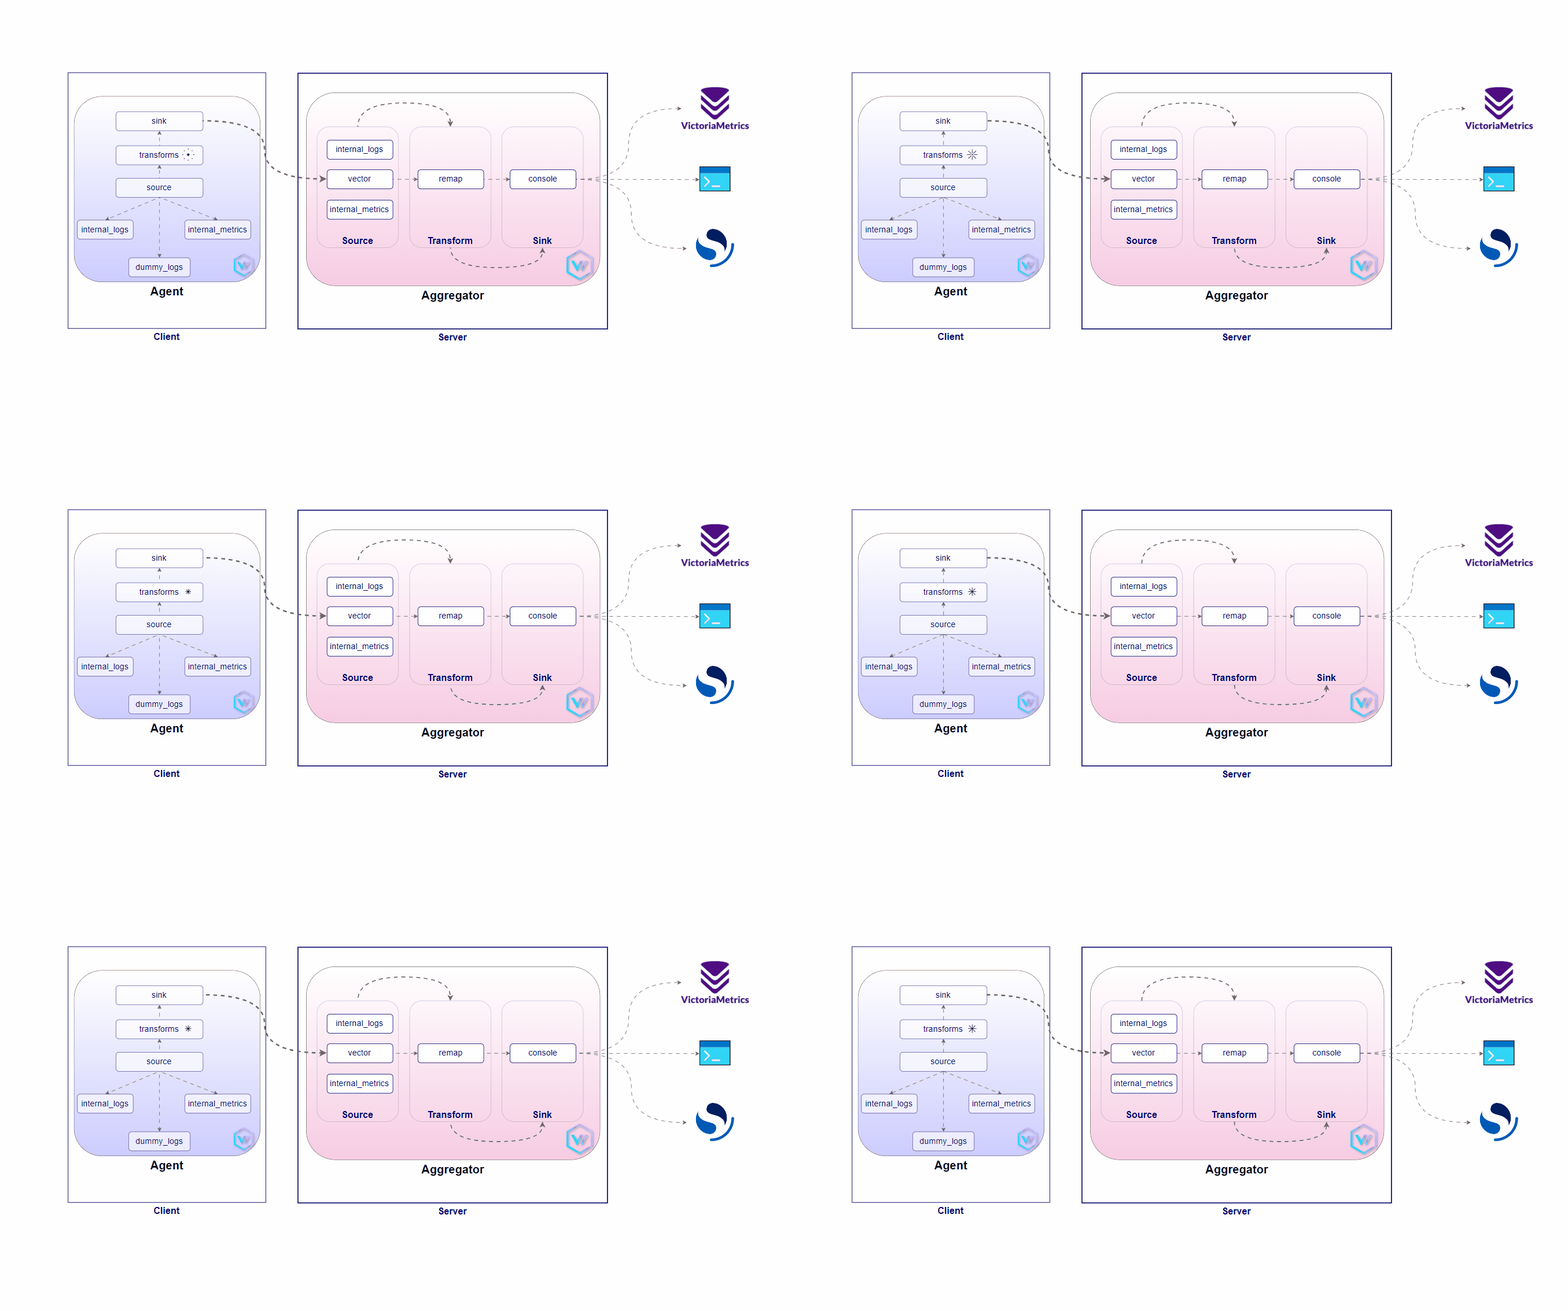
A solution has been designed to manage a fleet of 1000s of Edge Kubernetes clusters for a famous QSR restaurant chain business. This solution ensures that business-critical workloads continue running even when internet connectivity is not available, providing high availability across all locations.
This solution basically, focuses on Observability tools for real-time monitoring and operational optimization.Additionally, hundreds of thousands of IoT devices (including fryers, grills, and tablets) would be integrated and being handled daily/weekly/monthly, ensuring operational efficiency and remote control of devices.
This proposed architecture would ensure resiliency, scalability, and operational control at the edge, driving enhanced efficiency and performance in remote environments.
Server Setup
Aggregator vector.yaml Configuration File
mkdir -p aggregator
cat <<-EOF > $PWD/aggregator/vector.yaml
data_dir: /vector-data-dir
api:
  enabled: true
  address: 0.0.0.0:8686
sources:
  vector:
     address: 0.0.0.0:6000
     type: vector
     version: "2"
  my_internal_logs:
    type: internal_logs
  my_internal_metrics:
    type: internal_metrics
transforms:
  parse_logs:
    type: "remap"
    inputs: [vector,my_internal_logs,my_internal_metrics]
    source: |
      . = parse_syslog!(string!(.message))
sinks:
  stdout:
    type: console
    inputs: [parse_logs]
    encoding:
        codec: json
EOF
Configuration Ref:
api:
source:
transforms:
sink:
Deploy the Server (vector aggregator)
# docker rm -f vector-aggregator
docker run -d --rm --name vector-aggregator -v $(pwd)/aggregator:/etc/vector/  -p 8686:8686 -p 6000:6000 docker.io/timberio/vector:0.41.1-alpine
Client(s) Setup
Vector Agent vector.yaml Configuration File
mkdir -p agent
cat <<-EOF > $PWD/agent/vector.yaml
data_dir: /vector-data-dir
api:
  enabled: false
  address: 0.0.0.0:8686
sources:
  dummy_logs:
    type: "demo_logs"
    format: "syslog"
    interval: 1
  my_internal_logs:
    type: internal_logs
  my_internal_metrics:
    type: internal_metrics
transforms:
  parse_logs:
    type: "remap"
    inputs: ["dummy_logs"]
    source: |
      . = parse_syslog!(string!(.message))
sinks:
  vector_sink:
    type: vector
    inputs:
      - dummy_logs
    address: 172.17.0.1:6000  #Change me
  stdout:
    type: console
    inputs: [parse_logs,my_internal_logs,my_internal_metrics]
    encoding:
        codec: json
EOF
Configuration Ref:
source:
transforms:
sink:
Deploy the Client (vector agent)
#docker rm -f vector-agent
docker run -d --name vector-agent -v $(pwd)/agent:/etc/vector/ --rm docker.io/timberio/vector:0.41.1-alpine
Now, your Vector Aggregator and Vector Agent are set up and running. They can efficiently collect, transform, and route logs and metrics, offering complete control over your observability data pipeline.
Subscribe to my newsletter
Read articles from Naren P directly inside your inbox. Subscribe to the newsletter, and don't miss out.
Written by
