Analyzing Sales Data from a NYC Coffee Shop
 Iman Adeko
In my last post, I expressed my interest in undertaking a data modeling and visualization project in Snowflake. In this post, I will guide you through the entire process, step by step. Before you begin, ensure that you have Snowflake and SnowSQL set up and configured before you start. Check out my previous post for help.
Project Overview
This project demonstrates my proficiency in Snowflake and SnowSQL. I successfully imported a local CSV file into Snowflake using SnowSQL, normalized the data, and established relationships between tables to create a robust data model. To visualize key metrics, I developed a simple dashboard utilizing Snowflake's built-in visualization tools.
To showcase my skills in Snowflake and SnowSQL, I utilized a CSV dataset containing anonymized transaction data from a coffee shop with three NYC locations. The dataset includes transaction details such as date, time, location, and product information

Importing the data into Snowflake
Before I imported the data, I created a database and a table that will hold the data. I did this using SnowSQL.
I opened Command Prompt, switched to SnowSQL, and connected to my Snowflake account. (If you're unsure how, refer to my previous post.) Here's the code I used to create the database and table:
-- Create new database `coffee_sales
CREATE DATABASE IF NOT EXISTS coffee_sales;

-- Activate the database
USE coffee_sales;

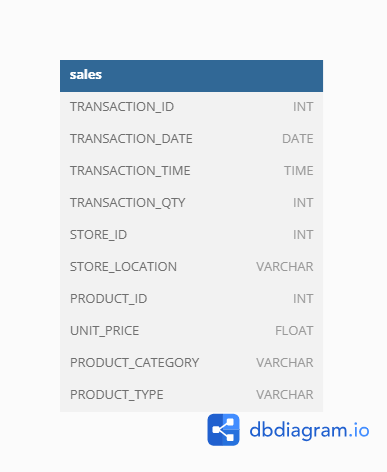
-- Create table according to schema above
CREATE OR REPLACE TABLE sales (
  transaction_id NUMBER(10, 0) PRIMARY KEY,
  transaction_date DATE,
  transaction_time TIME,
  transaction_qty NUMBER(5, 0),
  store_id NUMBER(5, 0),
  store_location VARCHAR(100),
  product_id NUMBER(10, 0),
  unit_price (10, 2),
  product_category VARCHAR(100),
  product_type VARCHAR(100)
);
Next, I created a stage to temporarily store the CSV file before inserting it into the Snowflake table. Here's the code I used to create the stage, upload the data, and insert it into the sales table:
-- Create stage
CREATE STAGE coffee_sales_stage;

-- Put data in the stage (file has to be in lower-case)
PUT file://C:\Users\USER\Desktop\Datasets_and_vizzes\Coffee_Shop_Sales\Coffee_Shop_Sales.csv @coffee_sales_stage;

-- Copy data into the table you created
COPY INTO sales
FROM @coffee_sales_stage
FILE_FORMAT = (SKIP_HEADER = 1 DATE_FORMAT = 'DD-MM-YY'); -- Skips the header row and specifies the date format in the data
To reduce the chances of running into errors, make sure the names of the folders and file in your filepath are in snake case and contain no special characters.
Now that our data in the table, we can now start modelling it in our Snowflake environment.
Modelling the data
Each row in the dataset represents a single coffee sale, including:
Transaction details: date, time, quantity, and price
Store details: location and ID
Product details: ID, type, and category
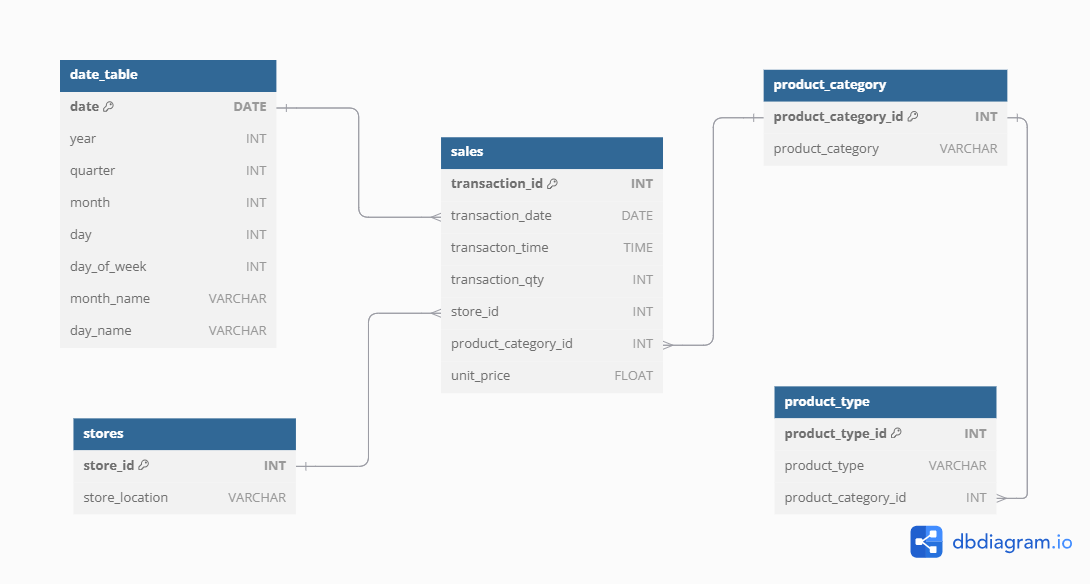
To model the data effectively, I created separate tables for location and product details. Additionally, a date table will be necessary to analyze sales metrics at various date granularities.
This is the data model I worked towards.

-- Create stores table
CREATE OR REPLACE TABLE stores (
    store_id NUMBER(5, 0) PRIMARY KEY,
    store_location VARCHAR(100)
);

-- Insert store details from the sales table into the stores table
INSERT INTO stores
SELECT DISTINCT store_id,
                 store_location
FROM sales;
After inspecting the product columns, I discovered:
80 unique product IDs
9 distinct product categories
29 distinct product types
To create a more intuitive structure, I'll introduce new IDs for product categories and product types in the sales table. These IDs will reference separate tables for product categories and product types.
-- Create product category table
CREATE OR REPLACE TABLE product_category (
    product_category_id NUMBER(5, 0) PRIMARY KEY,
    product_category VARCHAR(100)
);

-- Insert product category details from sales table
INSERT INTO product_category
SELECT ROW_NUMBER() OVER(ORDER BY product_category),
        product_category
FROM sales
GROUP BY product_category;

-- Create product_type table
CREATE OR REPLACE TABLE product_type (
    product_type_id NUMBER(5, 0) PRIMARY KEY,
    product_type VARCHAR(100)
);

-- Insert product type details from sales table
INSERT INTO product_type
SELECT ROW_NUMBER() OVER(ORDER BY product_type),
        product_type
FROM sales
GROUP BY product_type;
With the product category and product type tables created, I'll now add and update their respective IDs in the sales table.
-- Add new columns: product_category_id and product_type_id to the sales table
ALTER TABLE sales
ADD COLUMN product_category_id NUMBER(5, 0);

ALTER TABLE sales
ADD COLUMN product_type_id NUMBER(5, 0);

-- Update product_category_id and product_type_id in sales table using their respective tables
UPDATE sales
SET product_category_id = pc.product_category_id
FROM product_category AS pc
WHERE sales.product_category = pc.product_category;

UPDATE sales
SET product_type_id = pt.product_type_id
FROM product_type AS pt
WHERE sales.product_type = pt.product_type;
In the product_type table, I added and updated a product_category_id column for each product type. This column connects the product_type table to the product_category table.
-- Create product_category_id in product_type
ALTER TABLE product_type
ADD COLUMN product_category_id NUMBER(5, 0);

-- Update product_category_id for each product_type
UPDATE product_type AS pt
SET product_category_id = s.product_category_id
FROM sales AS s
WHERE pt.product_type = s.product_type;
To analyze sales metrics at different date granularities, I created and populated a date table. Since all data is from 2023, the table includes all dates of that year. I also added columns for year, month, quarter, and other relevant date parts.
-- Create date table
CREATE OR REPLACE TABLE date_table (
    date DATE PRIMARY KEY,
    year NUMBER(4, 0),
    quarter NUMBER(1, 0),
    month NUMBER(2, 0),
    day NUMBER(2, 0),
    day_of_week NUMBER(1),
    month_name VARCHAR(10),
    day_name VARCHAR(10)
);

-- Populate date_table with all dates in 2023
SET(start_date, end_date) = ('2023-01-01', '2024-01-01');
SET row_count = (SELECT
                DATEDIFF(DAY,
                    TO_DATE($start_date),
                    TO_DATE($end_date)
                        )
                );

INSERT INTO date_table
WITH cte AS(
    SELECT ROW_NUMBER() OVER(ORDER BY SEQ4()) - 1 AS row_number,
        DATEADD(DAY, row_number, $start_date)::DATE AS date
    FROM TABLE(GENERATOR(rowcount => $row_count))
    )
SELECT date,
        YEAR(date),
        QUARTER(date),
        MONTH(date),
        DAY(date),
        DAYOFWEEK(date),
        MONTHNAME(date),
        DAYNAME(date)
FROM cte;
To establish relationships between the tables, I added foreign keys to the sales and product_type tables. Here are the relationships:
date_table(date) > sales(transaction_date)
stores(store_id) > sales(store_id)
product_category(product_category) > sales(product_category_id)
product_type(product_category_id) > product_category(product_category_id)
-- Establishing relationships
-- Establish relationships between by adding foreign keys to the sales and product_type tables
ALTER TABLE sales
ADD FOREIGN KEY (transaction_date) REFERENCES date_table(date);

ALTER TABLE sales
ADD FOREIGN KEY (store_id) REFERENCES stores(store_id);

ALTER TABLE sales
ADD FOREIGN KEY (product_category_id) REFERENCES product_category(product_category_id);

ALTER TABLE product_type
ADD FOREIGN KEY (product_category_id) REFERENCES product_category(product_category_id);
To simplify the data model, I dropped the following redundant columns from the sales table:
store_location
product_id
product_category
product_type
product_type_id
-- Drop redundant columns from sales table
ALTER TABLE sales
DROP COLUMN store_location,
            product_id,
            product_category,
            product_type,
            product_type_id;
Creating the dashboard
Snowflake provides basic data visualization capabilities through dashboards. Each visual is built on an underlying query. While Snowflake can create simple dashboards, it's often used to visualize key performance indicators (KPIs) due to its limitations in creating complex, interactive dashboards. For more advanced visualizations, consider connecting Snowflake to tools like Tableau or Power BI. Snowflake supports the following kinds of charts:
Line charts
Bar charts
Scatter plots
Heatgrids
Scorecards
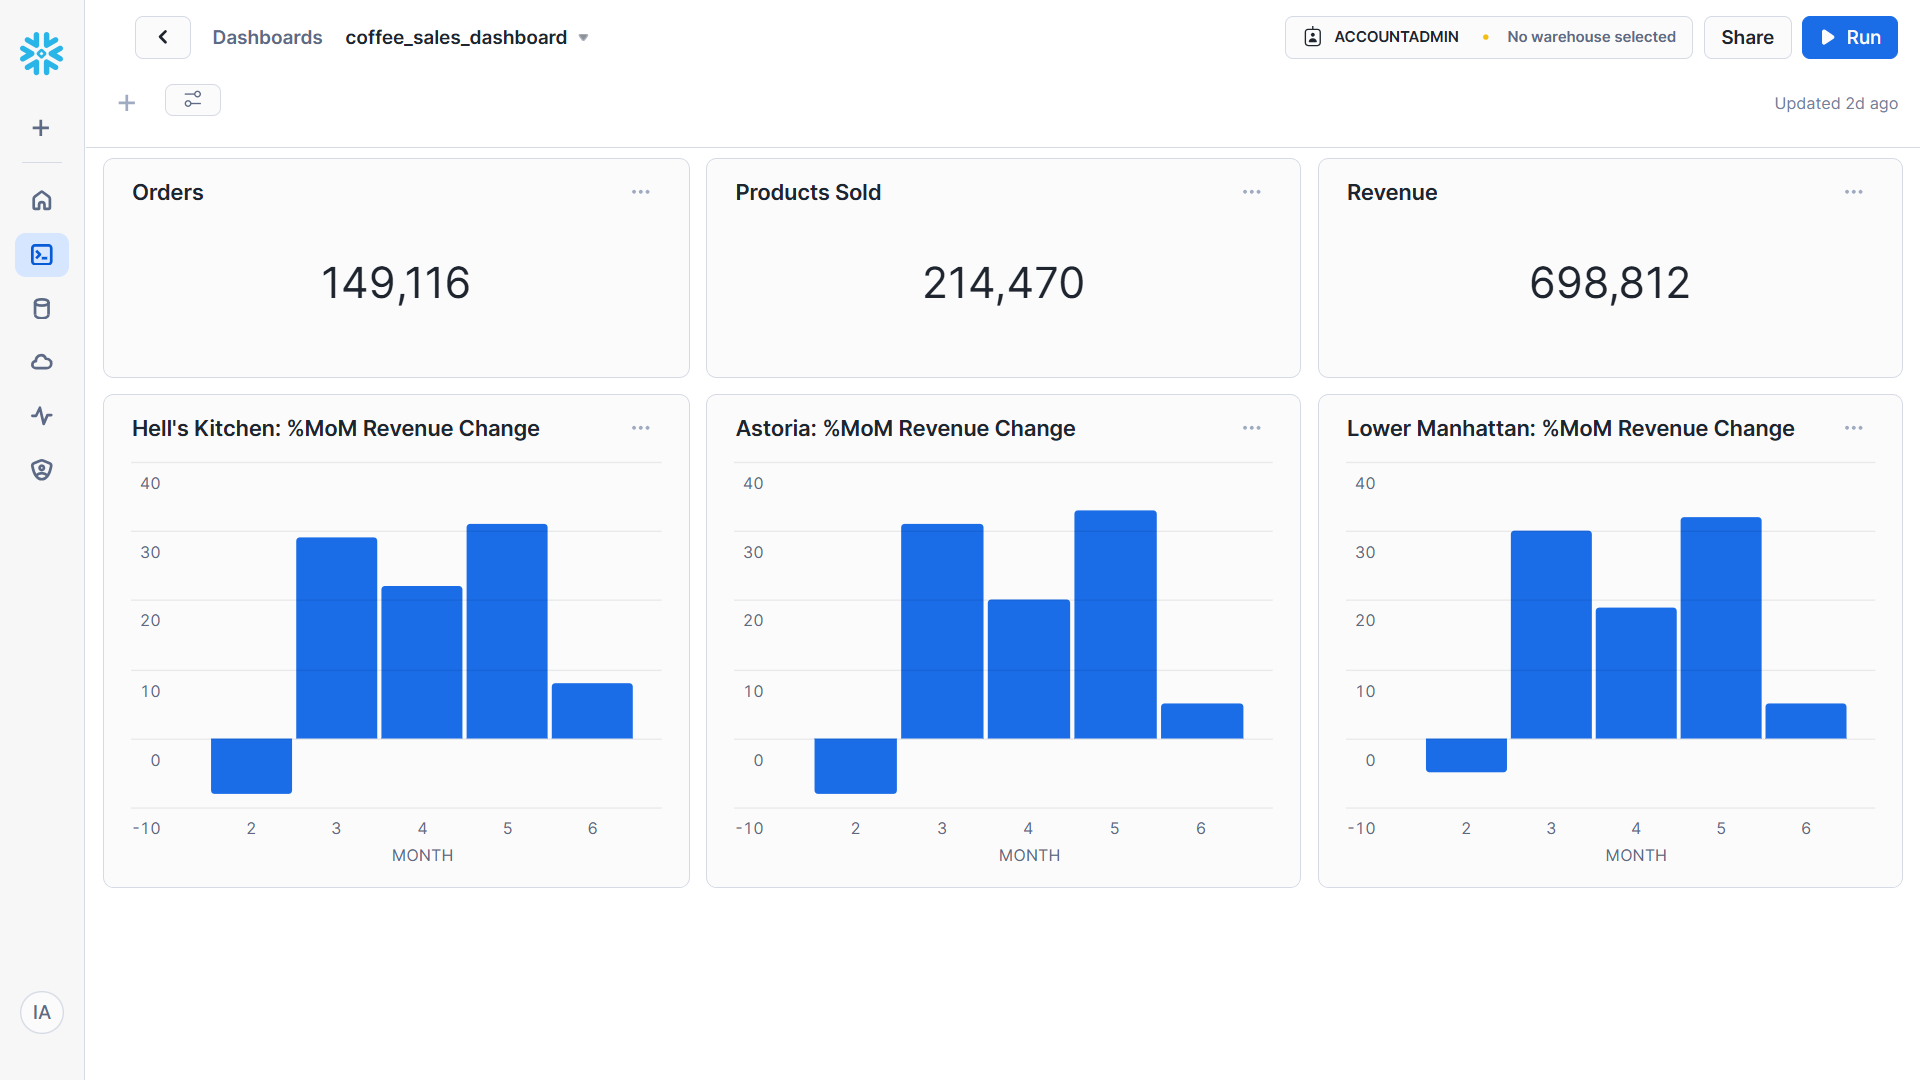
I created a simple dashboard showing the number of sales made, number of products sold, amount of revenue generated, and the percentage month-on-month revenue change for each of the three stores. You can find the queries for each of these below.
-- Number of sales made
SELECT COUNT(*)
FROM sales;

-- Number of products sold
SELECT SUM(transaction_qty)
FROM sales;

-- Amount of revenue generated
SELECT ROUND(SUM(unit_price * transaction_qty))
FROM sales;

-- Calculating %MoM change in revenue for each store
WITH monthly_revenue AS (
SELECT MONTH(s.transaction_date) AS month,
        SUM(s.transaction_qty * s.unit_price) AS revenue
FROM sales AS s
JOIN stores AS st
ON s.store_id = st.store_id
WHERE st.store_location = "Hell\'s Kitchen" -- Filter for store location accordingly
GROUP BY month
ORDER BY month
)
SELECT month,
        ROUND(
        100 * (
        (revenue - LAG(revenue) OVER(ORDER BY month)) /
        LAG(revenue) OVER(ORDER BY month)
        )) AS perc_mom_revenue_change
FROM monthly_revenue;
Below is the dashboard

Conclusion
This project showcases my ability to import, model, and visualize data using Snowflake and SnowSQL. I created a comprehensive data model and utilized Snowflake's visualization features to analyze sales performance by location and product. The project highlights Snowflake's potential for data analysis and the value of effective data modeling in extracting actionable insights. For more advanced visualizations, integrating Snowflake with tools like Tableau or Power BI is recommended.
Check out the resources for this project on my github here.
Subscribe to my newsletter
Read articles from Iman Adeko directly inside your inbox. Subscribe to the newsletter, and don't miss out.
Written by
