ArgoStack: Three-Tier Kubernetes, Helm, and Observability Pipeline
 PrithishG
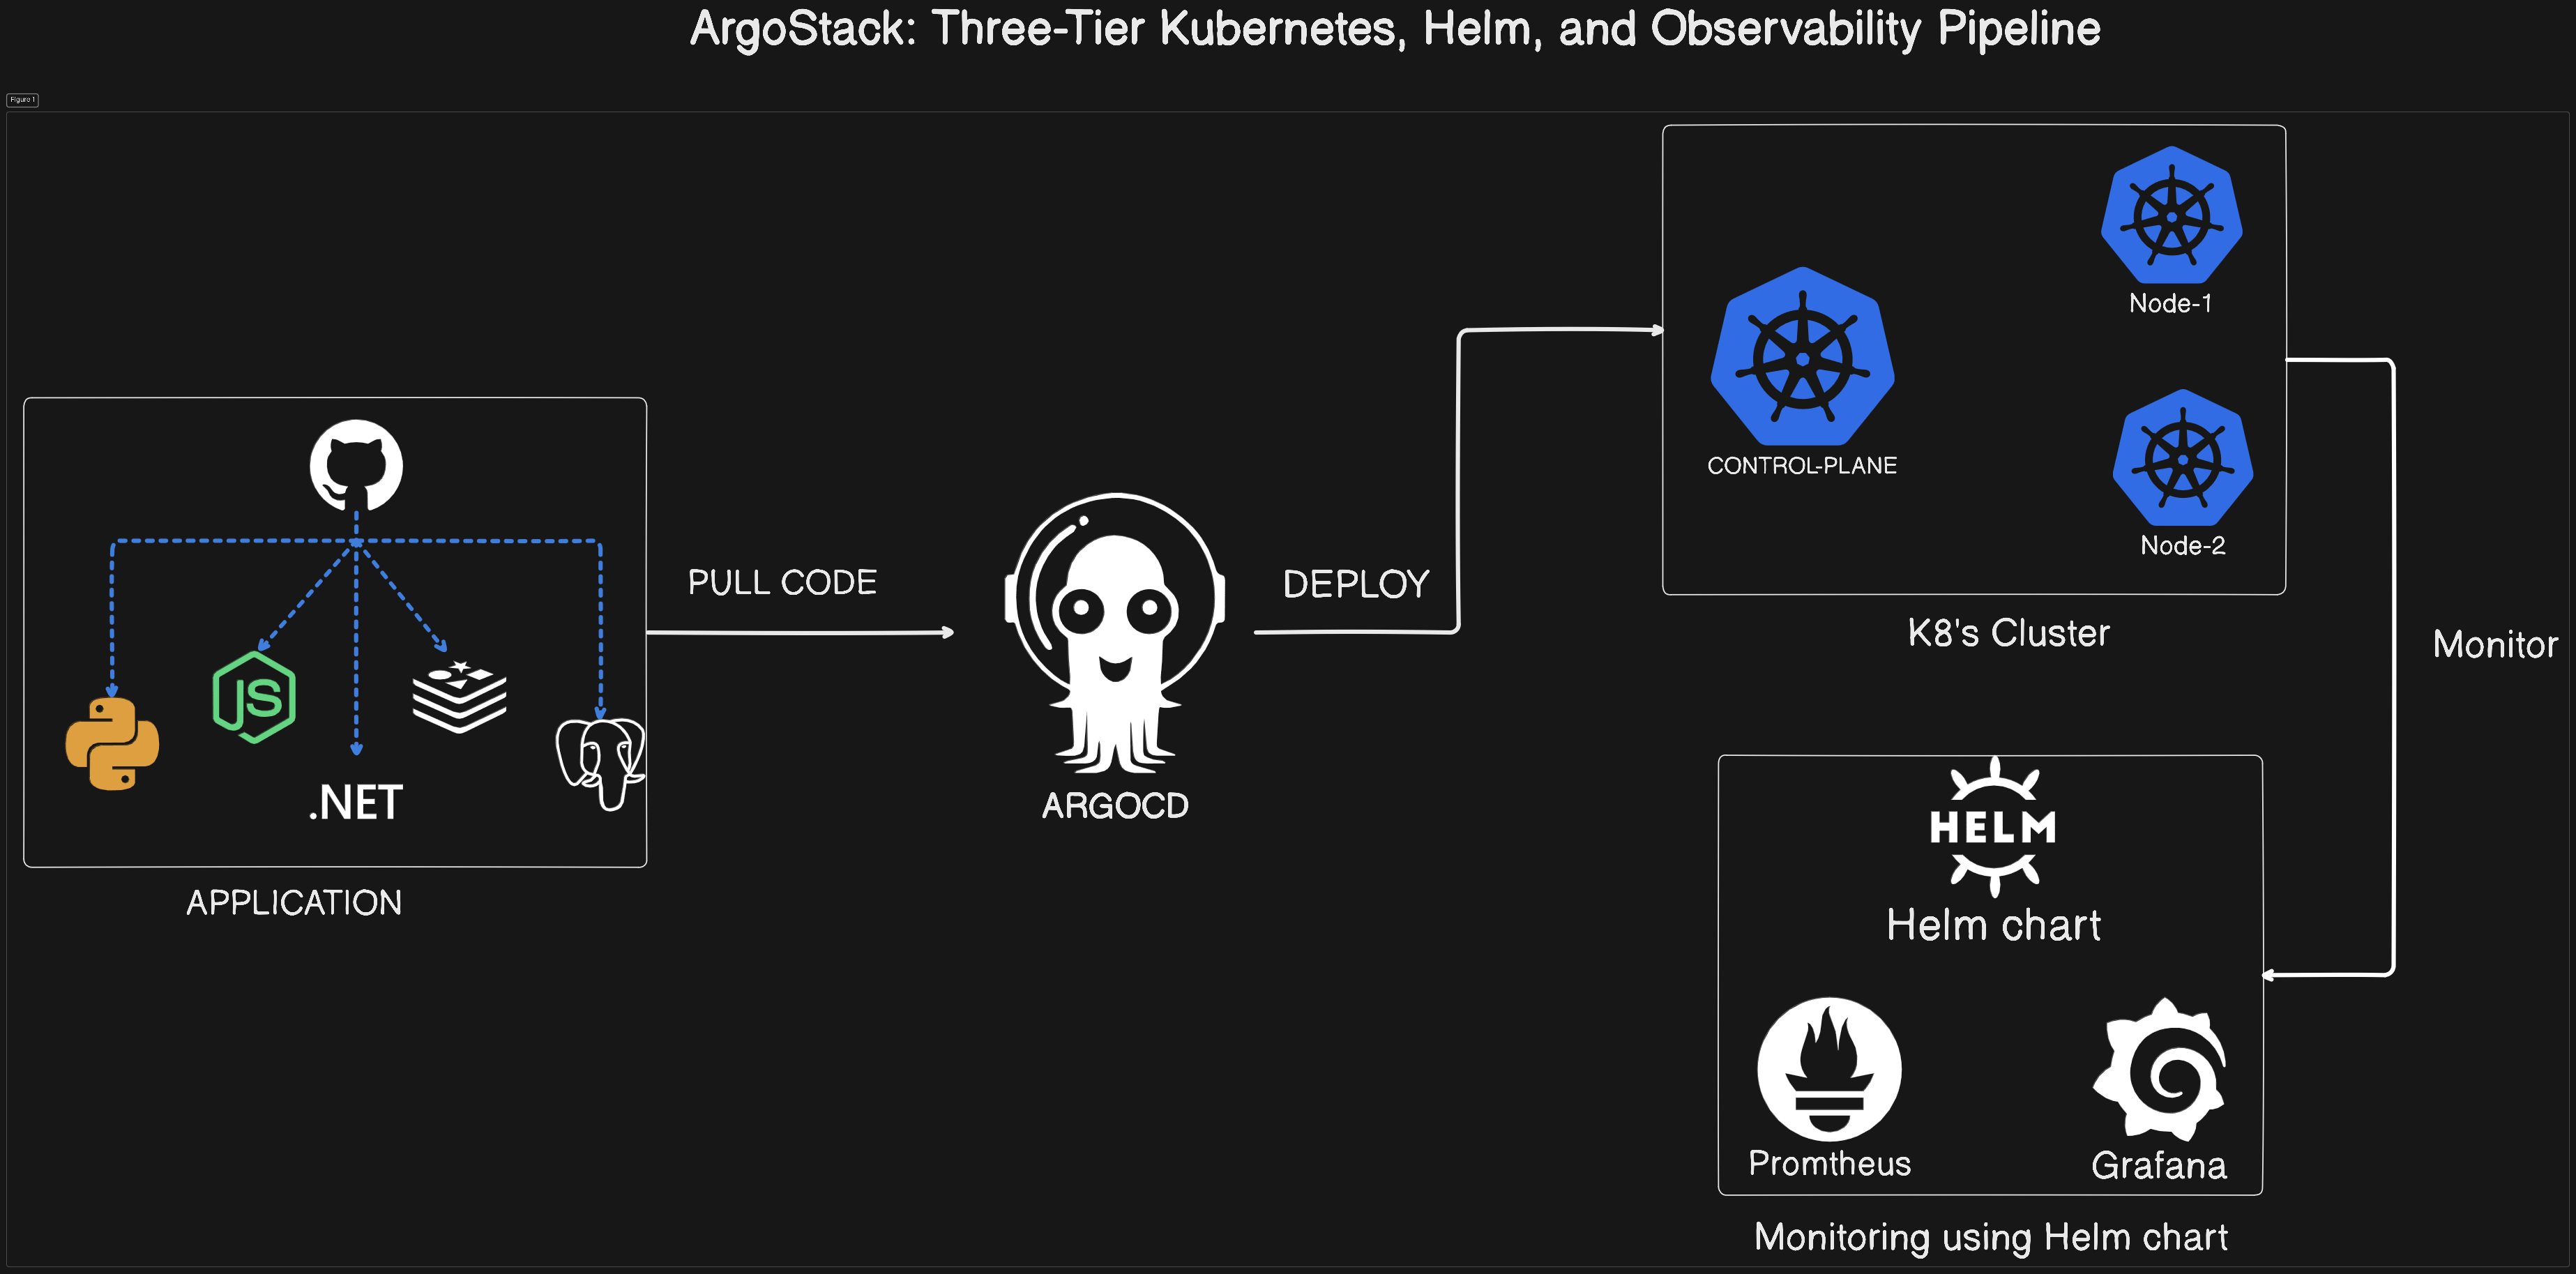
ArgoStack integrates seamless GitOps-driven deployments for three-tier applications using ArgoCD, Kubernetes, and Helm charts. It ensures robust monitoring and observability through Prometheus and Grafana, providing a complete automated CI/CD pipeline for scalable applications.
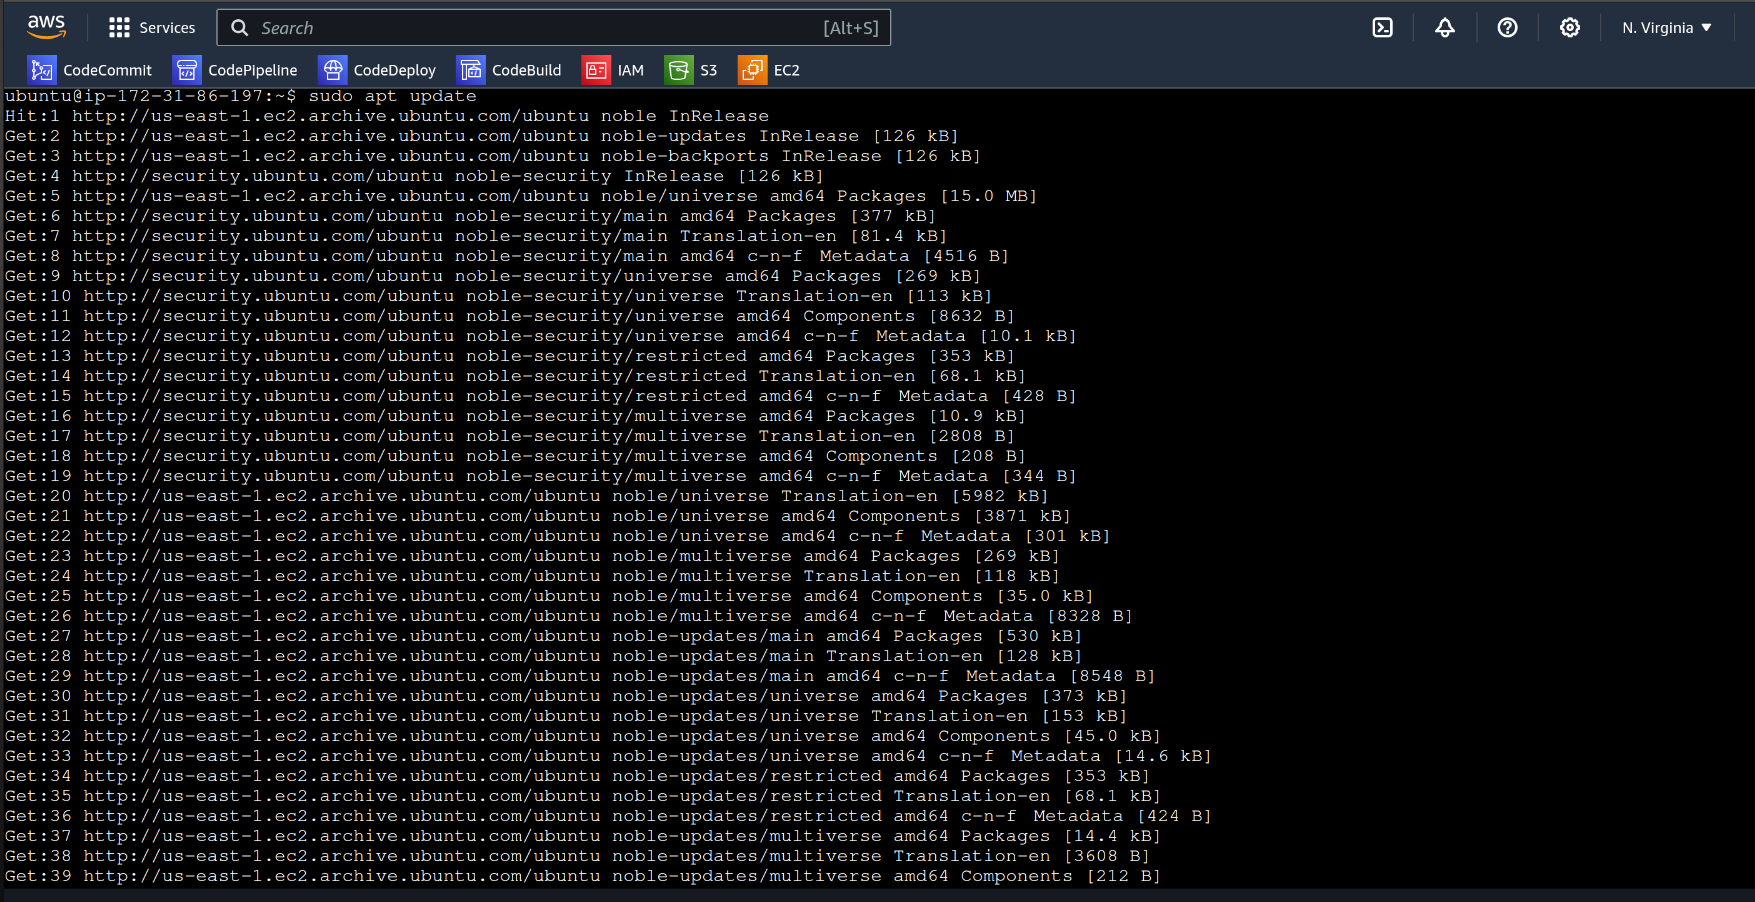
AWS » create a t2.medium machine with at-least 30GB volume » launch the instance , connect it & update the existing packages using :
sudo apt update
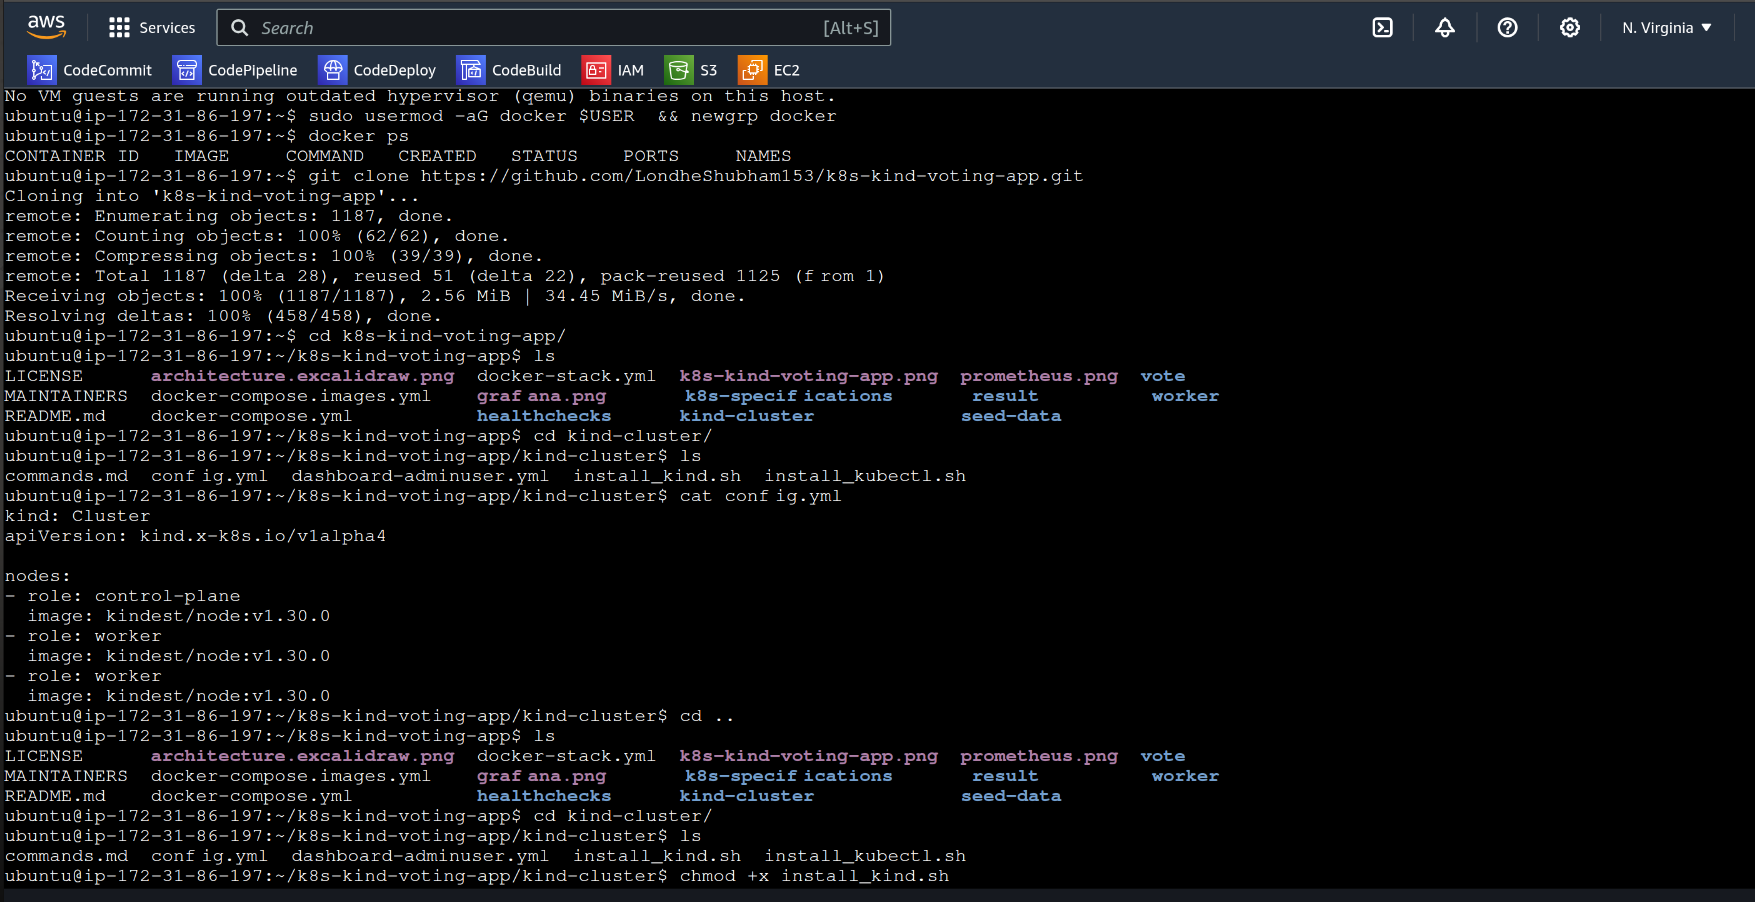
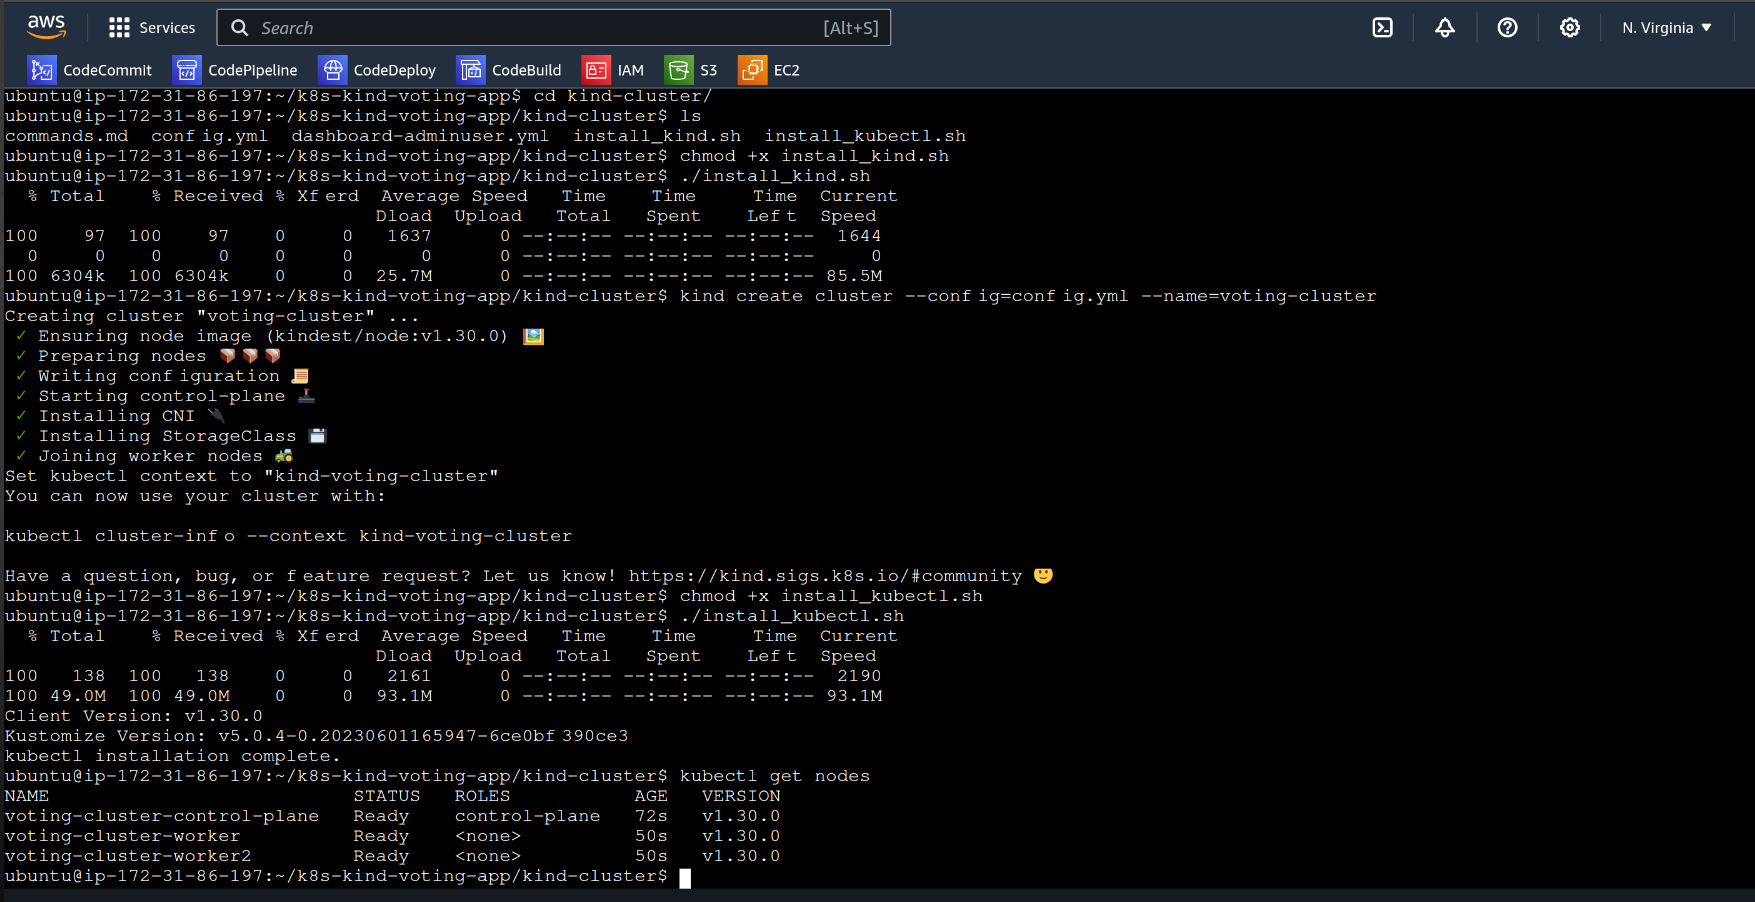
let’s clone the vote application from github and install kind along with kubectl :
git clone https://github.com/imprithwishghosh/k8s-kind-voting-app.git
cd k8s-kind-voting-app/kind-cluster/
./install_kind.sh
./install_kubectl.sh
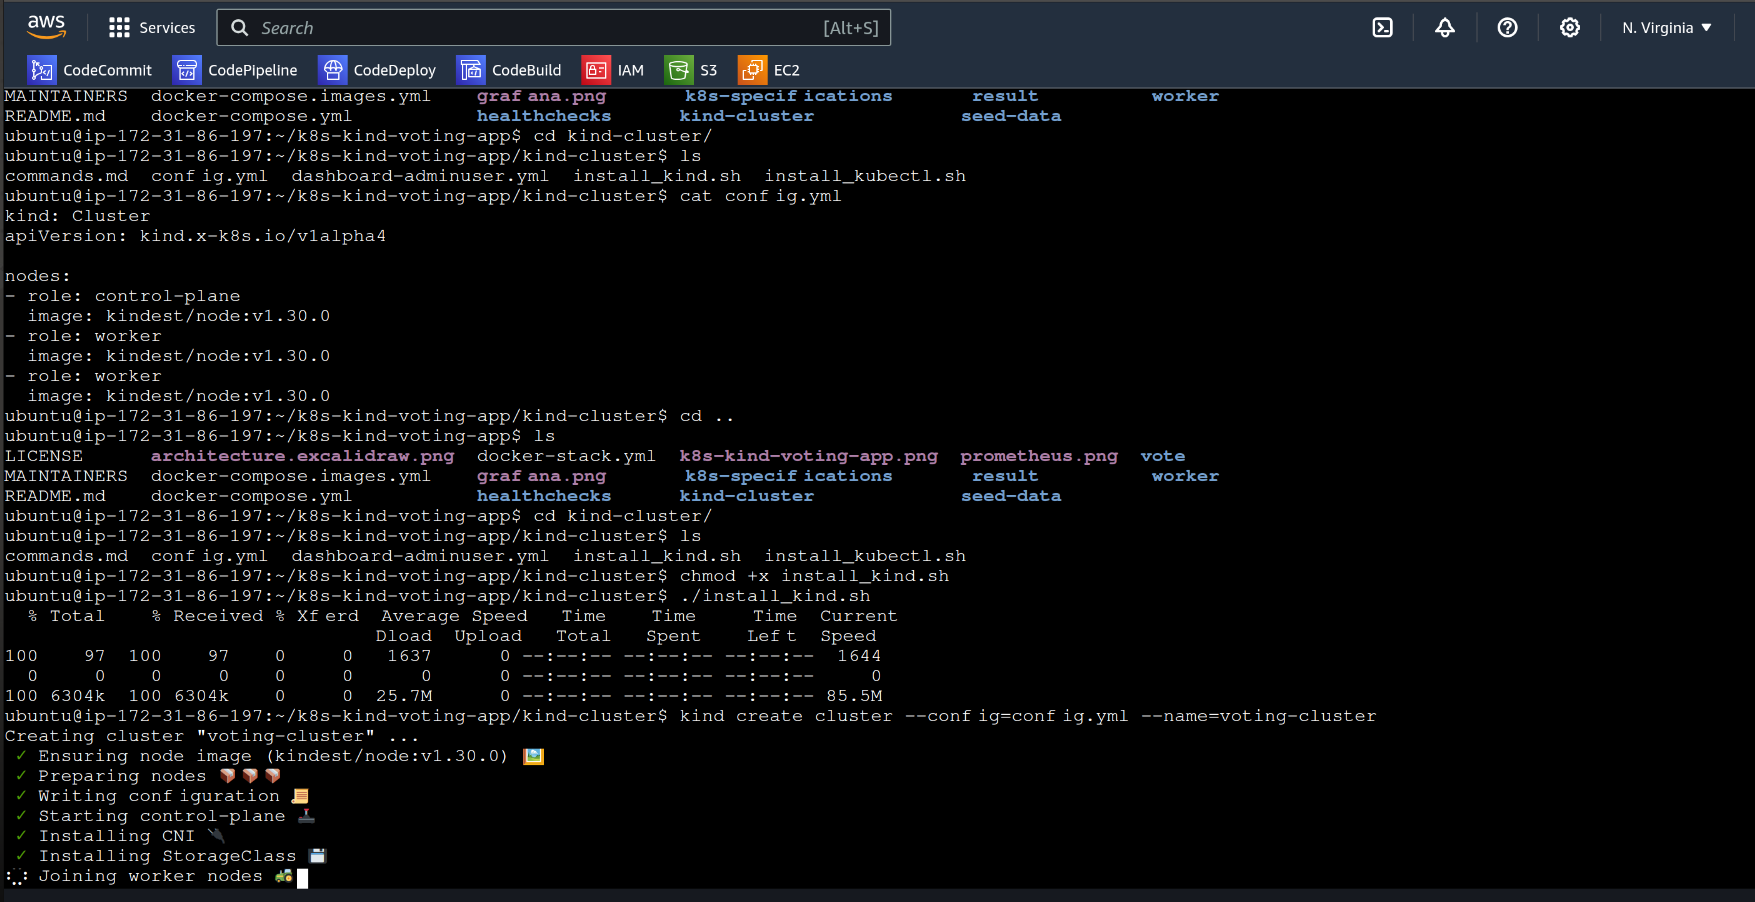
This kind.sh script along with kind command to create 1 control plane and 2 nodes . (Refer the below snap)
kind create cluster --config=config.yml
let’s check the pods and their status :
kubectl get pods
now we have all configuration files inside k8s-kind-voting-app/k8s-specifications/
Configuration Files :
%[https://github.com/imprithwishghosh/k8s-kind-voting-app/tree/main/k8s-specifications]

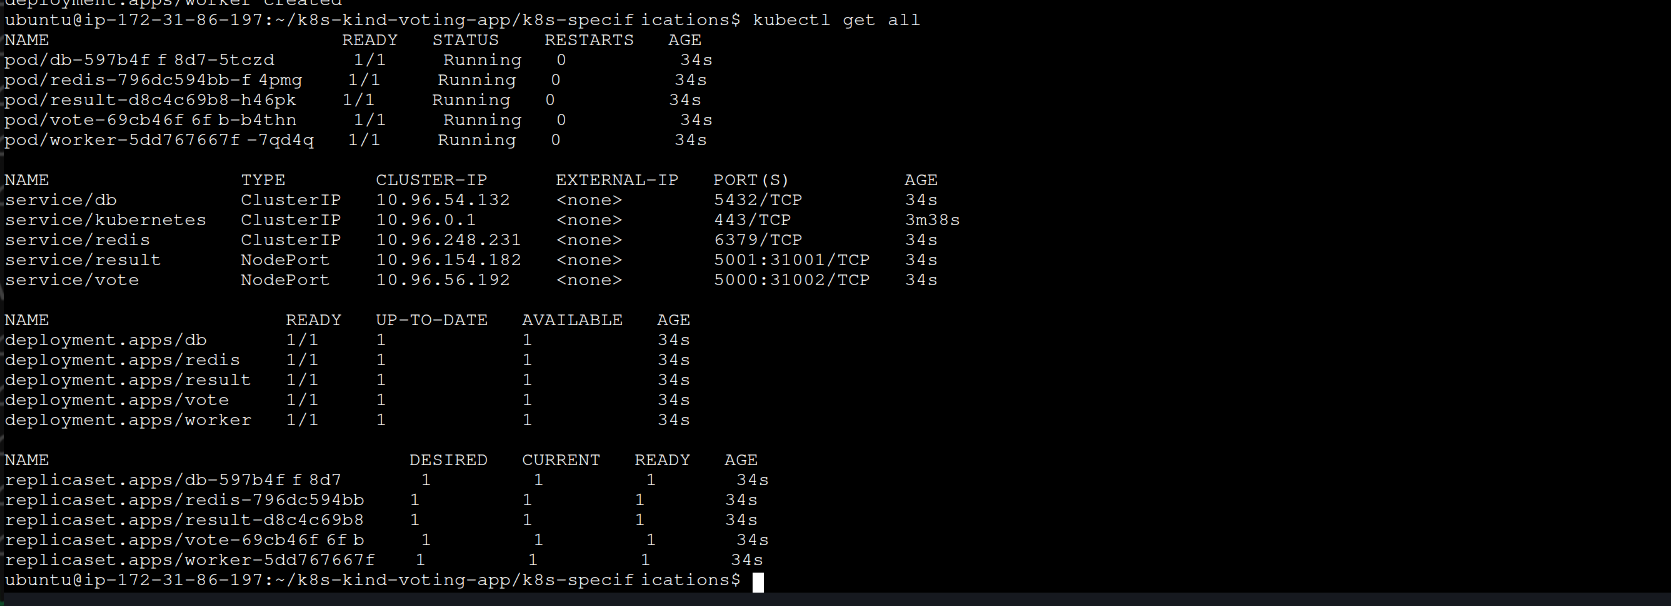
now let’s check whether all services and deployments are running or not :
kubectl get all
now it’s time to sync argoCD and make CD part :
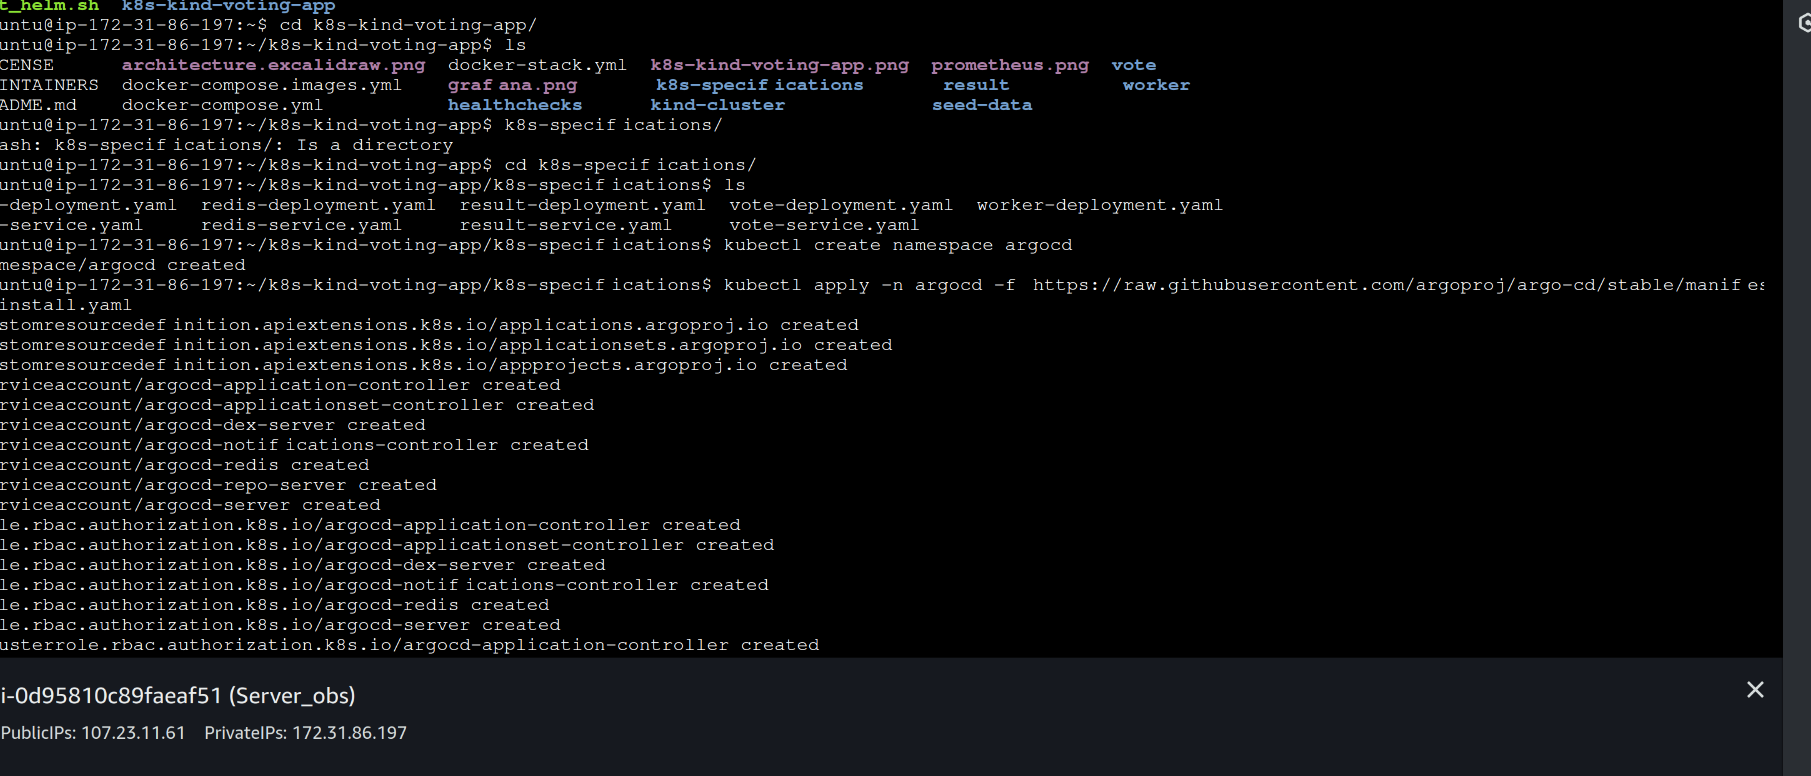
kubectl create namespace argocd
kubectl apply -n argocd -f https://raw.githubusercontent.com/argoproj/argo-cd/stable/manifests/install.yaml
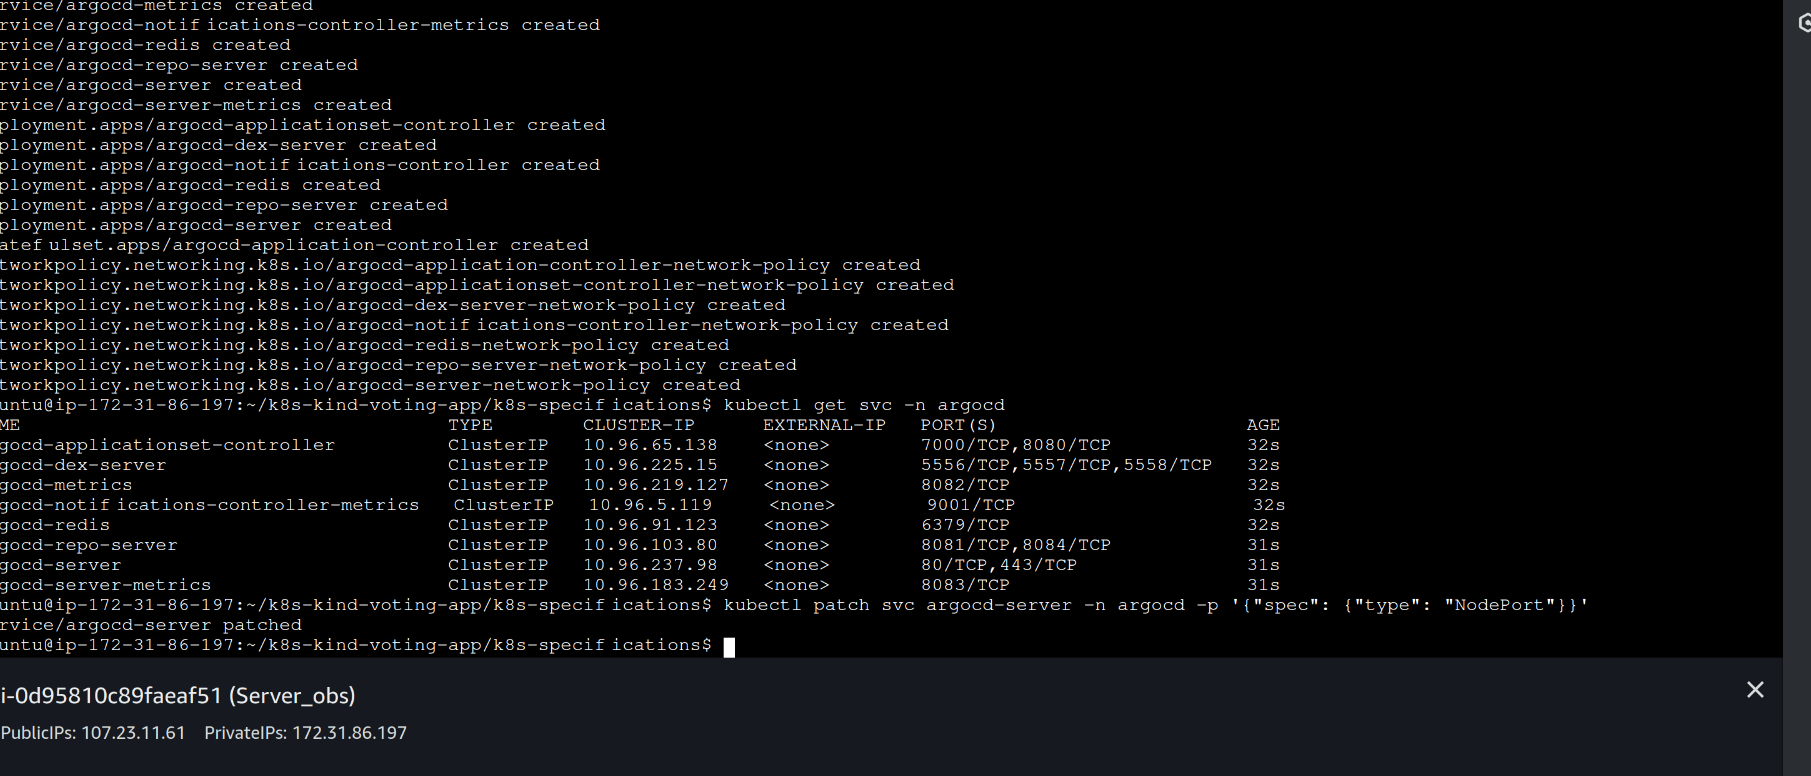
kubectl get svc -n argocd
kubectl patch svc argocd-server -n argocd -p '{"spec": {"type": "NodePort"}}'
kubectl port-forward -n argocd service/argocd-server 8443:443 &
now exposing the service to access our ArgoCD UI and add details about our deployment files :
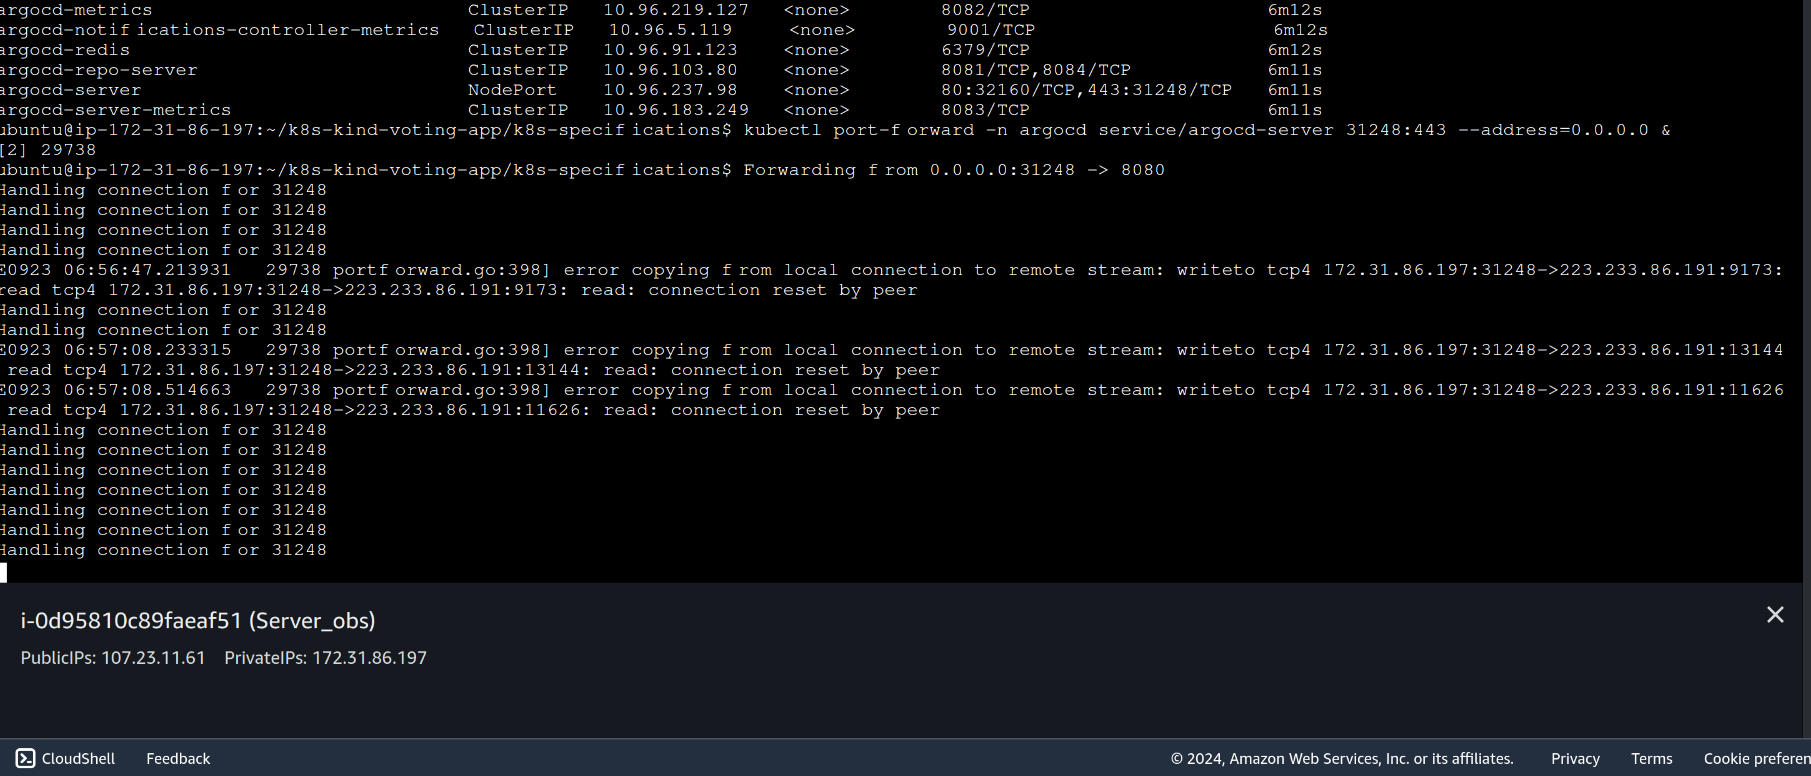
Public URL of the instance followed by the Port :
Argo access

get the password and setup can be found using this command :
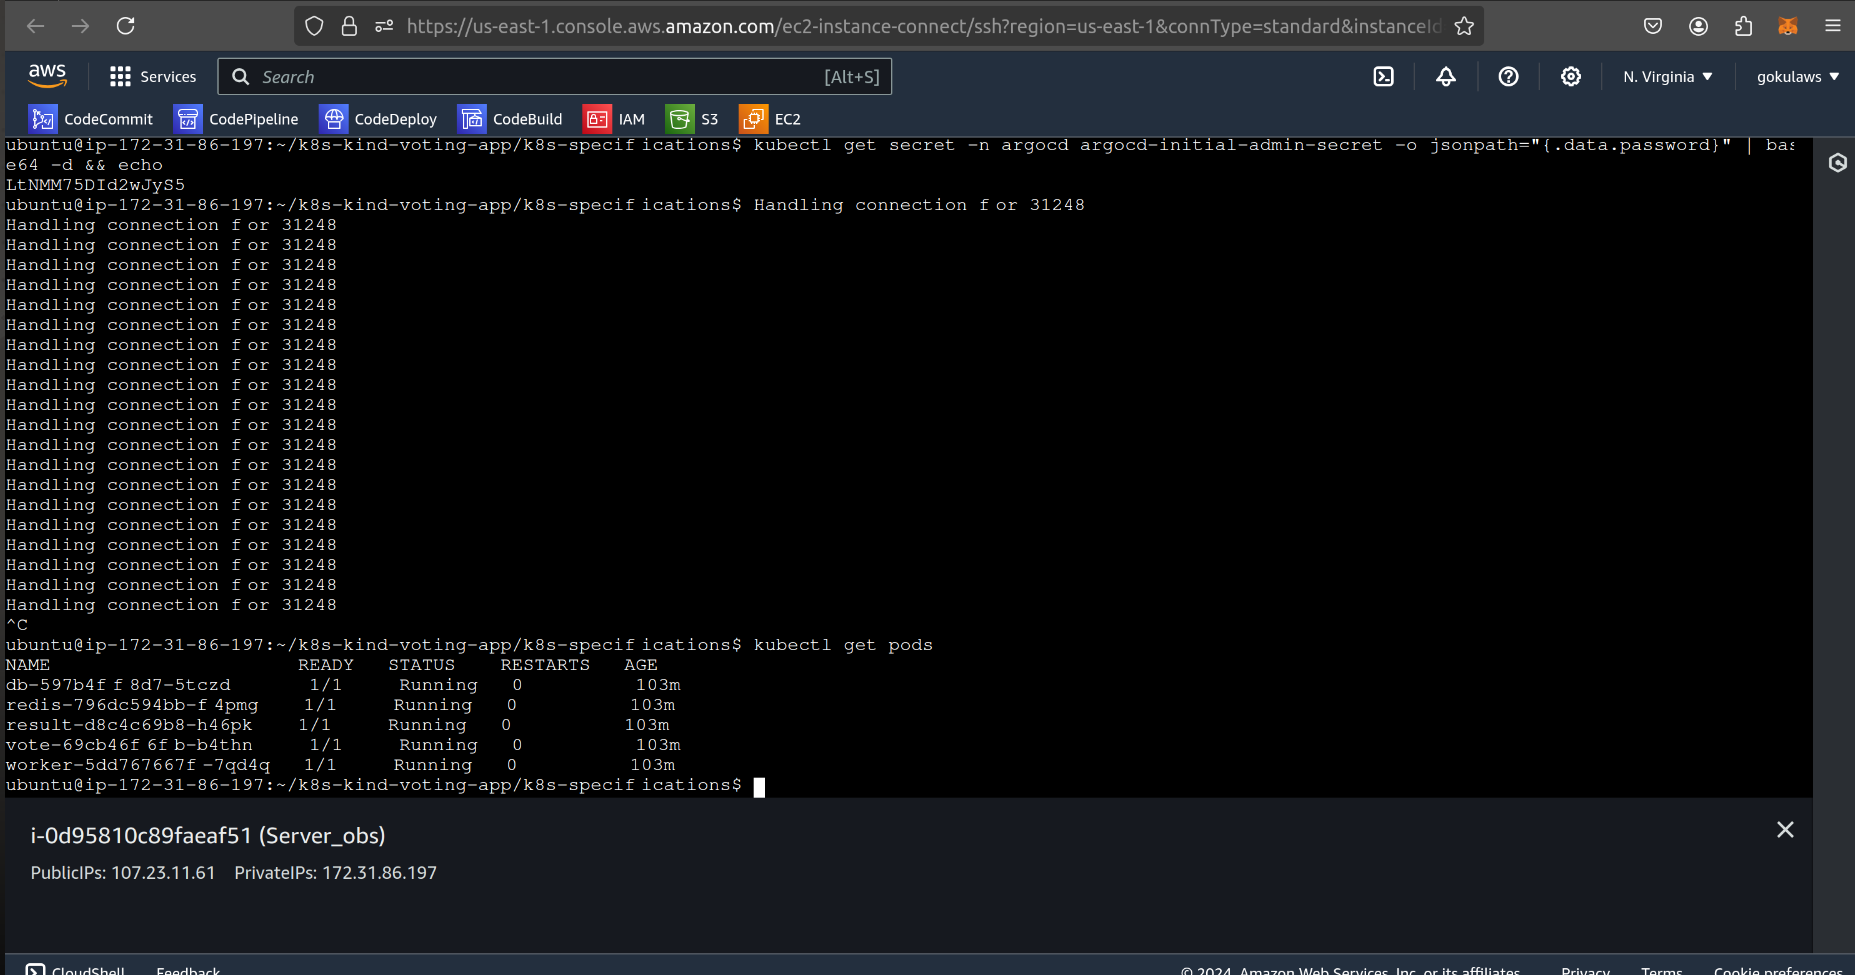
kubectl get secret -n argocd argocd-initial-admin-secret -o jsonpath="{.data.password}" | base64 -d && echo

after logged in i have added my deployment files path and ticked the option that it should auto sync in-order to fetch latest code commit and my pods are running and up :


exposing our application and accessing it via browser :

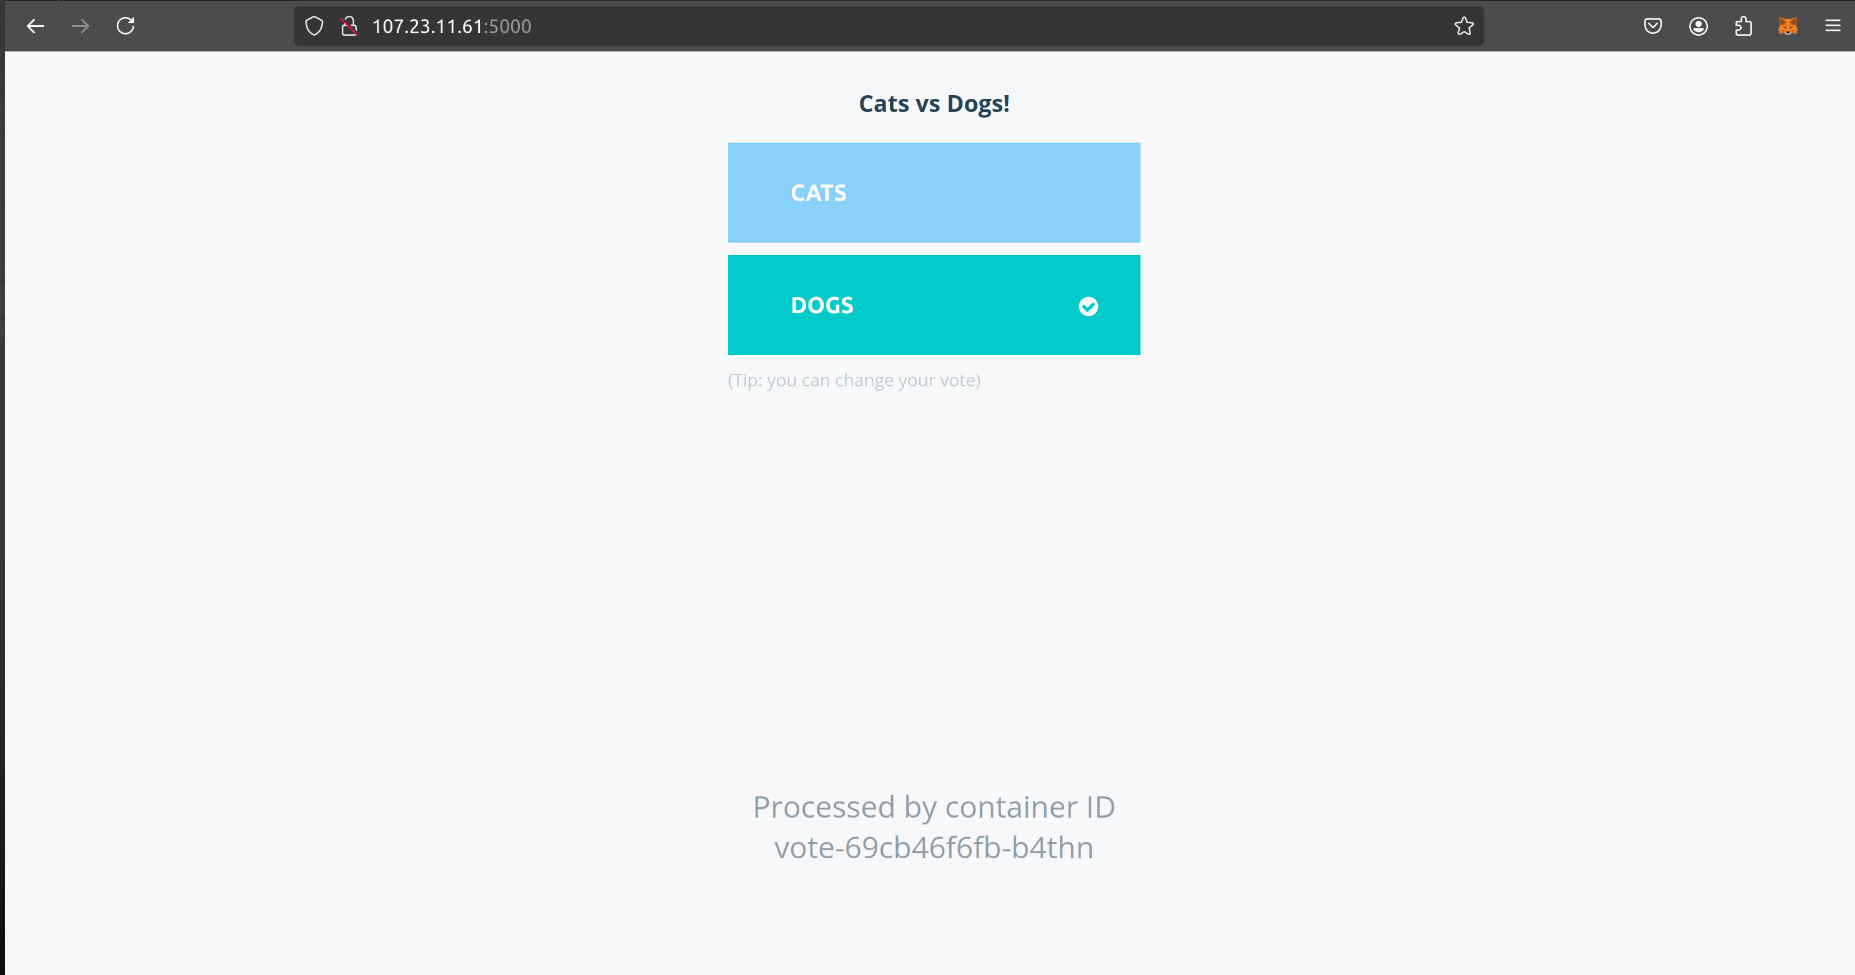
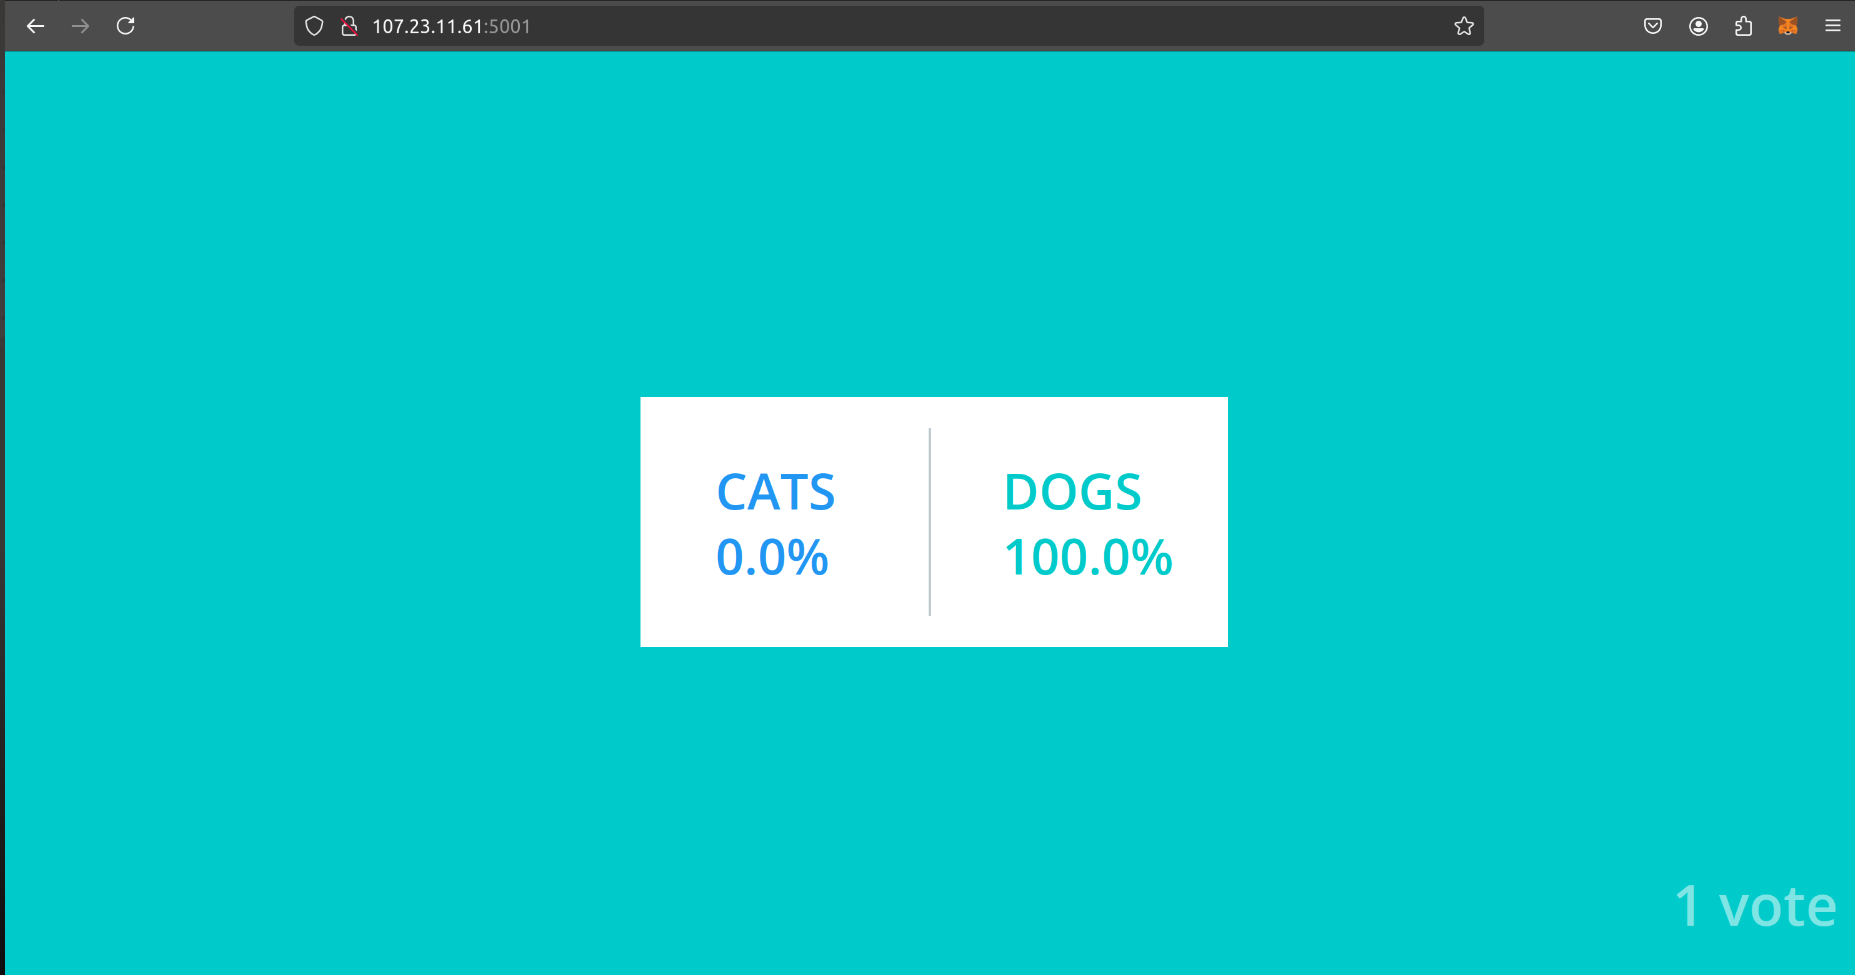
let’s integrate with helm and Prometheus and grafana and deploy our deploying our application in k8’s dashboard :
curl -fsSL -o get_helm.sh https://raw.githubusercontent.com/helm/helm/main/scripts/get-helm-3
chmod 700 get_helm.sh
./get_helm.sh

helm repo add prometheus-community https://prometheus-community.github.io/helm-charts
helm repo add stable https://charts.helm.sh/stable
helm repo update
kubectl create namespace monitoring
helm install kind-prometheus prometheus-community/kube-prometheus-stack --namespace monitoring --set prometheus.service.nodePort=30000 --set prometheus.service.type=NodePort --set grafana.service.nodePort=31000 --set grafana.service.type=NodePort --set alertmanager.service.nodePort=32000 --set alertmanager.service.type=NodePort --set prometheus-node-exporter.service.nodePort=32001 --set prometheus-node-exporter.service.type=NodePort
kubectl get svc -n monitoring
kubectl get namespace
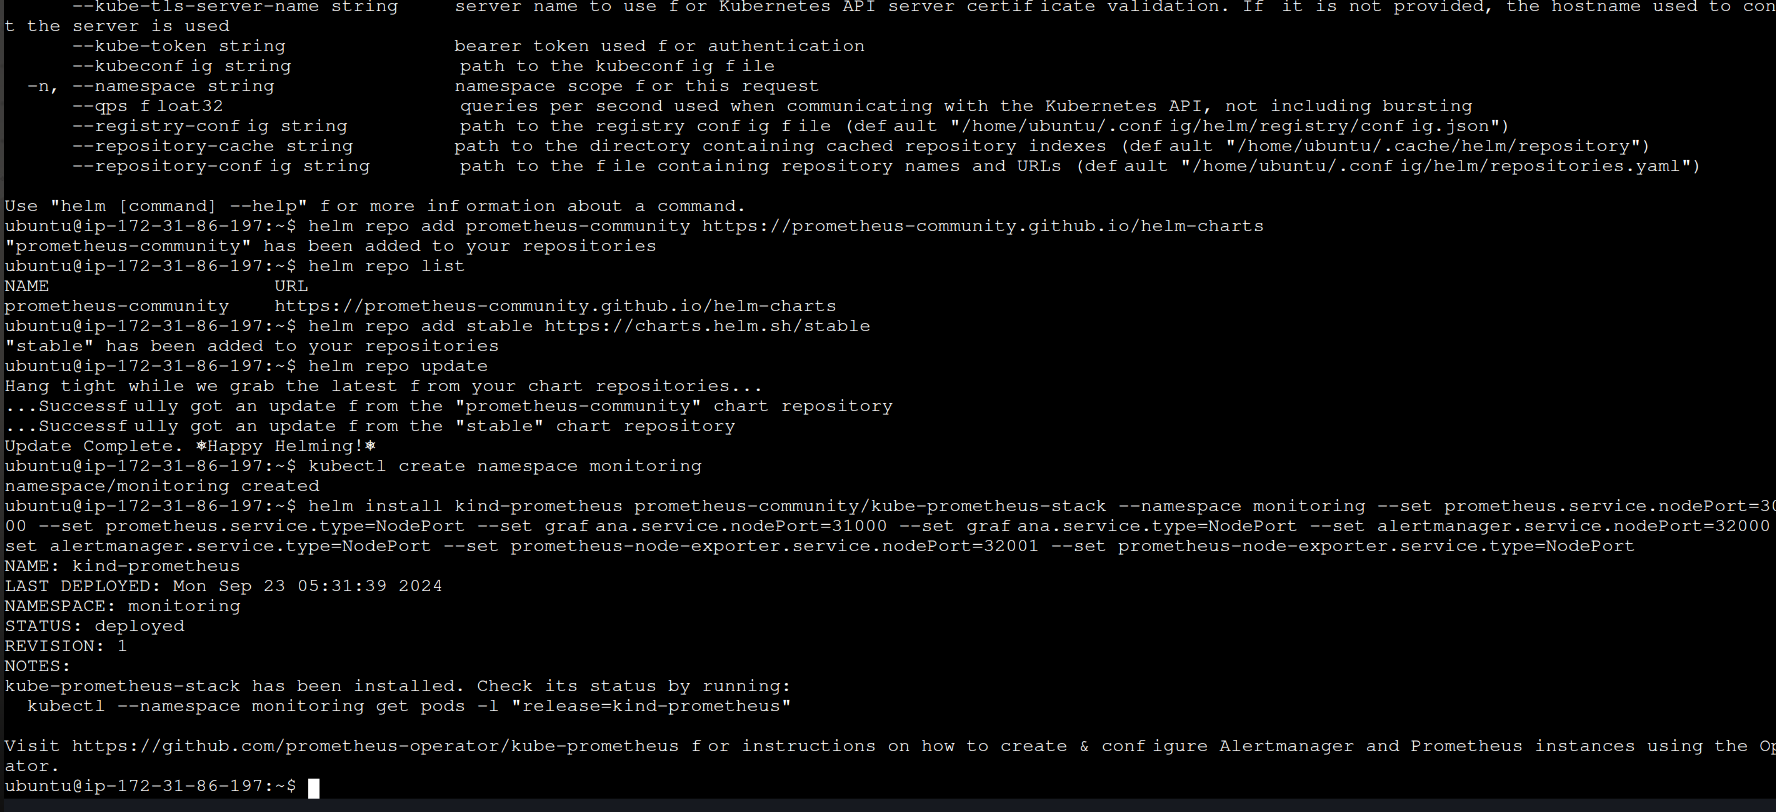

good to check all pods are running or not at the same time :

now let’s expose the Prometheus services and access it’s dashboard and grafana as well :
kubectl port-forward svc/kind-prometheus-kube-prome-prometheus -n monitoring 9090:9090 --address=0.0.0.0 &
kubectl port-forward svc/kind-prometheus-grafana -n monitoring 31000:80 --address=0.0.0.0 &
public_ip followed by port to access dashboard :


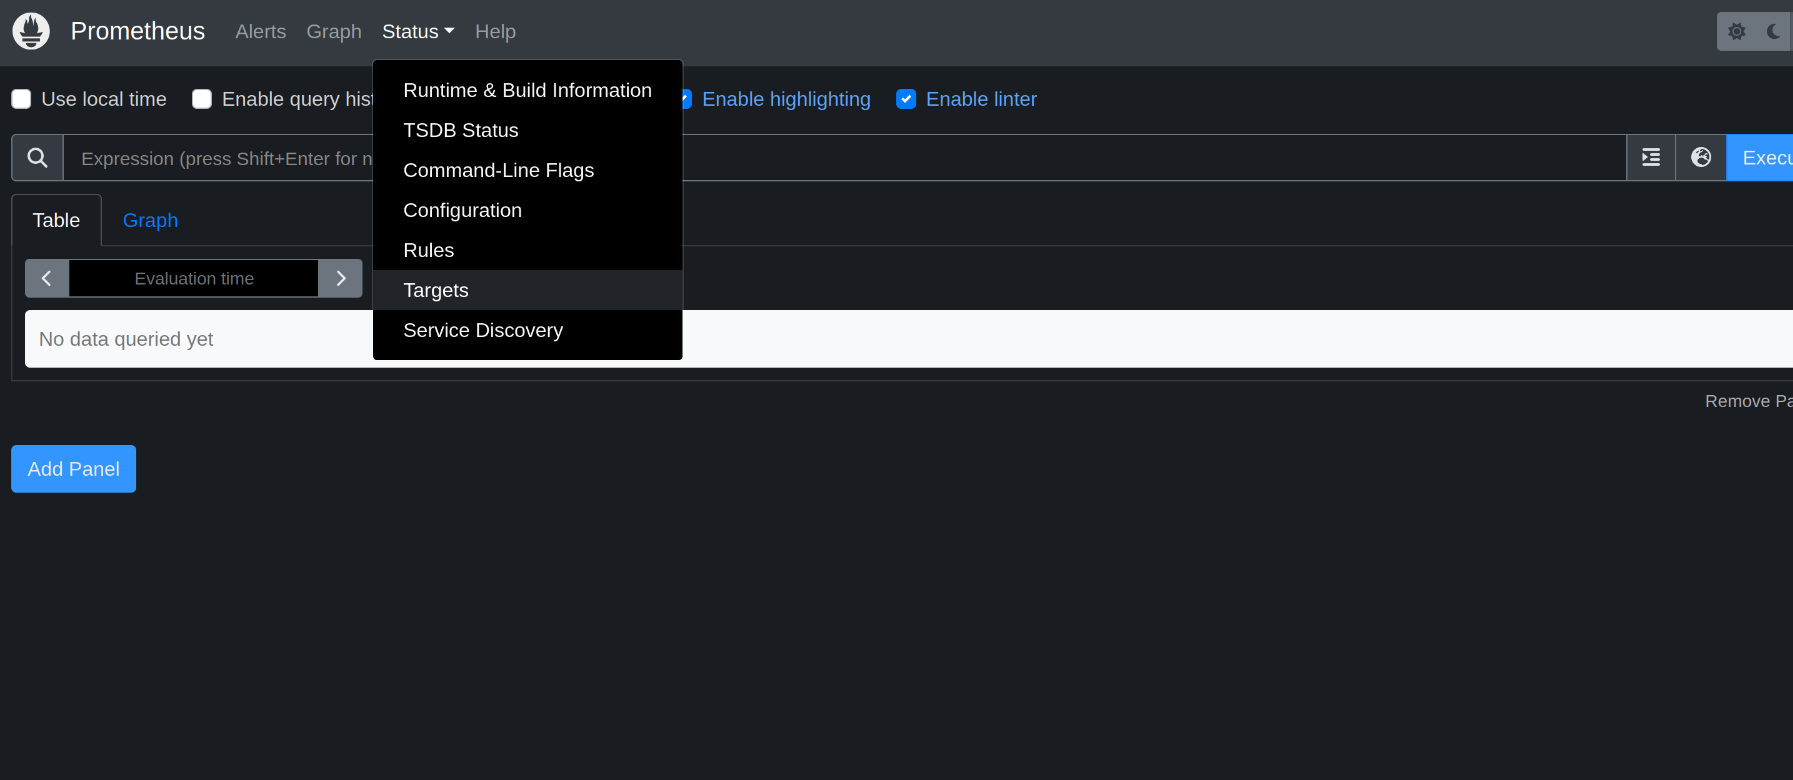
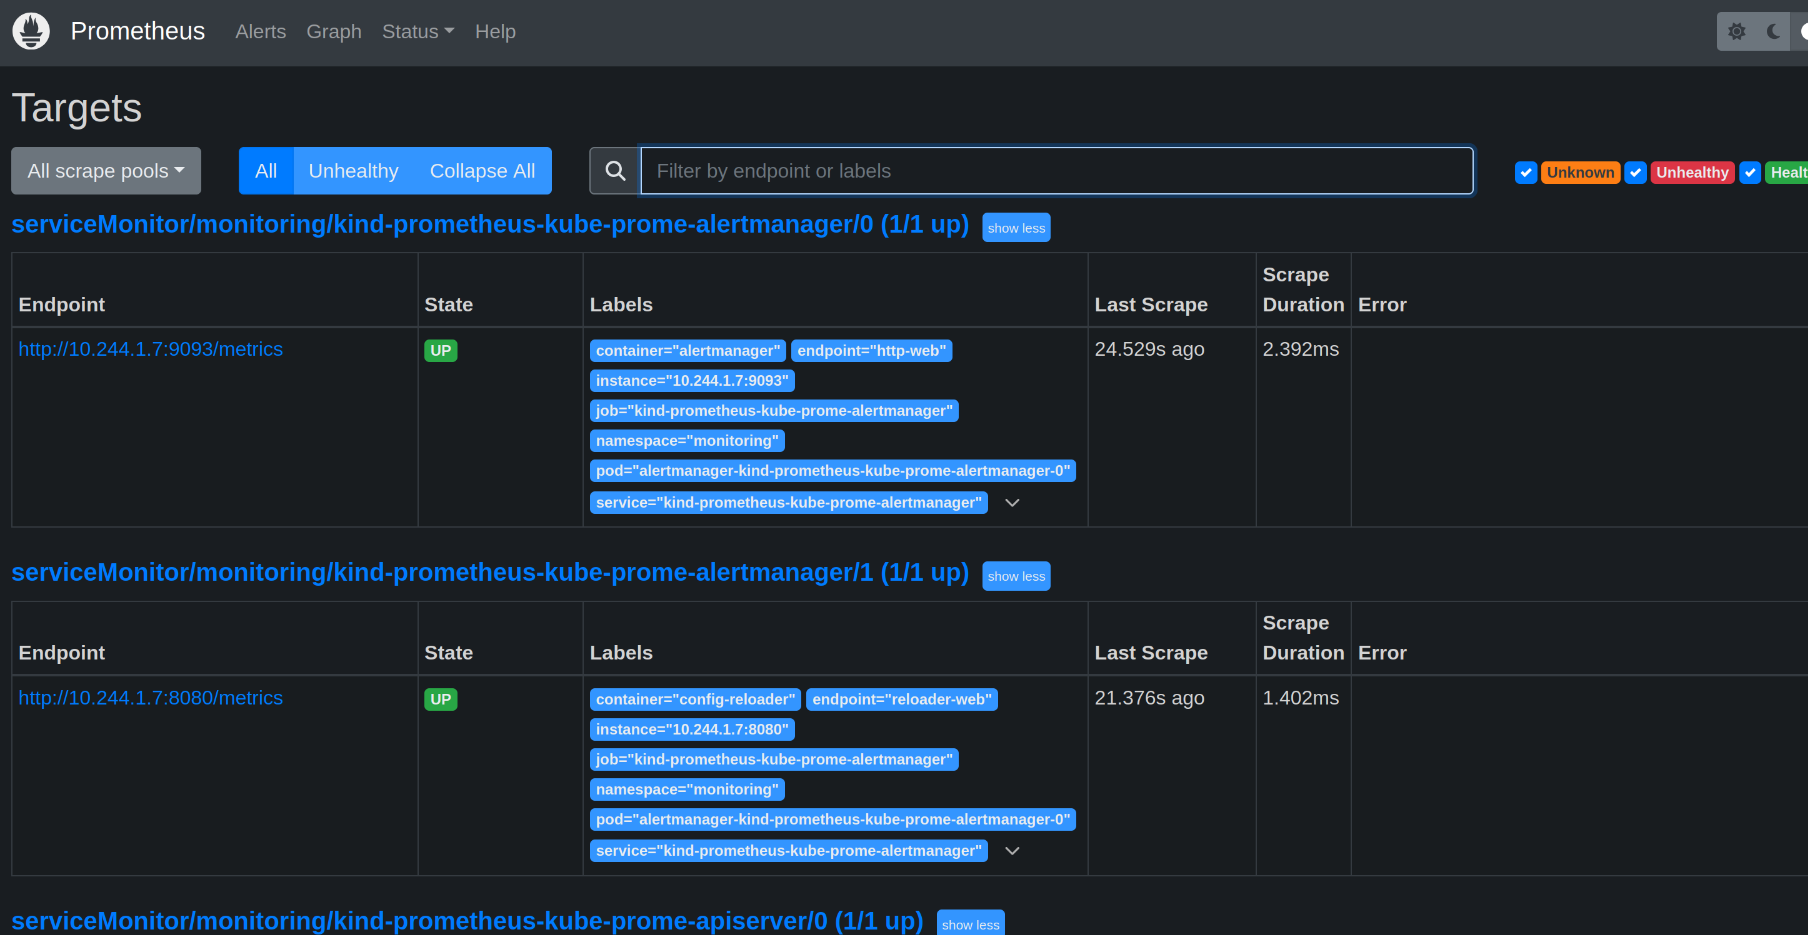
go to status » target » check endpoints and details as mentioned in the below picture :
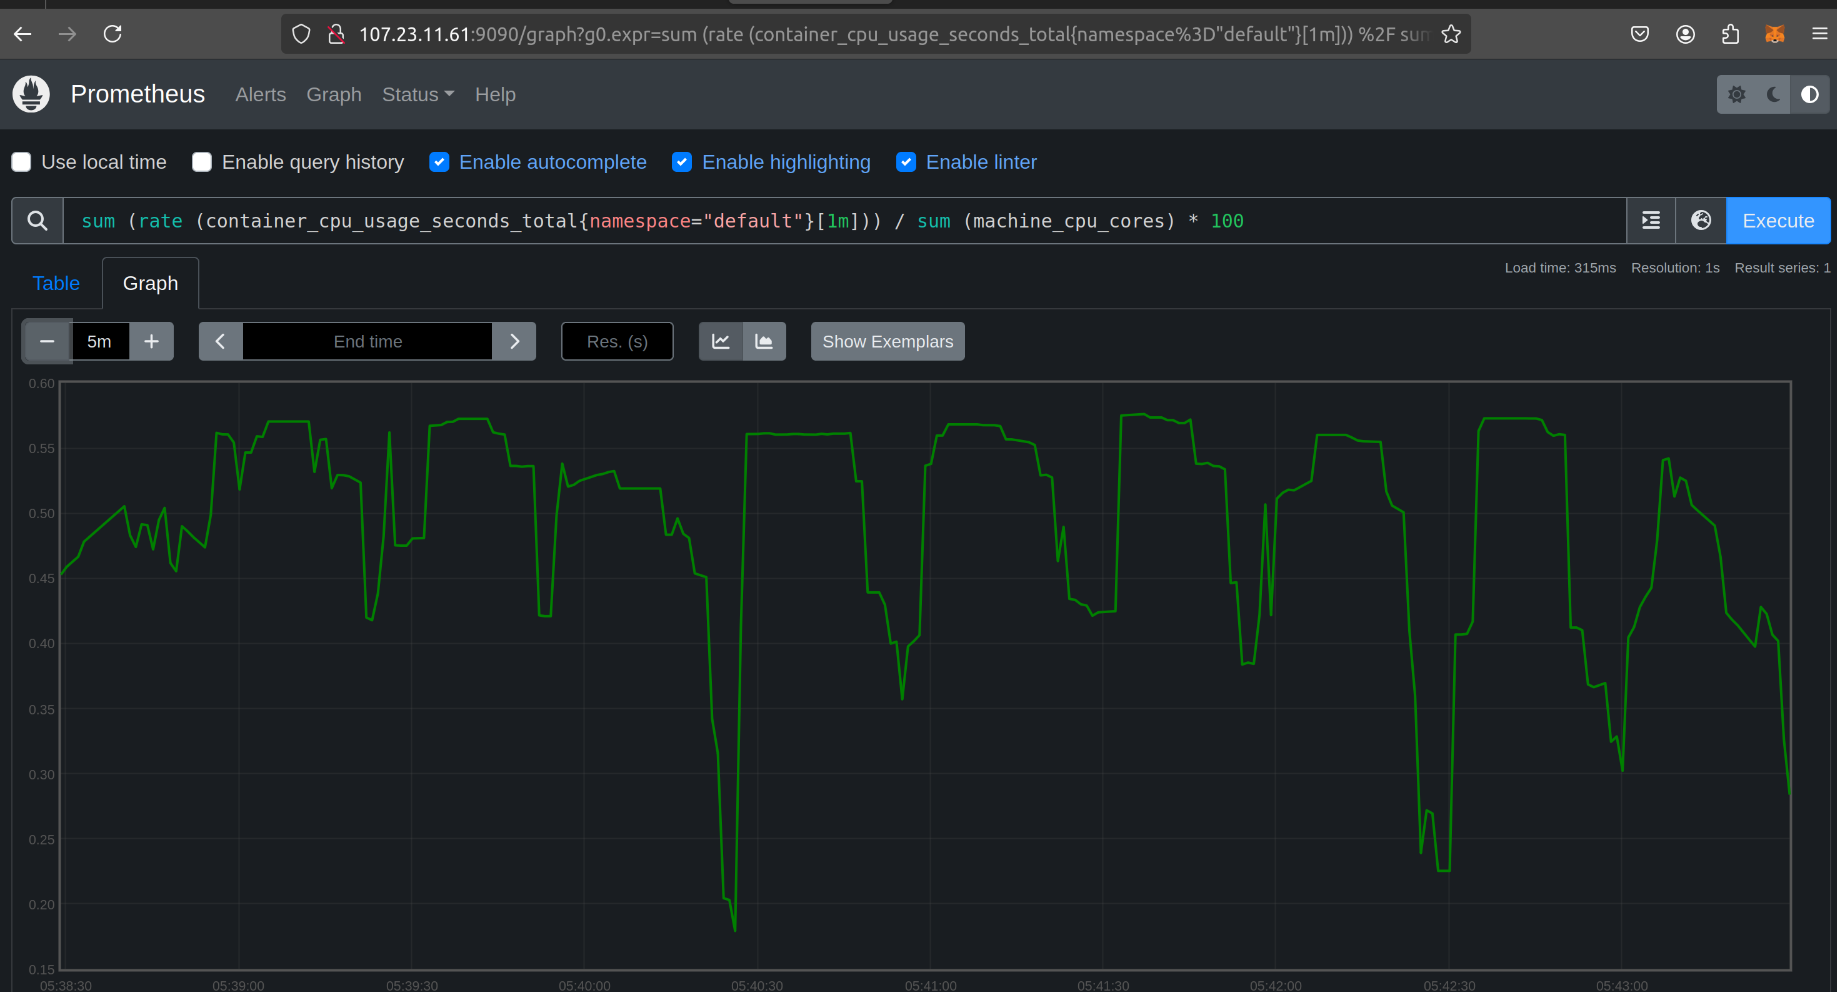
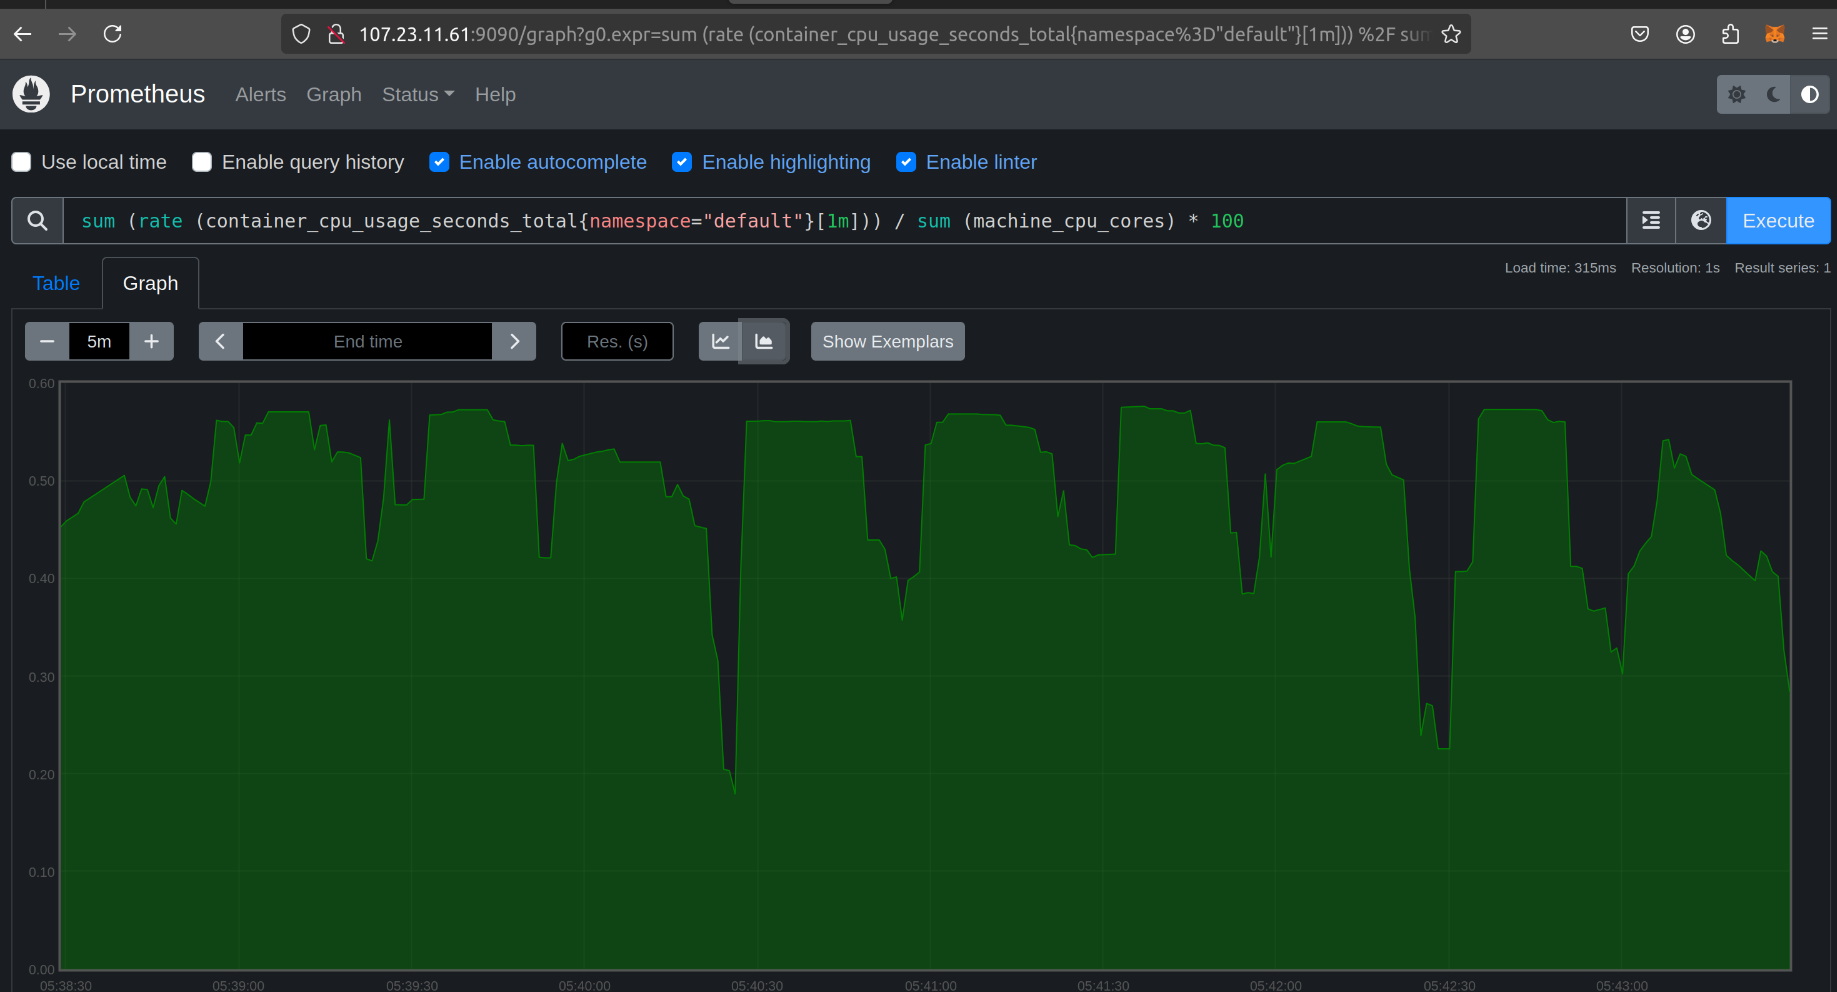
now as we have set our infra over this we will be testing some of the RUNQL to check our usage and details :
commands to check :
sum (rate (container_cpu_usage_seconds_total{namespace="default"}[1m])) / sum (machine_cpu_cores) * 100

sum (container_memory_usage_bytes{namespace="default"}) by (pod)


sum(rate(container_network_receive_bytes_total{namespace="default"}[5m])) by (pod)
sum(rate(container_network_transmit_bytes_total{namespace="default"}[5m])) by (pod)
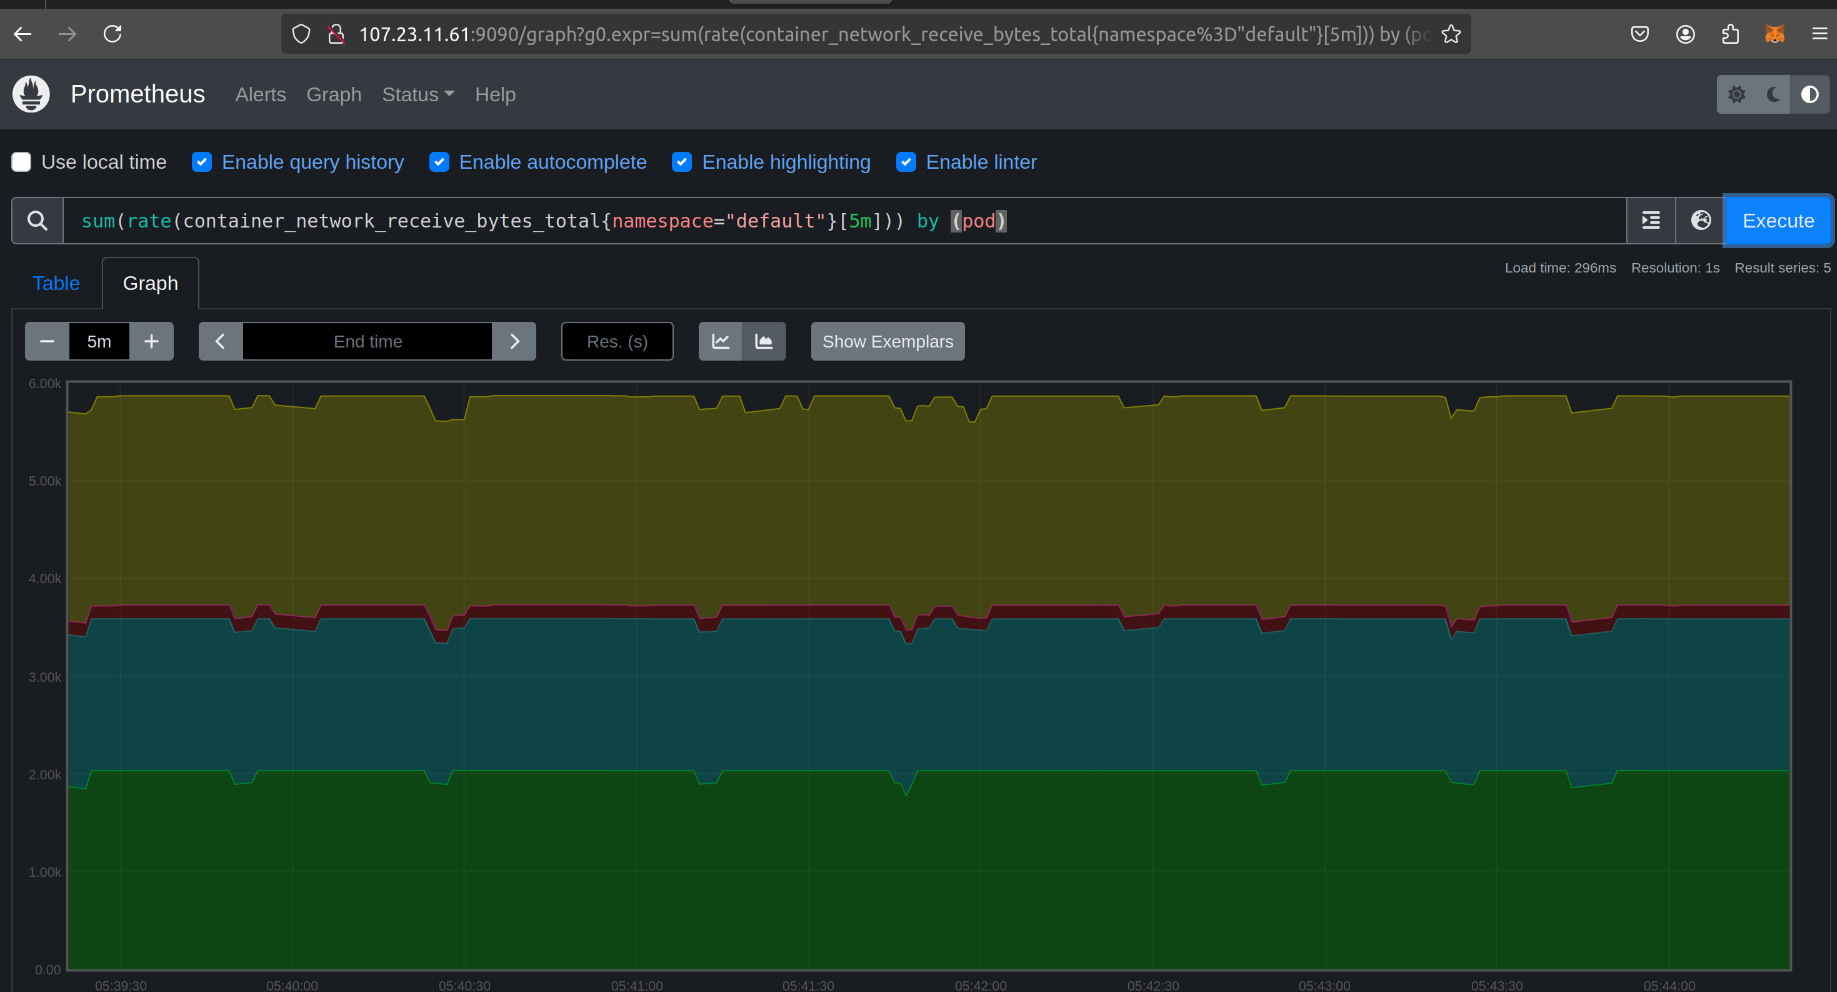
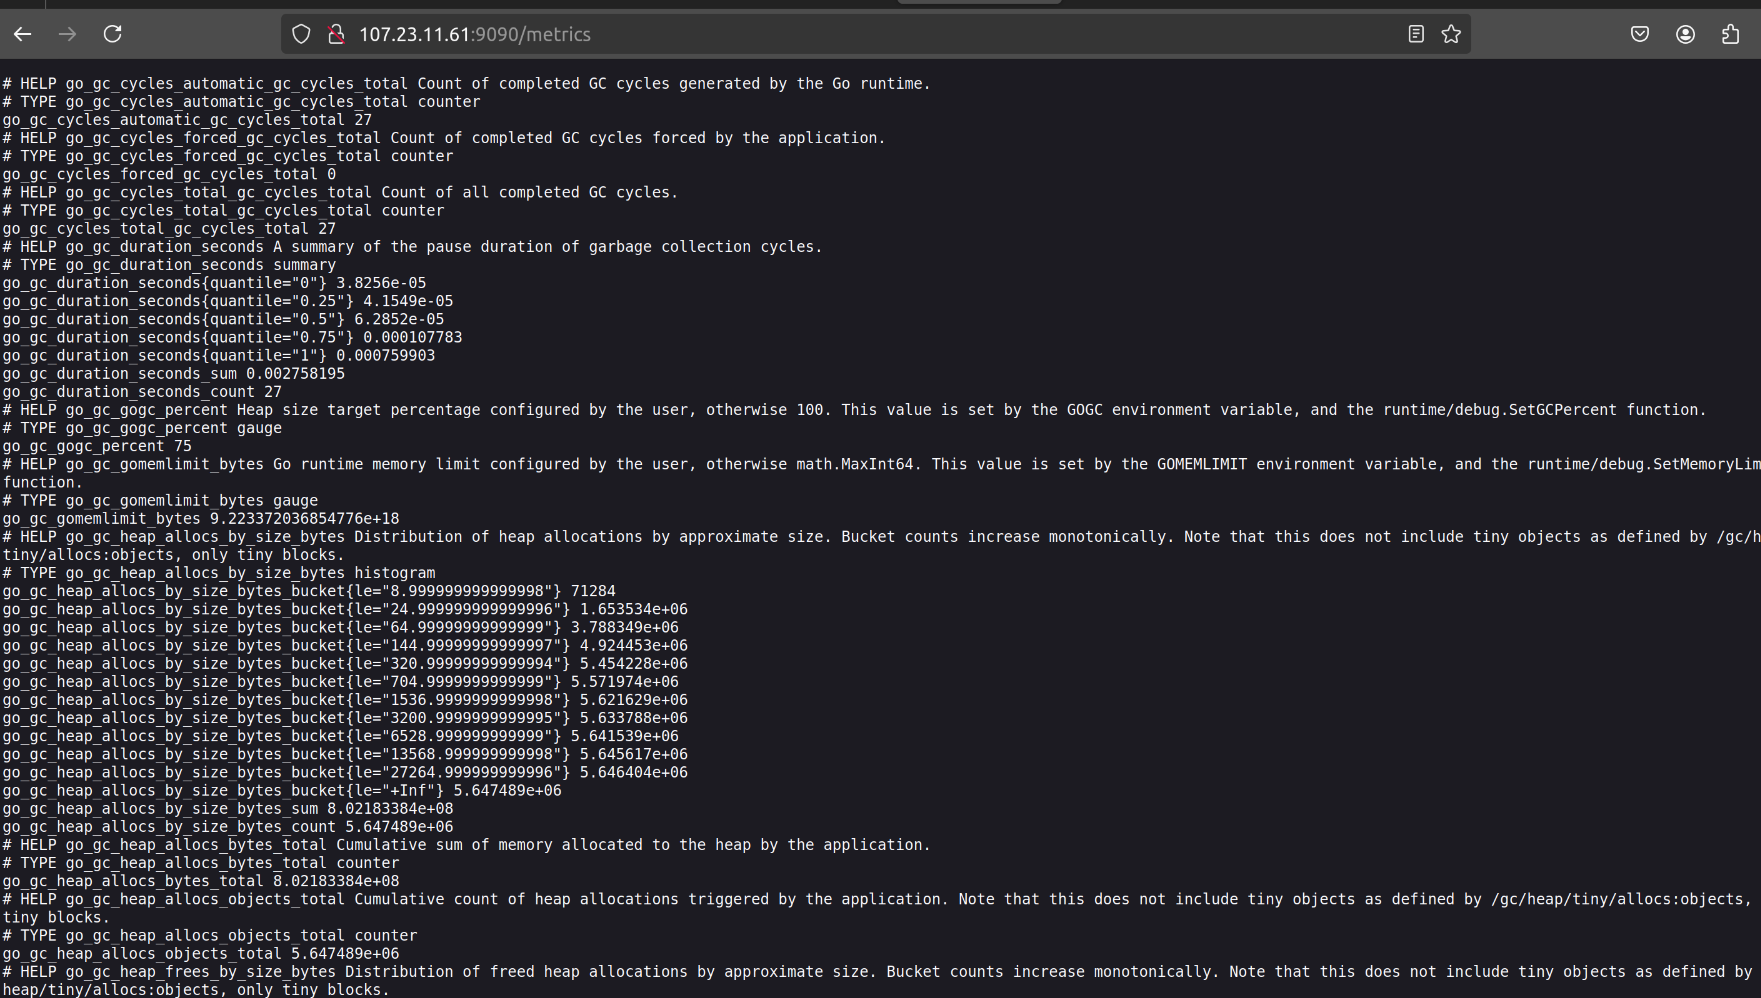
for Prometheus matrices we can check public_ip/matrics:
for grafana :

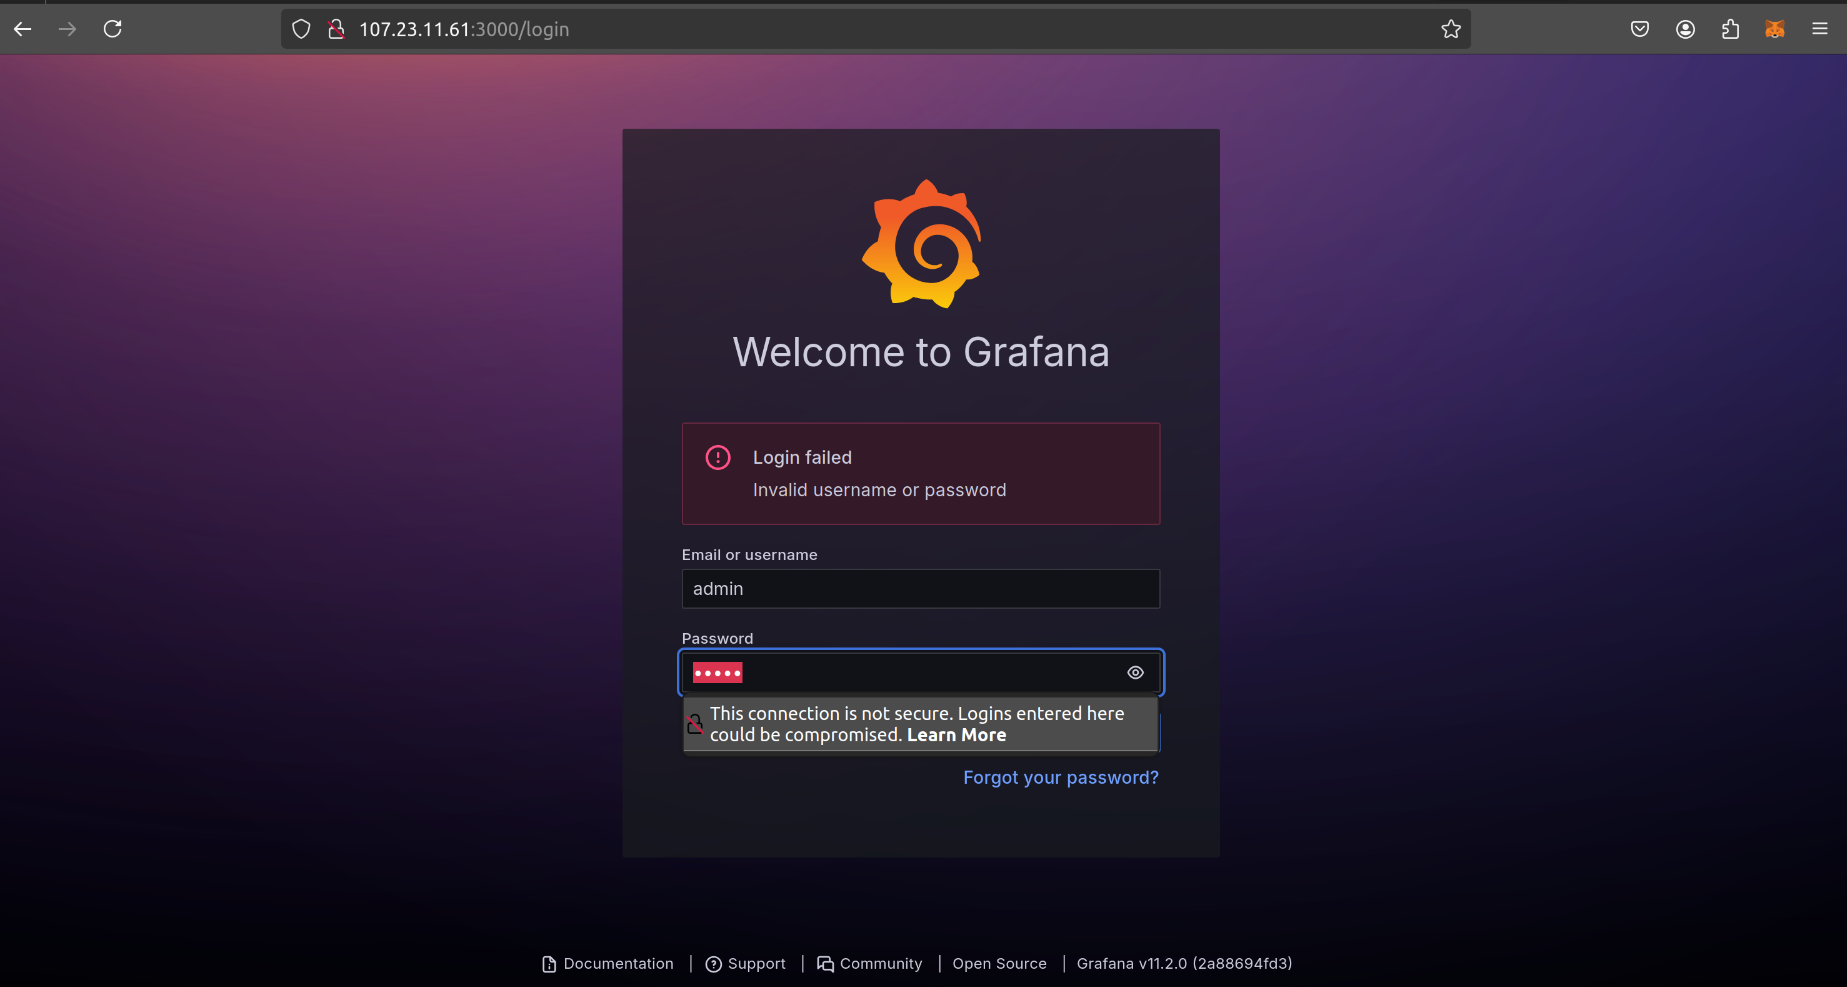
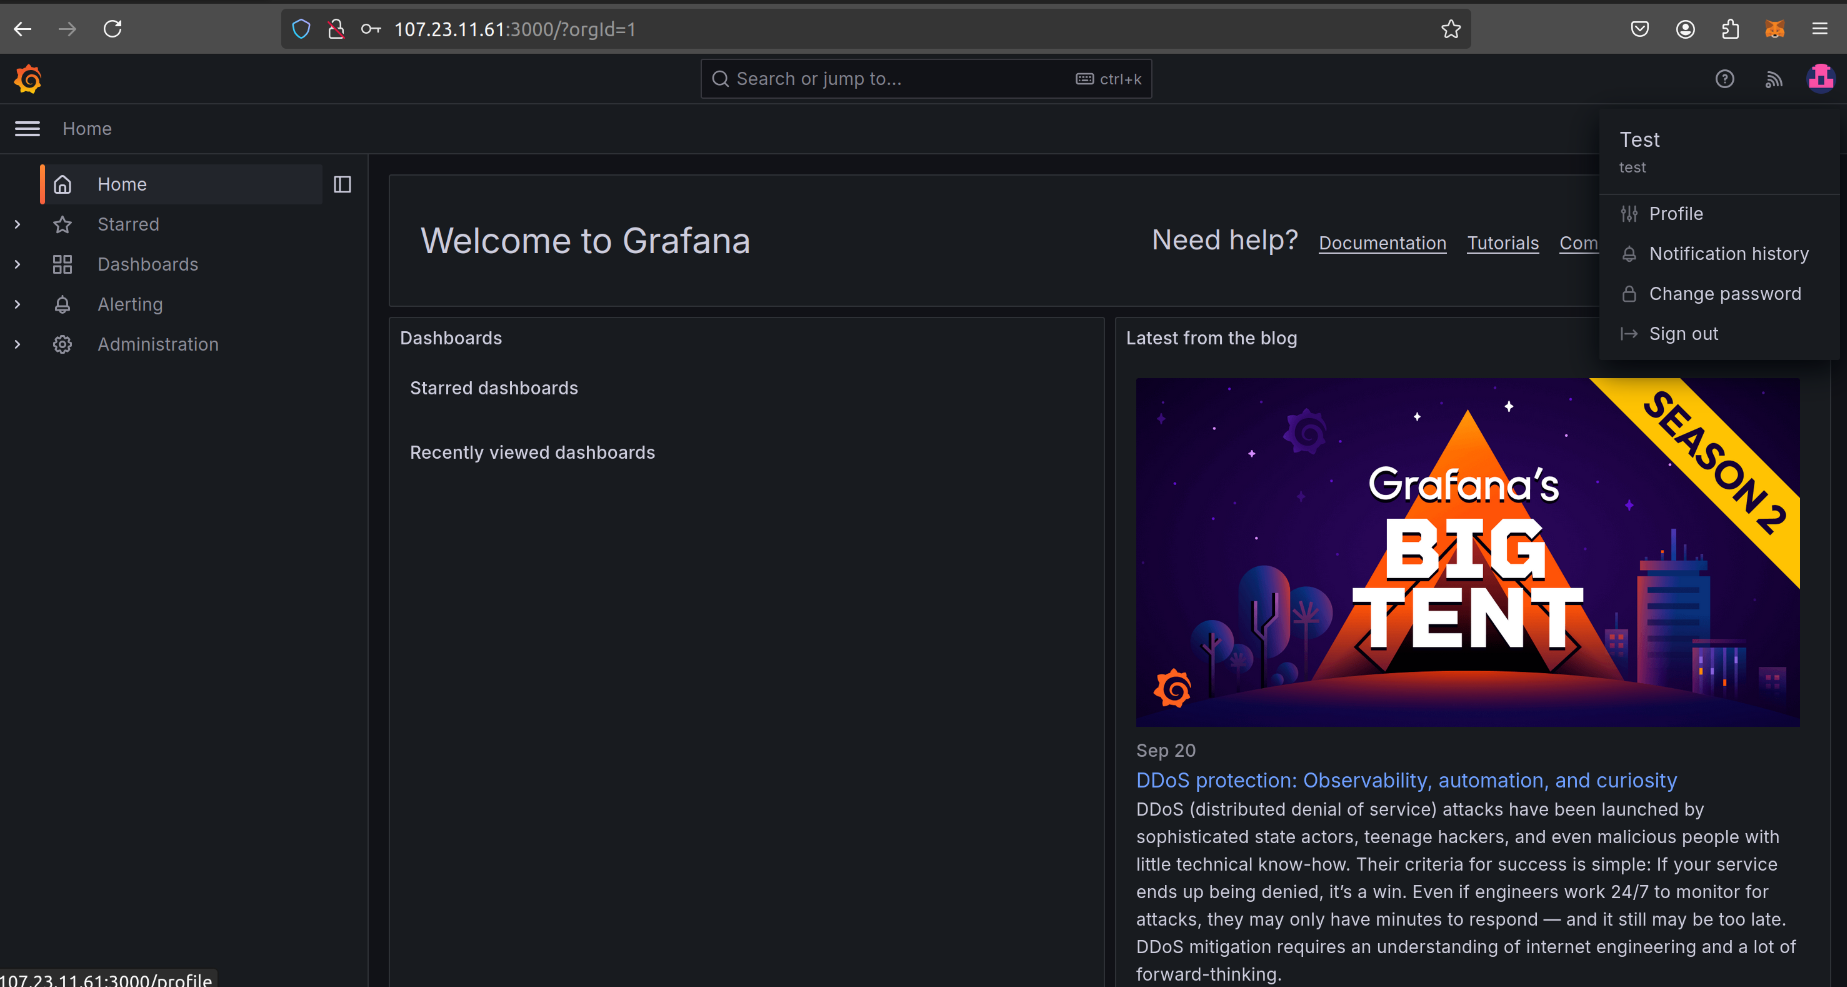
we need to import data from Prometheus: connections » data source » prometheus
add your queries , matrics and details and add all in the dashboard :
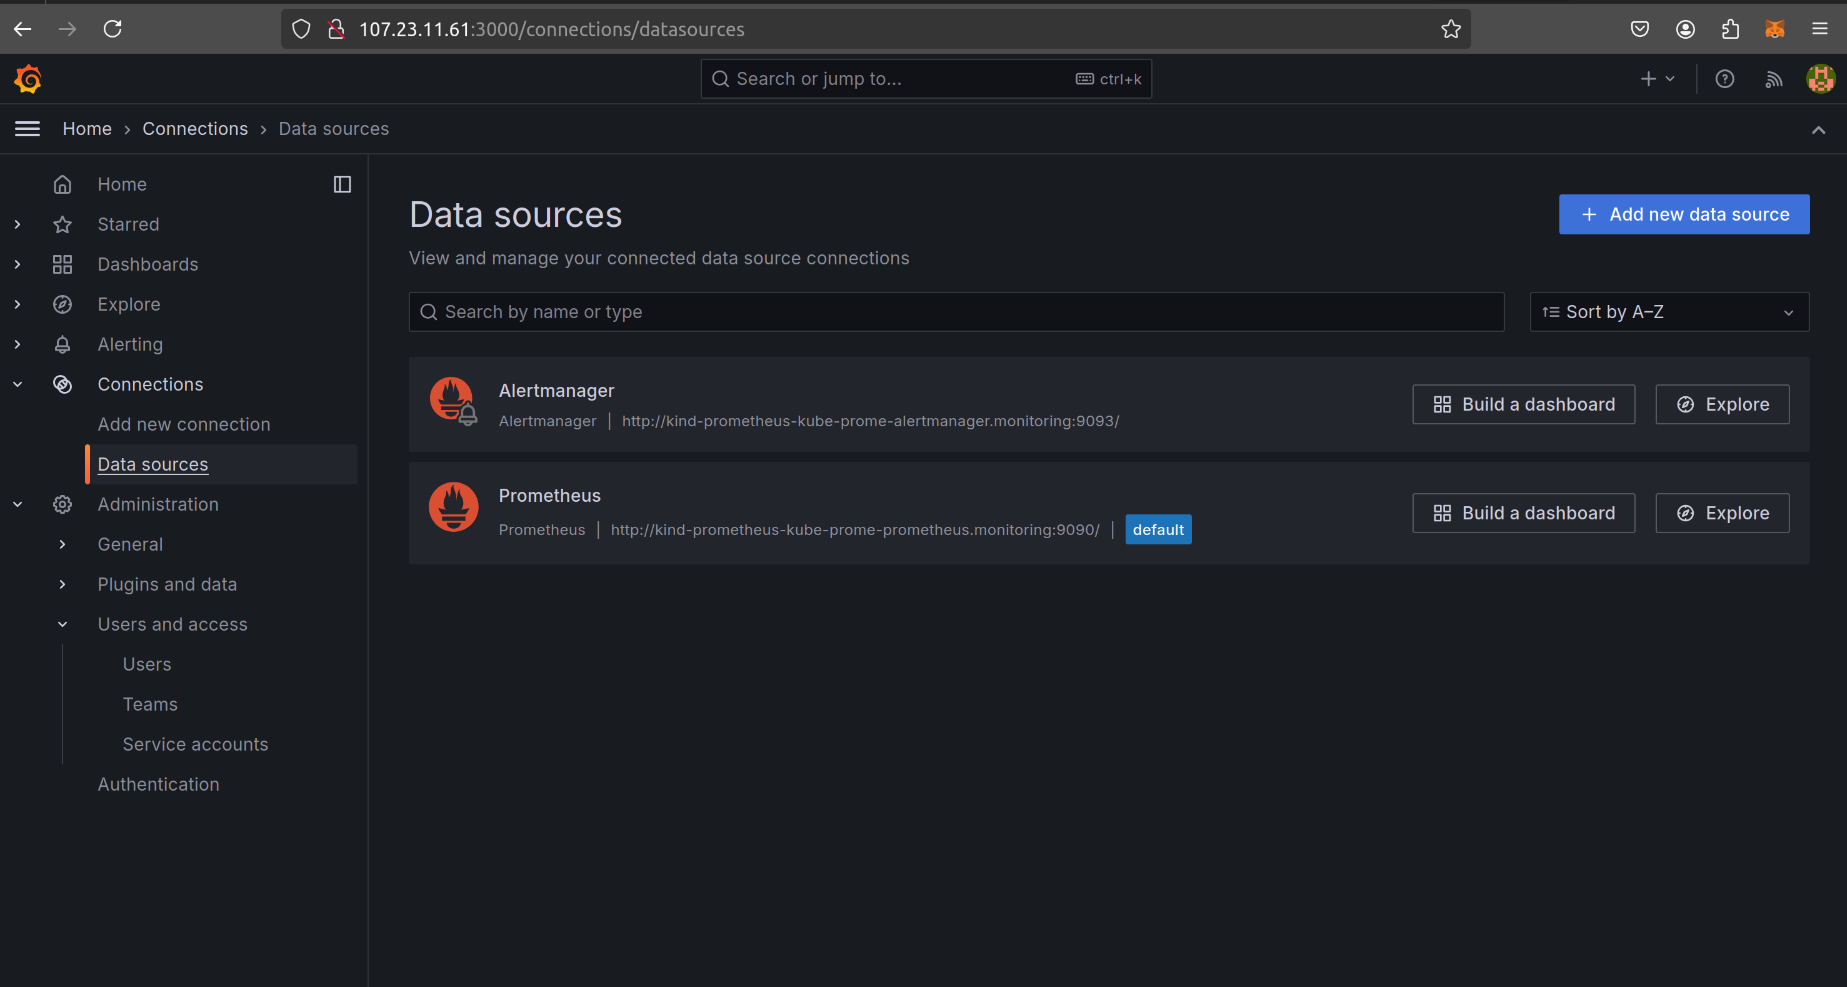
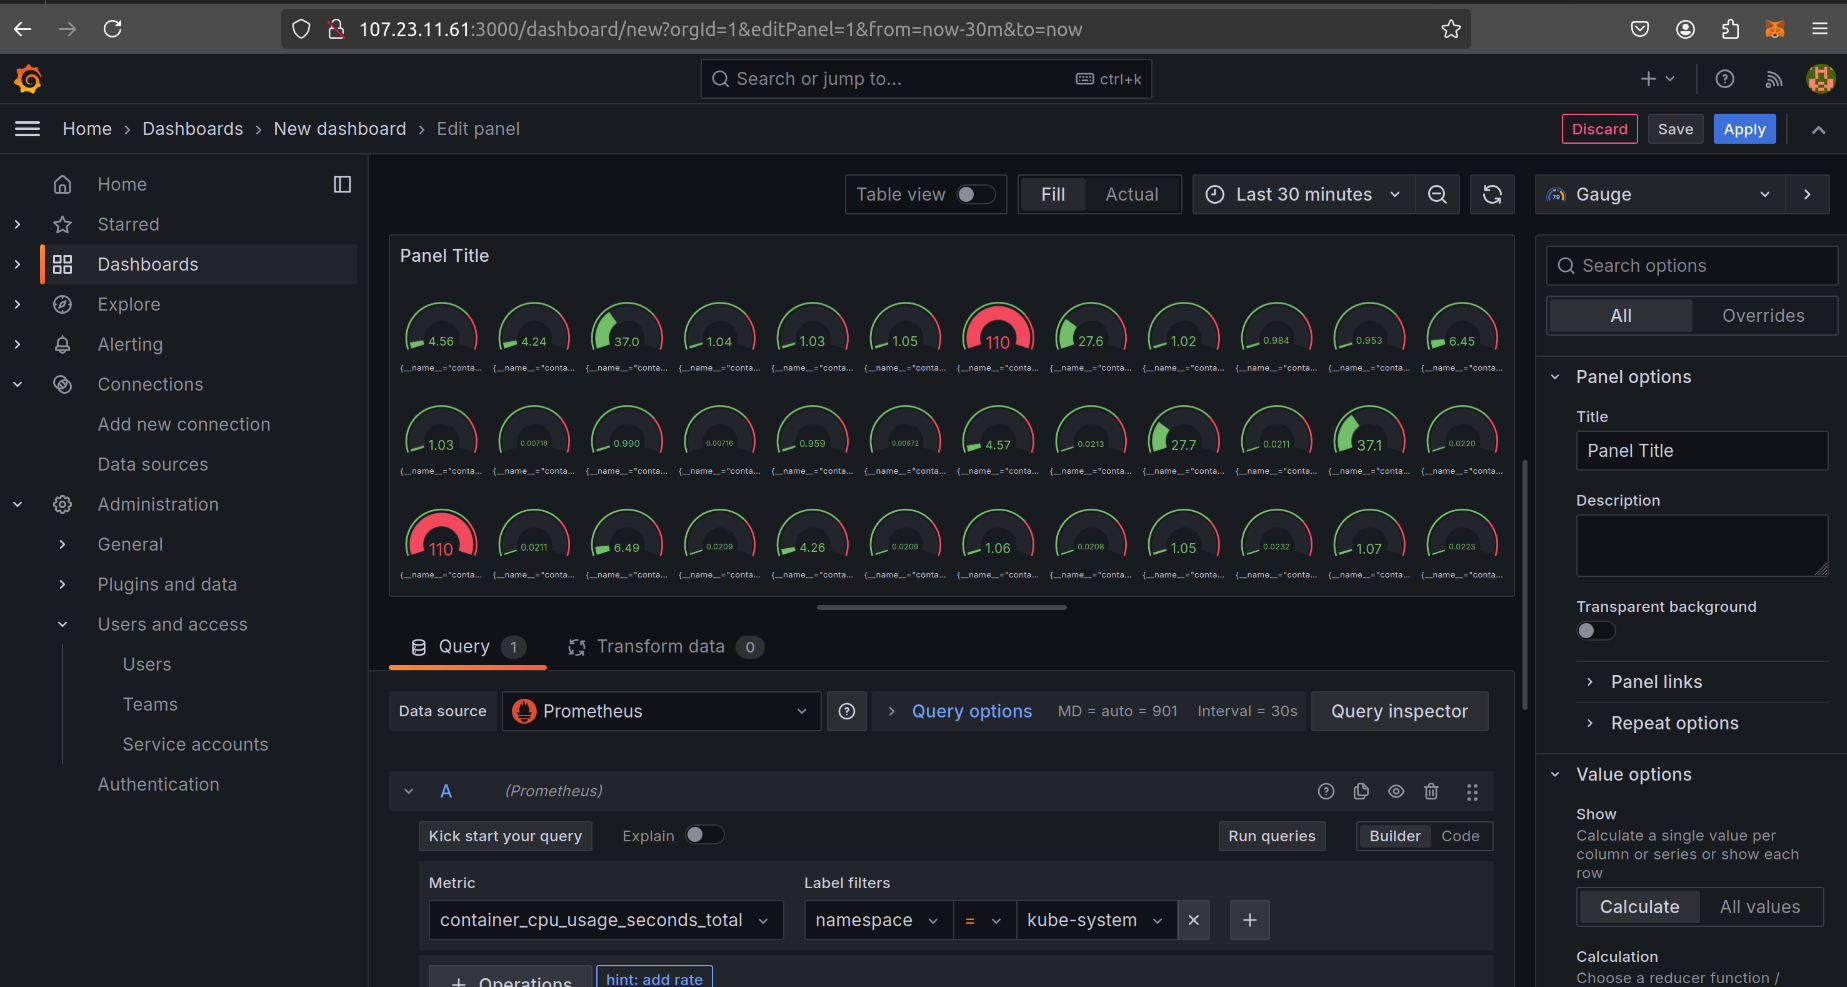
similarly you can import your Kubernetes dashboard by searching Kubernetes dashboard for grafana as well :
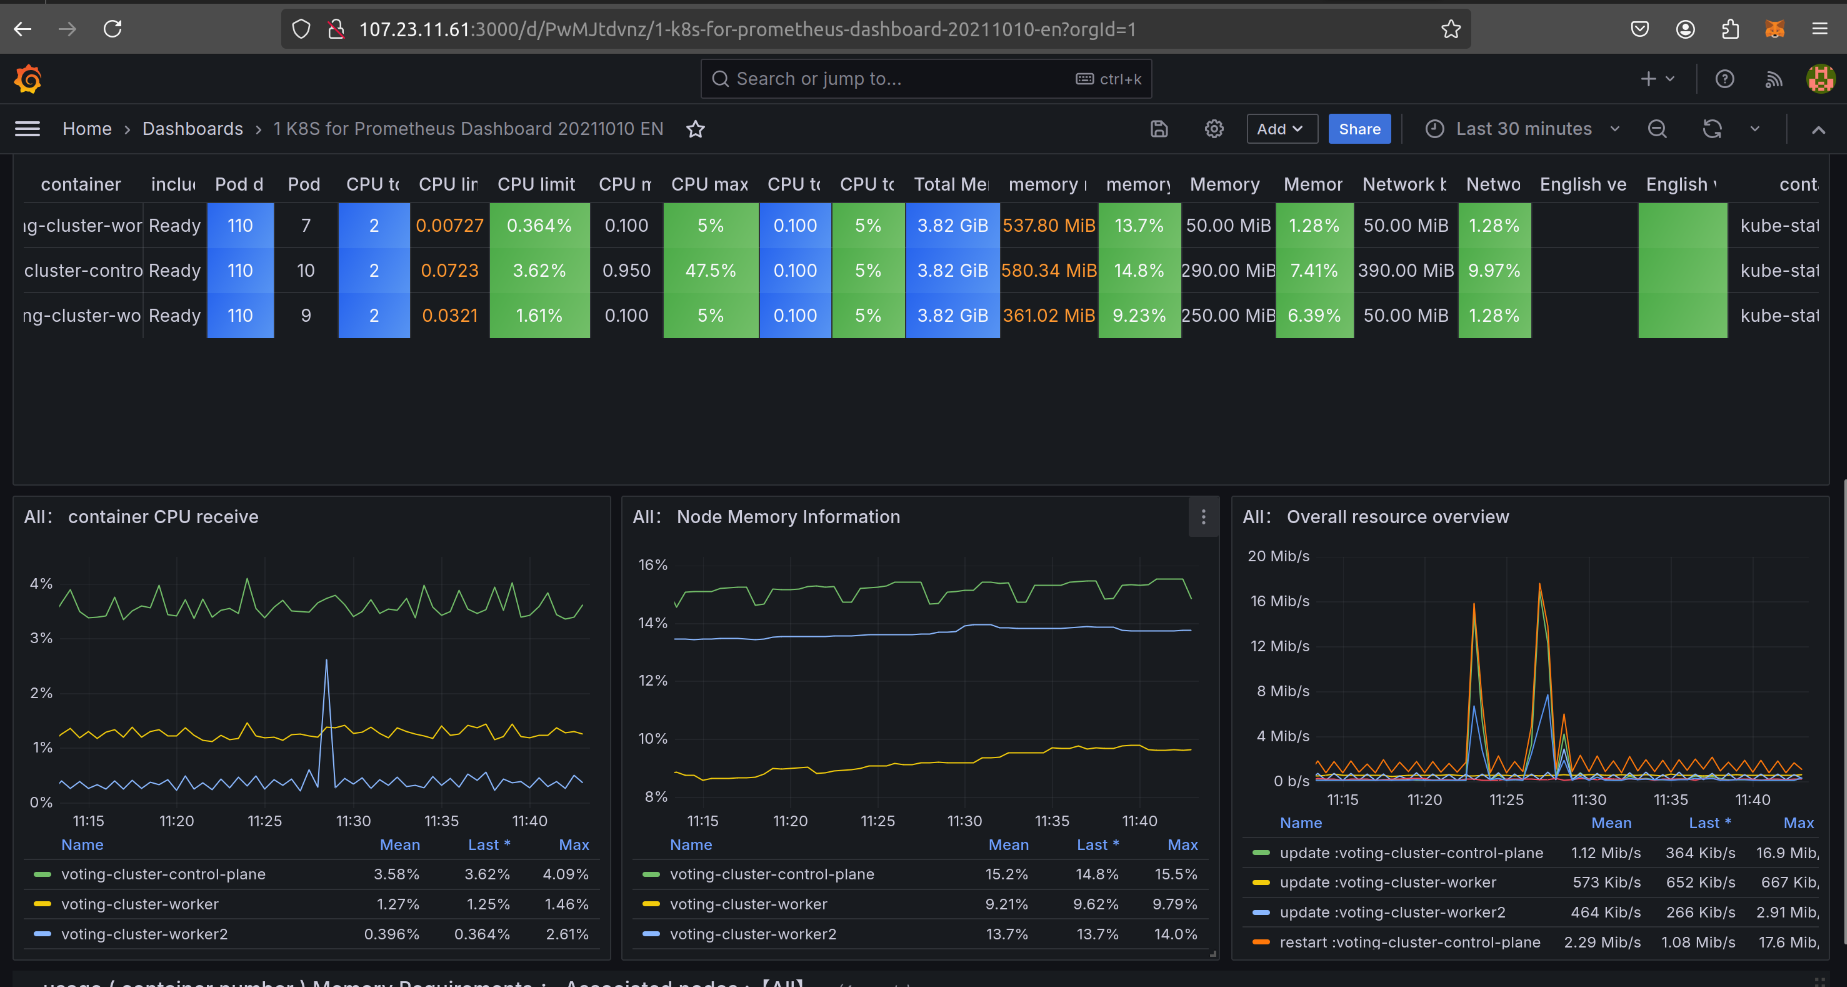
here in this dashboard i have added most of the matrics and details .
let’s deploy this on Kubernetes dashboard for that let’s apply the config file and create a token for rbac method :
k8s-kind-voting-app/kind-cluster/dashboard-adminuser.yml

apiVersion: v1
kind: ServiceAccount
metadata:
  name: admin-user
  namespace: kubernetes-dashboard
---
apiVersion: rbac.authorization.k8s.io/v1
kind: ClusterRoleBinding
metadata:
  name: admin-user
roleRef:
  apiGroup: rbac.authorization.k8s.io
  kind: ClusterRole
  name: cluster-admin
subjects:
- kind: ServiceAccount
  name: admin-user
  namespace: kubernetes-dashboard

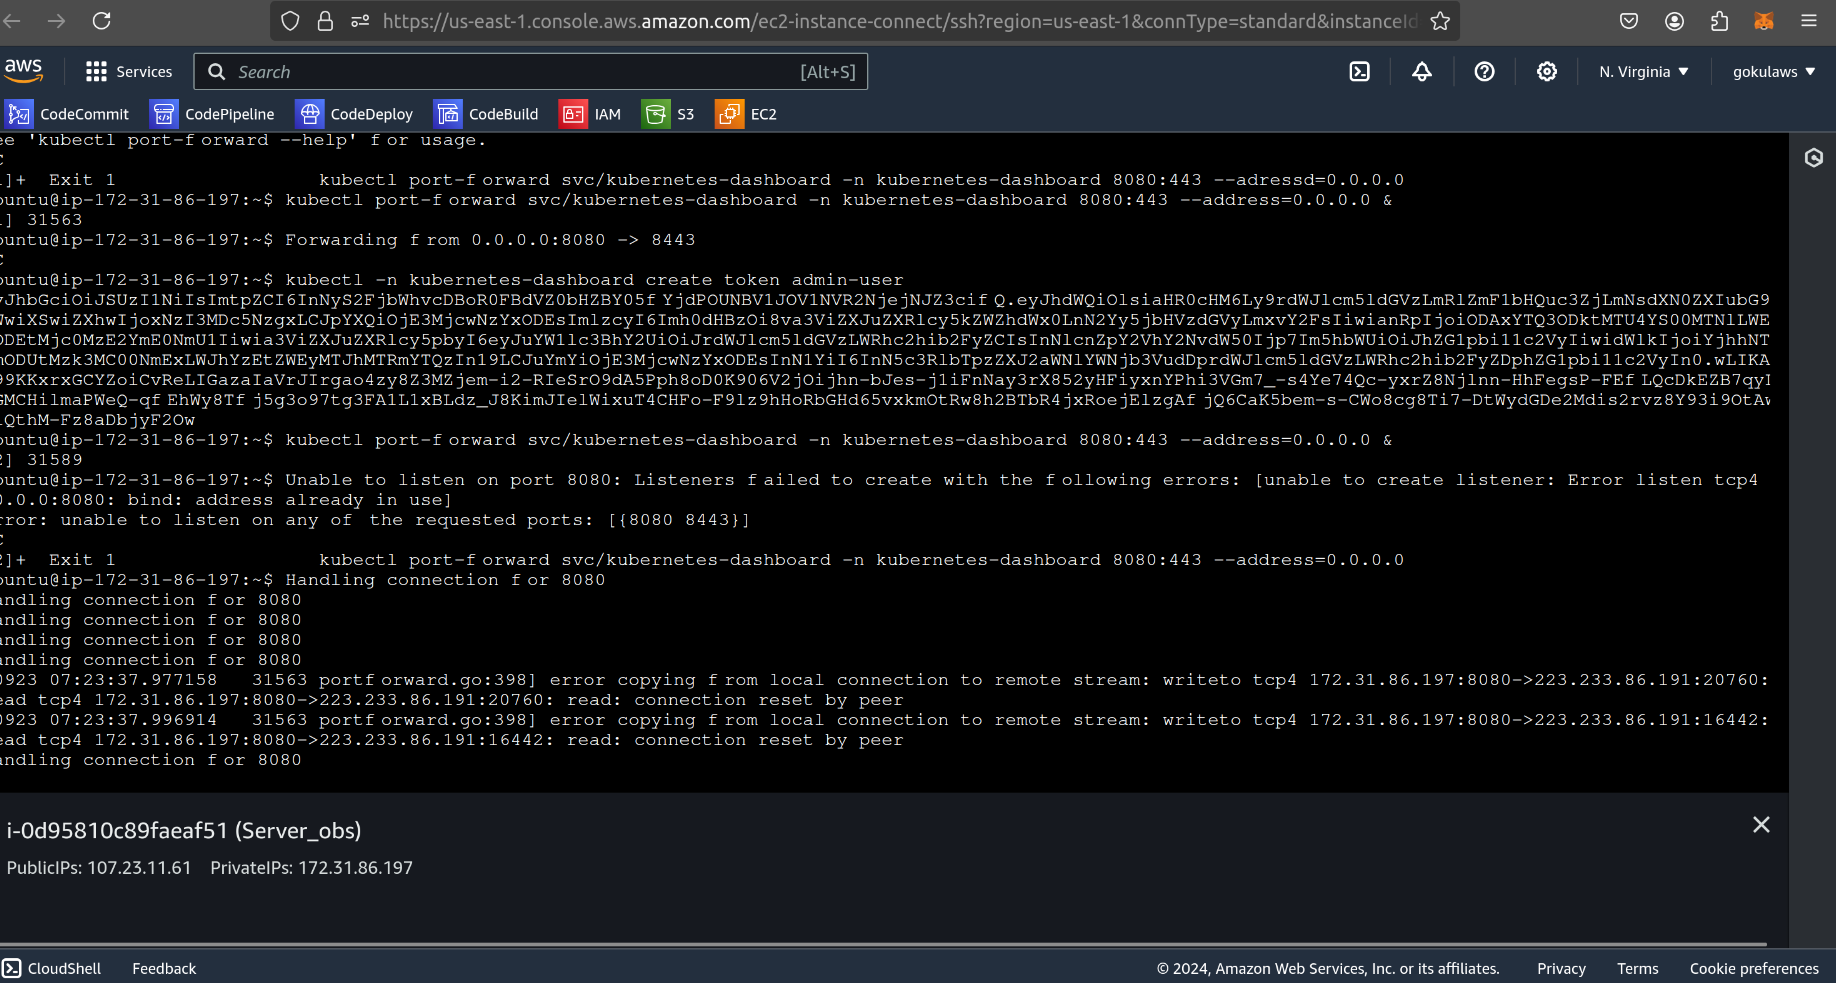
create a token and paste that to dashboard login :
kubectl -n kubernetes-dashboard create token admin-user

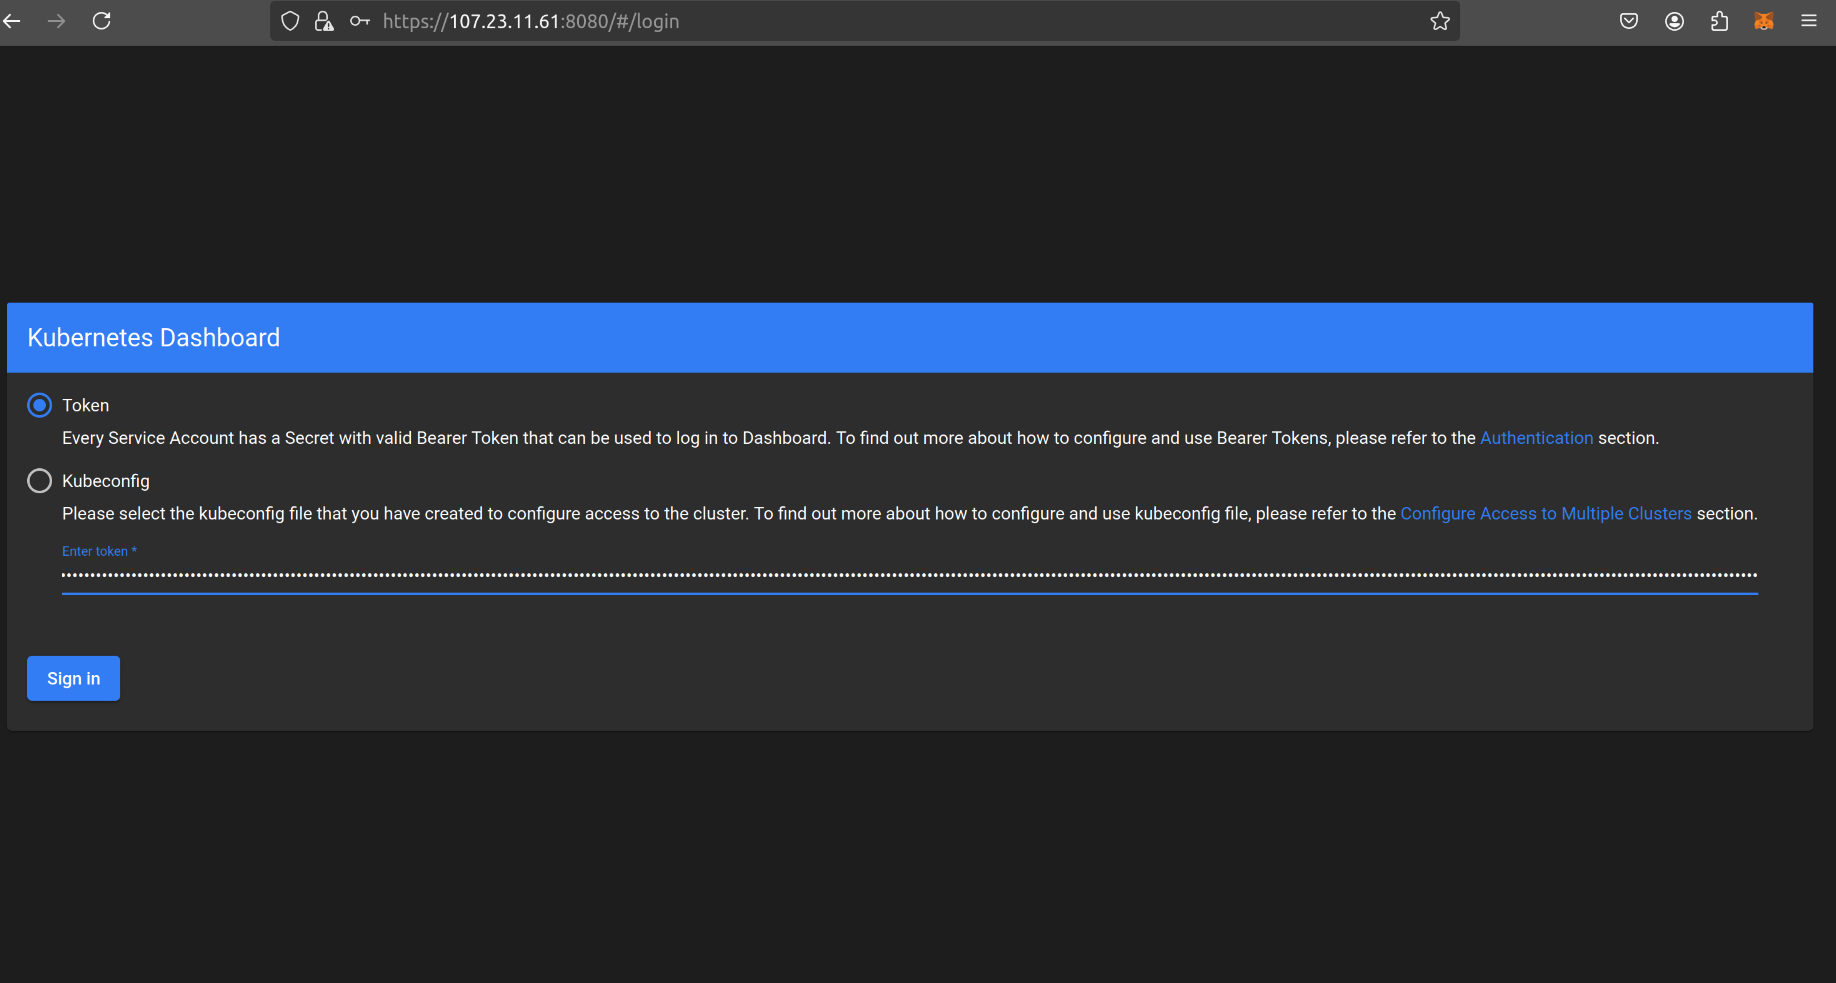
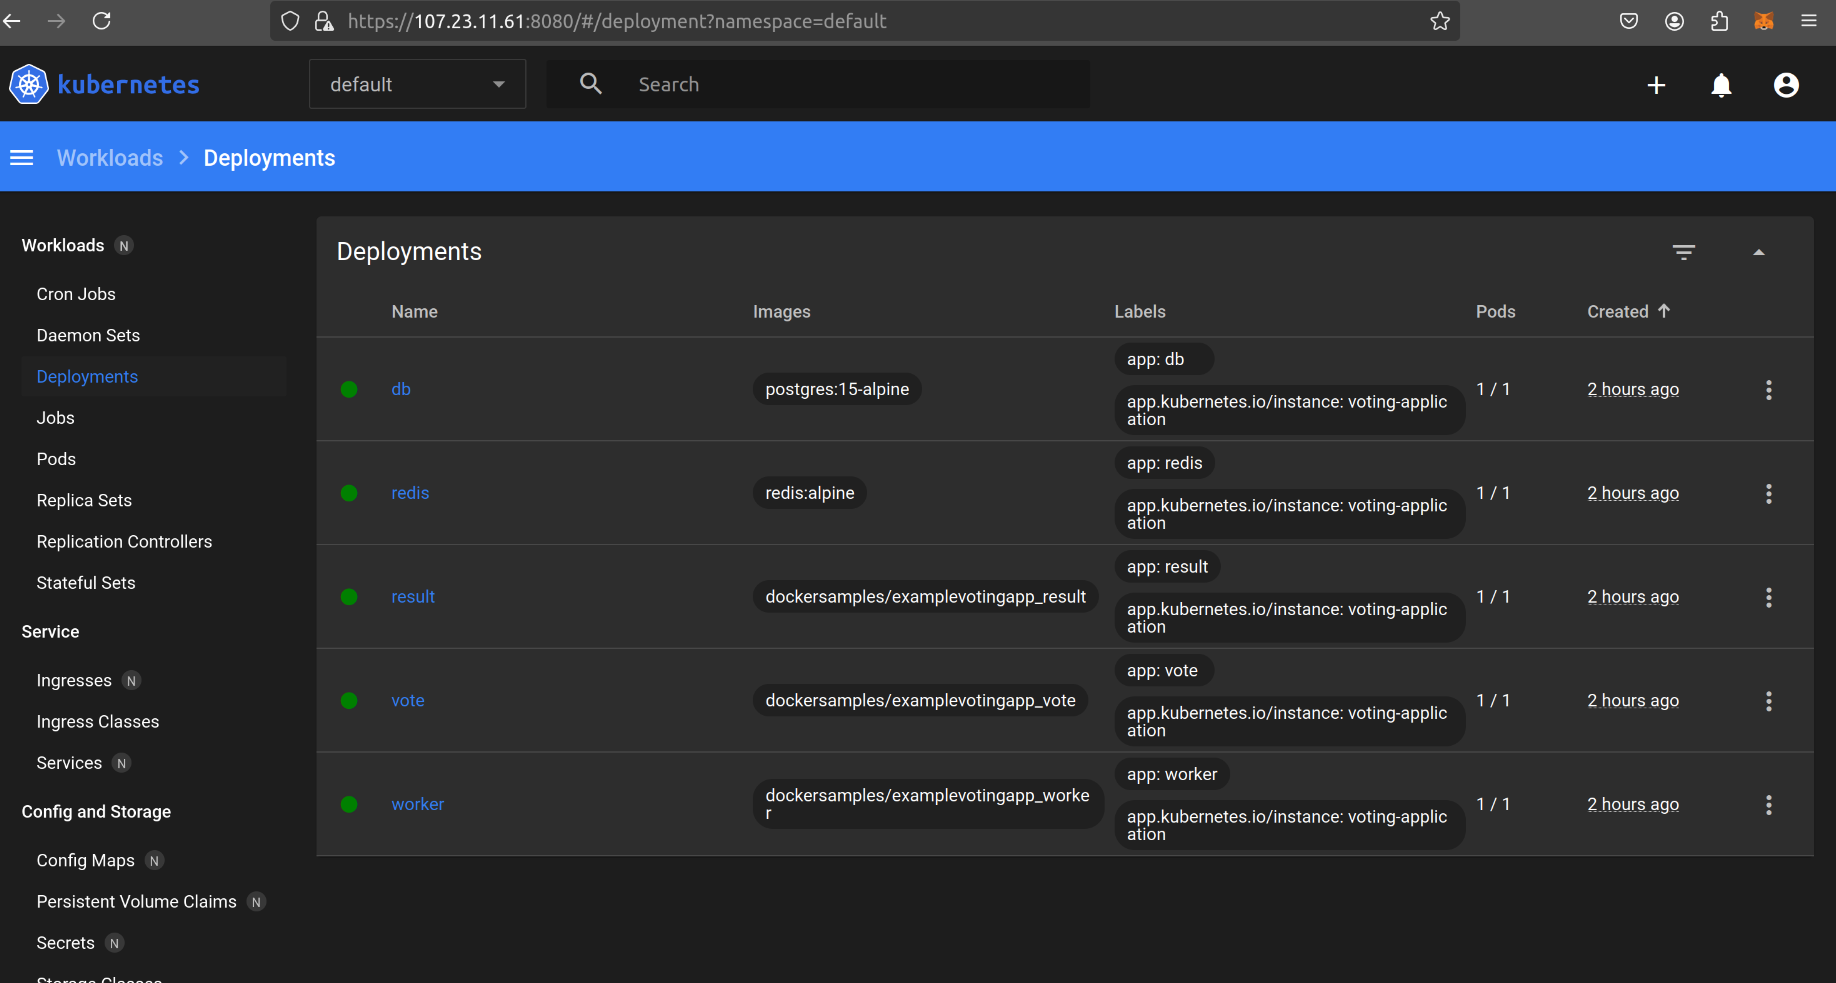
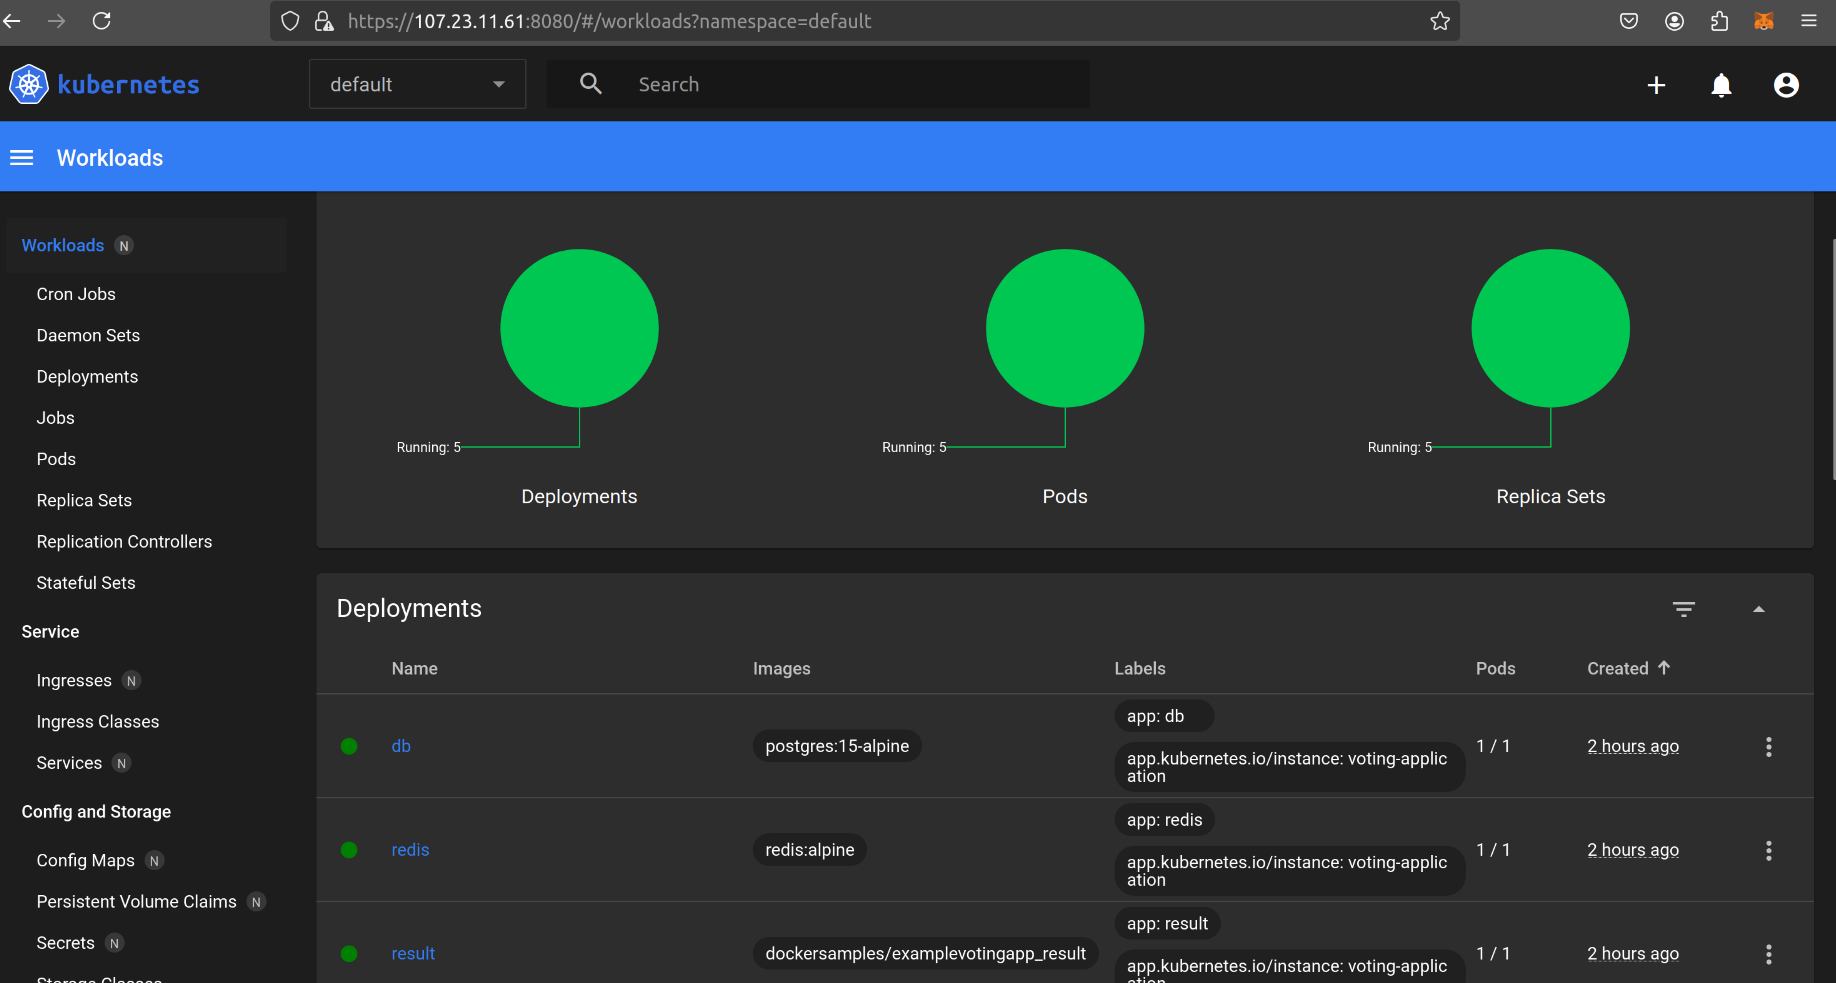
Subscribe to my newsletter
Read articles from PrithishG directly inside your inbox. Subscribe to the newsletter, and don't miss out.
Written by
