Analyzing Customer Retention: Dashboard Insights and Data-Driven Recommendations
 Ogunmesi Tobiloba
In today's competitive market, understanding customer retention is paramount for business success. The dashboards presented provide a detailed view of key factors impacting customer retention, ranging from service charges to churn rates. This analysis will explore the intricate process of how the dashboard data was compiled, the findings derived from these insights, and recommendations to enhance business strategies.
Dashboard Overview
The customer retention dashboard visualizes several key performance indicators (KPIs) across various customer touchpoints:
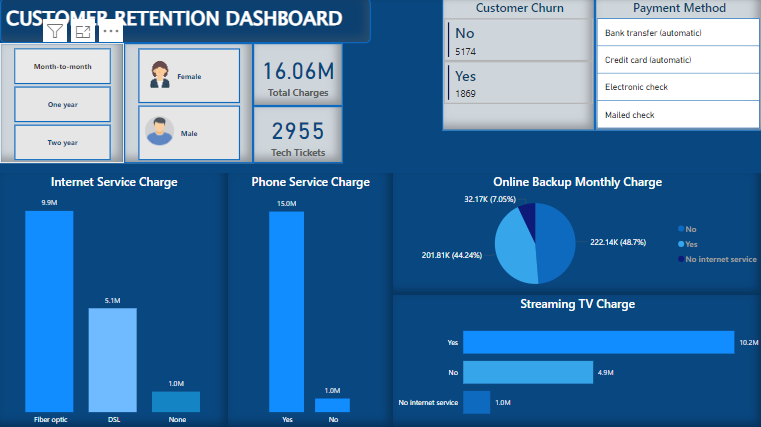
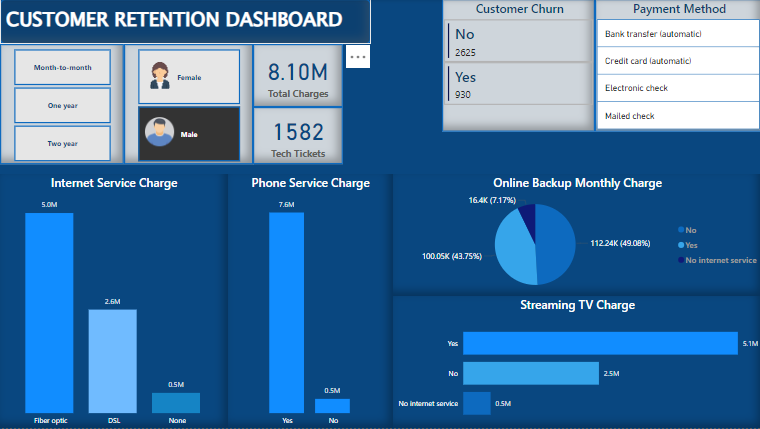
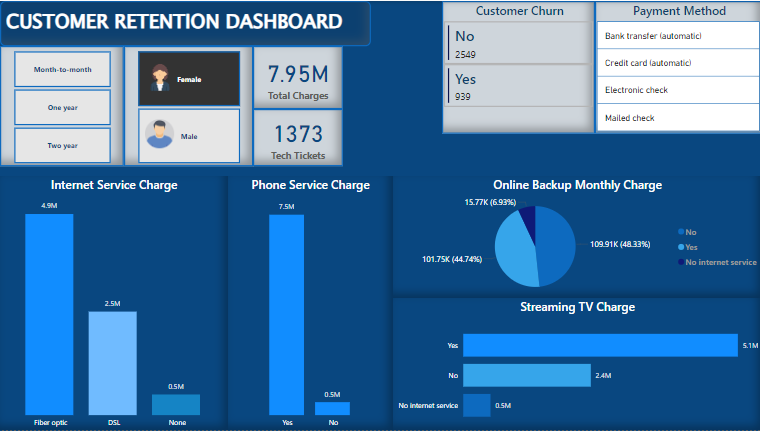
Total Charges: This metric shows the cumulative amount customers have been billed over time, segmented by male and female customers.
Tech Tickets: This KPI reflects the number of support or technical queries submitted by customers, which correlates with service satisfaction and potential churn.
Customer Churn: A critical metric indicating the number of customers who have left the service versus those who have remained.
Service Charges: These are broken down into Internet Service Charges (Fiber optic, DSL) and Phone Service Charges, providing a clear view of the distribution of customers across different service levels.
Backup and Streaming Charges: The monthly charges for online backups and streaming TV services are illustrated to understand the added value services customers opt for.
Payment Methods: The types of payment methods customers utilize provide insight into preferred transaction mechanisms, including bank transfers, credit cards, electronic checks, and mailed checks.
Key Insights
1. Service Charge Distribution and Customer Preferences
The dashboard highlights a clear distinction in Internet and Phone Service Charges. The majority of customers have opted for fiber optic internet (up to 9.9M), and phone services (up to 7.6M), reflecting a preference for premium, higher-cost services. Lower subscription rates are evident in the DSL and non-phone service customers. This indicates an opportunity to upsell DSL customers to fiber-optic services, emphasizing speed and reliability advantages.
2. Churn Analysis and Its Correlation to Service Satisfaction
Across all dashboards, there is a significant churn rate (up to 1,869 customers), with a majority using bank transfers as their payment method. The churn rate appears to be linked to the number of tech tickets raised, with higher support inquiries correlating with higher churn. This suggests that customer support experiences directly influence retention. A deeper analysis of tech ticket categories might reveal common pain points that can be addressed to reduce churn.

3. Impact of Value-Added Services (Online Backup and Streaming)
The dashboards also indicate that online backup services are utilized by a moderate portion of the customer base, while a large proportion has not opted for online backup (48.08%). Similarly, the streaming TV service data shows a clear preference, with 10.2M users opting in. These value-added services provide a potential revenue stream, and efforts should be made to market their importance, especially for customers not currently subscribed.
4. Payment Method Preferences
A significant proportion of customers prefer automatic bank transfers and credit card payments, while mailed checks are the least favored. This insight suggests that improving the ease of access to automatic payment methods and providing incentives for switching away from manual payment options could reduce administrative costs and improve customer satisfaction.
Actionable Recommendations
Reduce Customer Churn Through Proactive Support Since the data indicates a correlation between tech ticket volume and churn, investing in enhanced customer support, particularly for high-ticket services like fiber optic, will likely reduce churn. Implementing an AI-driven chatbot or a comprehensive FAQ system could also alleviate the burden on tech support teams, ensuring customers resolve common issues quickly.
Upsell Lower Service Tier Customers With a clear division between fiber optic and DSL customers, a strategic campaign to encourage DSL customers to upgrade could be beneficial. Highlighting the advantages of fiber optic speed, stability, and future-proofing their connection will tap into potential upsell opportunities, driving higher revenues.
Leverage Insights for Value-Added Service Growth The lower engagement with online backup services presents an opportunity. Initiating campaigns that emphasize data security and convenience could sway customers who are currently undecided or unaware of the service's benefits. Similarly, for streaming services, bundling packages that include both TV streaming and online backups at a discounted rate might increase subscription rates.
Encourage Digital Payments Reducing manual payment methods like mailed checks, which are labor-intensive and prone to delays, should be a priority. Offering discounts or perks for switching to automatic payment methods could streamline billing processes and improve cash flow.

Conclusion
The customer retention dashboards offer a wealth of data-driven insights into customer behavior, preferences, and pain points. By focusing on reducing churn through improved customer support, upselling opportunities for lower-tier service customers, and growing adoption of value-added services, businesses can not only improve retention but also boost their revenue streams. Leveraging these insights will enable better strategic decisions, ultimately contributing to sustained business growth.
Subscribe to my newsletter
Read articles from Ogunmesi Tobiloba directly inside your inbox. Subscribe to the newsletter, and don't miss out.
Written by
