Rendering the Java heap as a Treemap
 Pierre-Yves Ricau
Exploring heap dumps
I have investigated many heap dumps over the years, and I usually switch back and forth between two tools:
YourKit Java Profiler to poke around the heap and look for interesting things (ask your company to buy a license!)
Shark when I'm trying to perform more complex aggregation questions or queries that YourKit can't answer easily.
Side quest: Shark + Graphviz
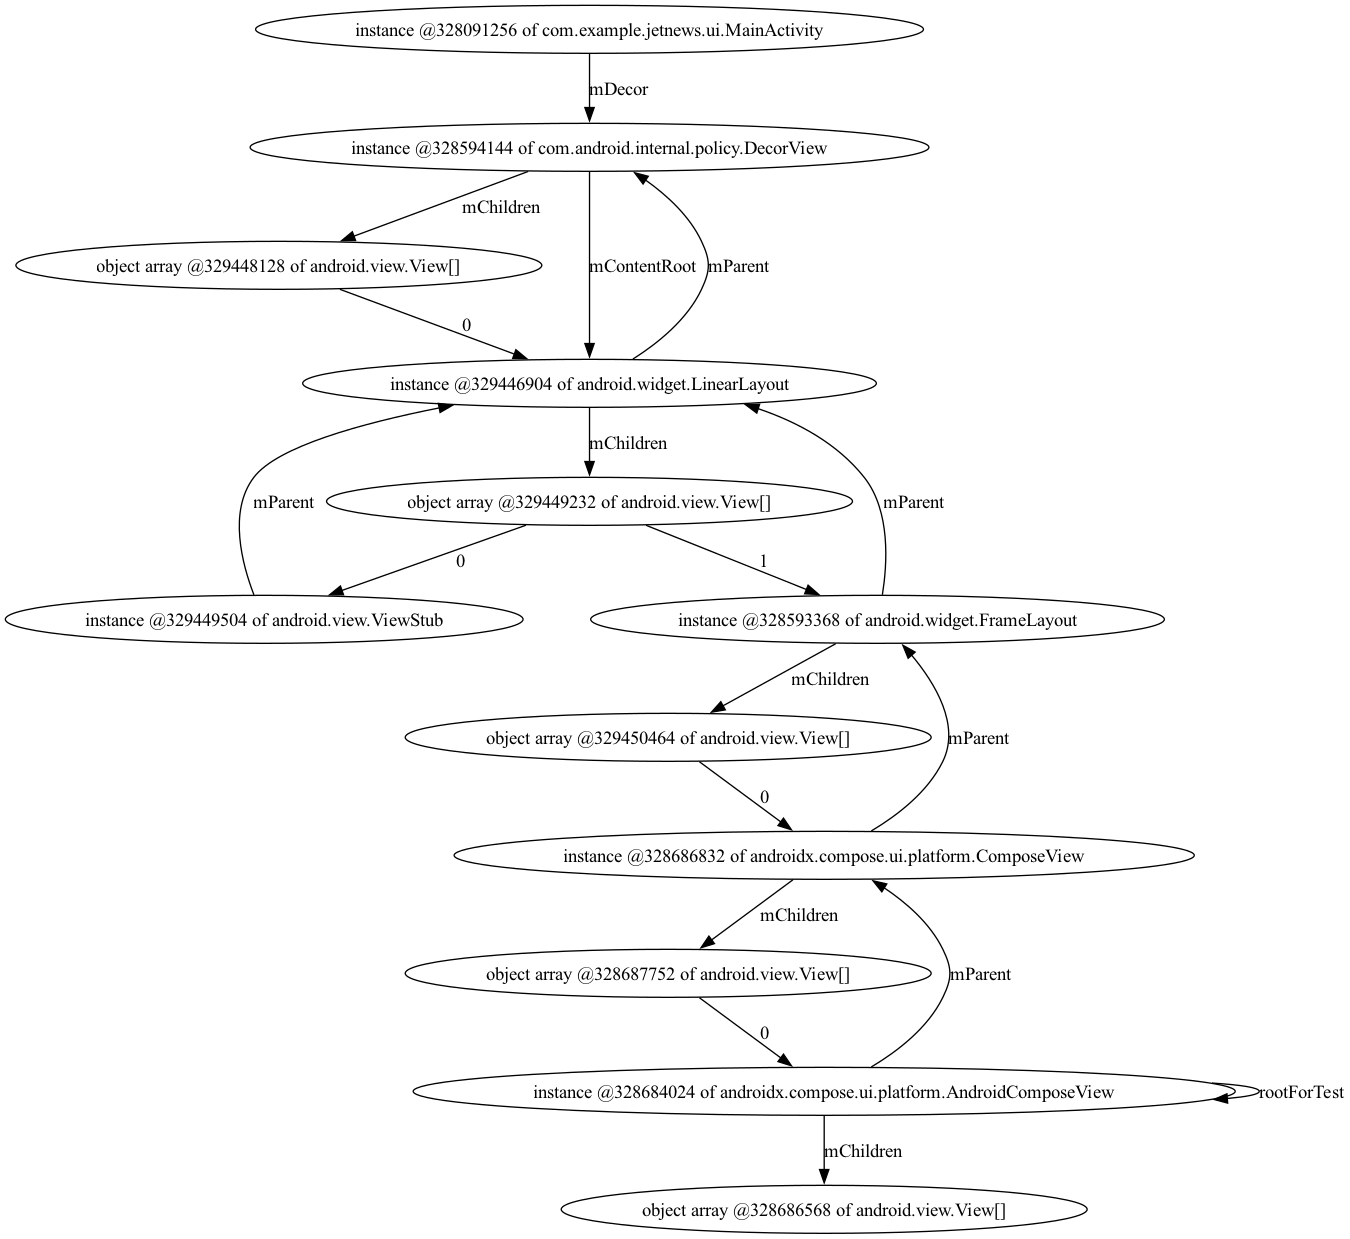
I wanted to show off how the Shark APIs allow you to explore the heap graph in any way you want, so I wrote a Kotlin script that explores & render the view hierarchy of any activity in the heap. It leverages Shark to locate activity instances, traverses all view & view array references via a Breadth First Traversal, then generates a Graphviz .dot file and executes a Graphviz command.
I shared it as a gist, it’s fairly short, go check it out!
val visitedObjectIds = traverseReferenceGraph(traversalRoots) { sourceObject ->
  referenceReader.read(sourceObject).mapNotNull { reference ->
    val targetObject = graph.findObjectById(reference.valueObjectId)
    val isView = targetObject is HeapInstance &&
      targetObject instanceOf "android.view.View"
    val isViewArray = targetObject is HeapObjectArray &&
      targetObject.arrayClassName == "android.view.View[]"
    if (isView || isViewArray) {
      visitedReferences += ObjectReference(
        sourceObjectId = sourceObject.objectId,
        targetObjectId = reference.valueObjectId,
        referenceName = reference.lazyDetailsResolver.resolve().name
      )
      targetObject
    } else {
      null
    }
  }
}
Here’s the result from a heap dump of the JetNews app:
What's eating my Java heap?
I frequently ask myself "why is the heap so large?" and "Are there some areas where we're using too much memory?". In a Java heap, we often talk about two types of object sizes, shallow size and retained size. Here’s a definition from Jetbrains:
Shallow size: the amount memory allocated to store the object itself. It does not include the sizes of the objects that are referenced by this object.
Retained size: the sum of the object's shallow size and the shallow sizes of its retained objects (objects that are only referenced from this object). In other words, the retained size is the amount of memory that can be reclaimed by garbage-collecting this object.
In YourKit, we can look at objects grouped by class to get a rough idea of what’s using memory.

Shallow size is interesting but not terribly useful. We expect some big objects, but it’s more interesting to know what’s using them.
To talk about retained size, we need to talk about dominators first.
Dominators
Let’s go over some definitions!
An object B is said to be reachable from another object A if there is a path of references from A to B, and otherwise B is unreachable from A.
A Garbage Collection root (gc root) is a reference to an object that tells the VM that object must not be garbage collected. There are many different kinds of GC Roots, but folks are usually familiar with system classes (loaded by the system class loader) and JNI references.
An object B is said to be reachable from GC roots is there is a path of references from at least one object referenced by a GC root, to B. Otherwise B is said to be unreacheable from GC roots. Objects that are unreachable from GC roots will be garbage collected. We often abbreviate this as “B is reachable / retained” or “B is unreachable / garbage collectable”.
If there is a path of references from an object A to an object B, and if removing a specific node C on that path makes B unreachable from A, then C is called a dominator, as it holds a position of control on any attempt at traversing the graph from A to B.
In the context of a heap dump, dominators are objects that are on the paths from GC roots to other objects. The dominator A of an object B, if removed, would make B unreachable. If you sum up the size of all the nodes that a dominator dominates, you get the amount of memory that would be freed if that dominator became unreachable. This is the retained size.
Let’s look at an example directed graph:
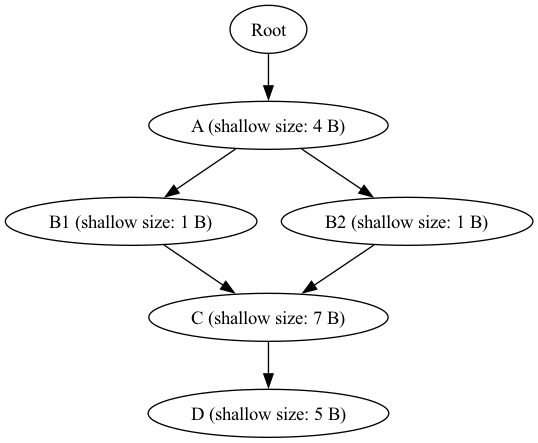
Here’s the resulting dominator graph:

Let’s look at what the dominator tree looks like for our previous heap dump of the JetNews app. Here we can see the activity is a dominator for all views, and every view group dominates all its descendant views.

Treemaps
Wikipedia on Treemapping:
Treemapping is a method for displaying hierarchical data using nested figures, usually rectangles.
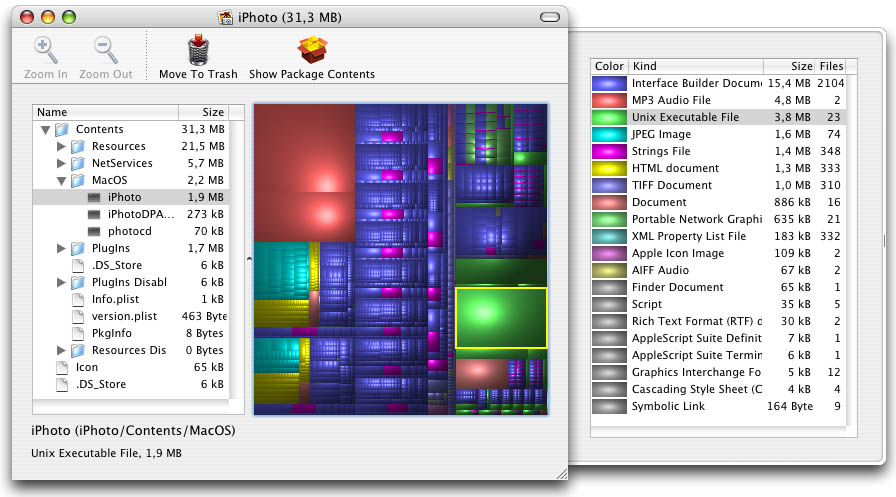
Treemaps display hierarchical (tree-structured) data as a set of nested rectangles. Each branch of the tree is given a rectangle, which is then tiled with smaller rectangles representing sub-branches. A leaf node's rectangle has an area proportional to a specified dimension of the data.[1] Often the leaf nodes are colored to show a separate dimension of the data.
A classic usage is visualizing disk space usage with Disk Inventory X:
Treemaps & Dominator Tree
If a treemap can be used to visualize disk space usage, we should be able to use it to visualize memory usage. However, a tree-map can only display tree-structured data, and the Java heap is a graph, not a tree.

As we saw earlier, Dominators form a tree: each node has a dominator, so each dominator has its own dominator, recursively until the root.

Once you have the dominator tree, you can compute the shallow size of each object in the graph, then for each dominator you can compute its retained size as the sum of the shallow size of each object it dominates (including itself).
So you get a tree where each node has a "retained size" which represents how much memory could be reclaimed if that node became unreachable.
This seems to make a ton of sense! Can we build that? We’re going to need an algorithm for computing the dominator tree.
Side quest: LeakCanary’s retained size
LeakCanary shows leak traces, and to help figure out which leaks have the highest impact on memory it also displays the retained size from the references that are likely creating the leak. Which means I had to write code that computes the dominator tree. I read a couple papers, thought about my use case and how I didn’t need the entire dominator tree and took some shortcuts to make it run faster.
Well, as I read that code again for this exploration, I realized I was very wrong (square/leakcanary/issues#2715). Until I reimplement this, retained size will often be over estimated.
LinkEvalDominators
Google has engineers who are really good at reading computer science paper. Through a search on cs.android.com, I stumbled upon LinkEvalDominators.kt, which is an agnostic Kotlin implementation of a dominator algorithm. Copy pasta, fix a few things, and voila, I have a dominator tree based on a Shark graph.
Now I can connect that to my previous code that was traversing the view hierarchy:
val (sortedHeapNodes, immediateDominators) = with(LinkEvalDominators()) {
    computeDominators(traversalRoots) { (sourceObjectId) ->
        val sourceObject = graph.findObjectById(sourceObjectId)
        referenceReader.read(sourceObject).mapNotNull { reference ->
            val targetObject = graph.findObjectById(reference.valueObjectId)
            val isView = targetObject is HeapInstance &&
                    targetObject instanceOf "android.view.View"
            val isViewArray = targetObject is HeapObjectArray &&
                    targetObject.arrayClassName == "android.view.View[]"
            if (isView || isViewArray) {
                HeapNode(targetObject.objectId)
            } else {
                null
            }
        }
    }
}
Quick Treemap
Did you know that Google Spreadsheet supports displaying sheets columns as a Treemap chart? All you need is 3 columns: child, parent and value (here, the retained size).
So let’s generate a CSV:
val csv = File(heapDumpFile.parent, "${heapDumpFile.nameWithoutExtension}.csv")
csv.printWriter().use { writer ->
    with(writer) {
        println("\"Child\",\"Parent\",\"Value\"")
        rootDominators.forEach { rootDominator ->
            printDominatorCsvRow(rootDominator)
        }
    }
}

fun PrintWriter.printDominatorCsvRow(node: DominatorObject) {
    val parent = node.parent
    if (parent == null) {
        println("\"${node.name}\",\"\",\"${node.retainedSize}\"")
    } else {
        println("\"${node.name}\",\"${parent.name}\",\"${node.retainedSize}\"")
    }
    for (child in node.dominatedNodes) {
        printDominatorCsvRow(child)
    }
}
Now we can import it into Google Spreadsheet:
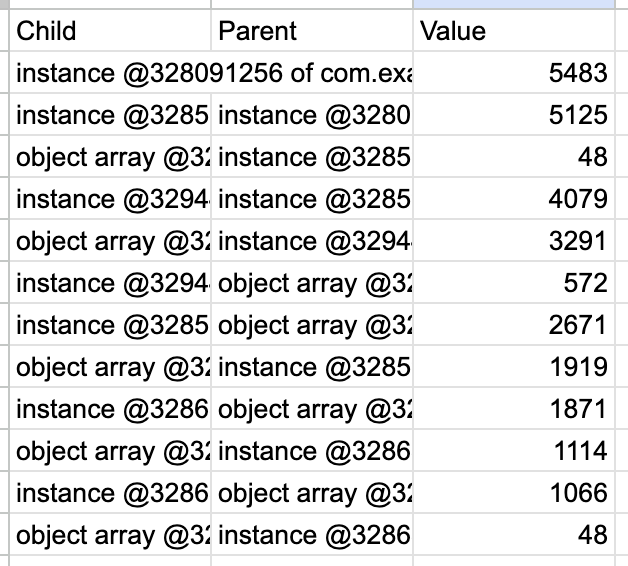
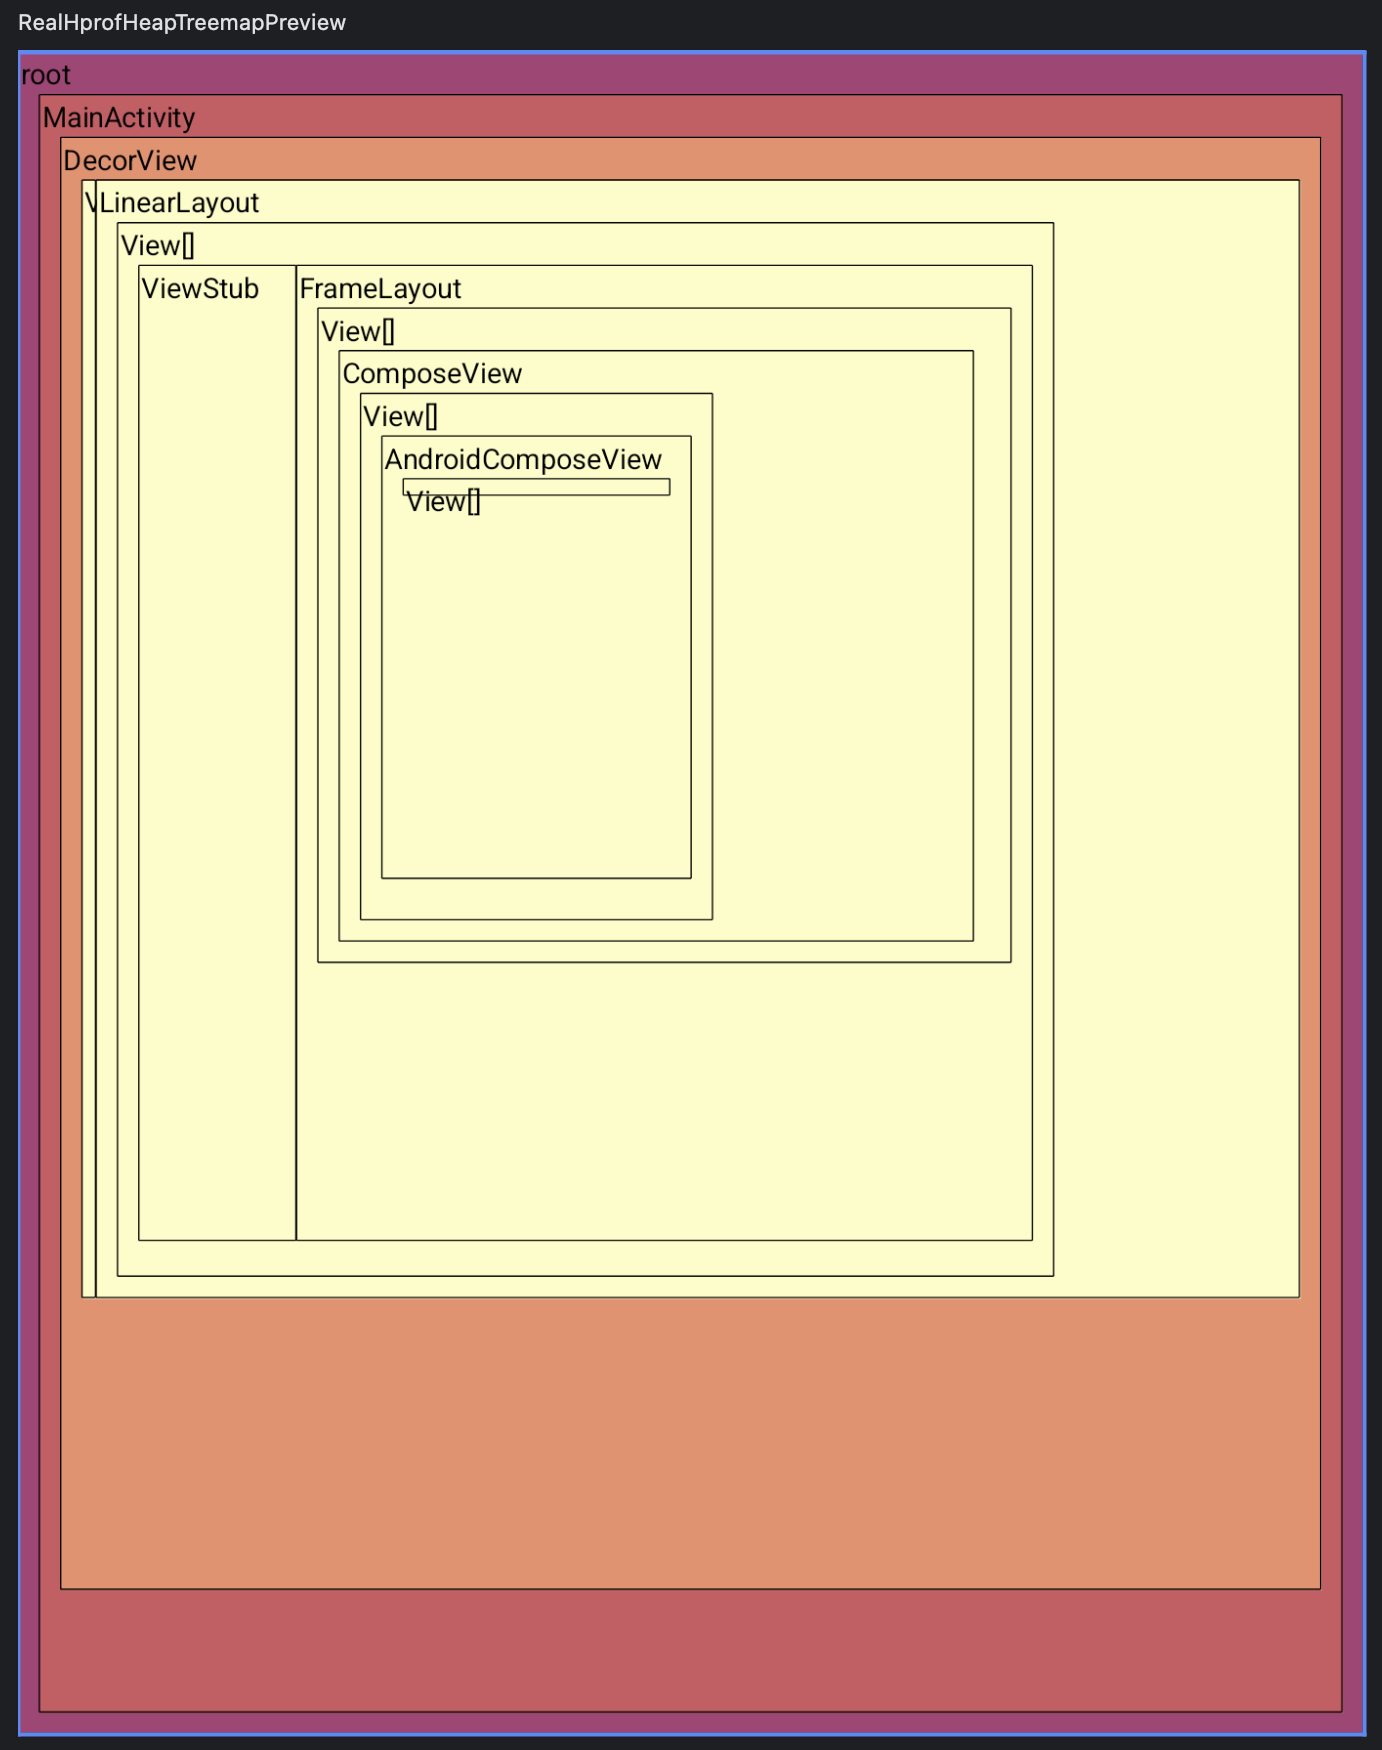
And we have our Treemap, configured to display all levels at once!
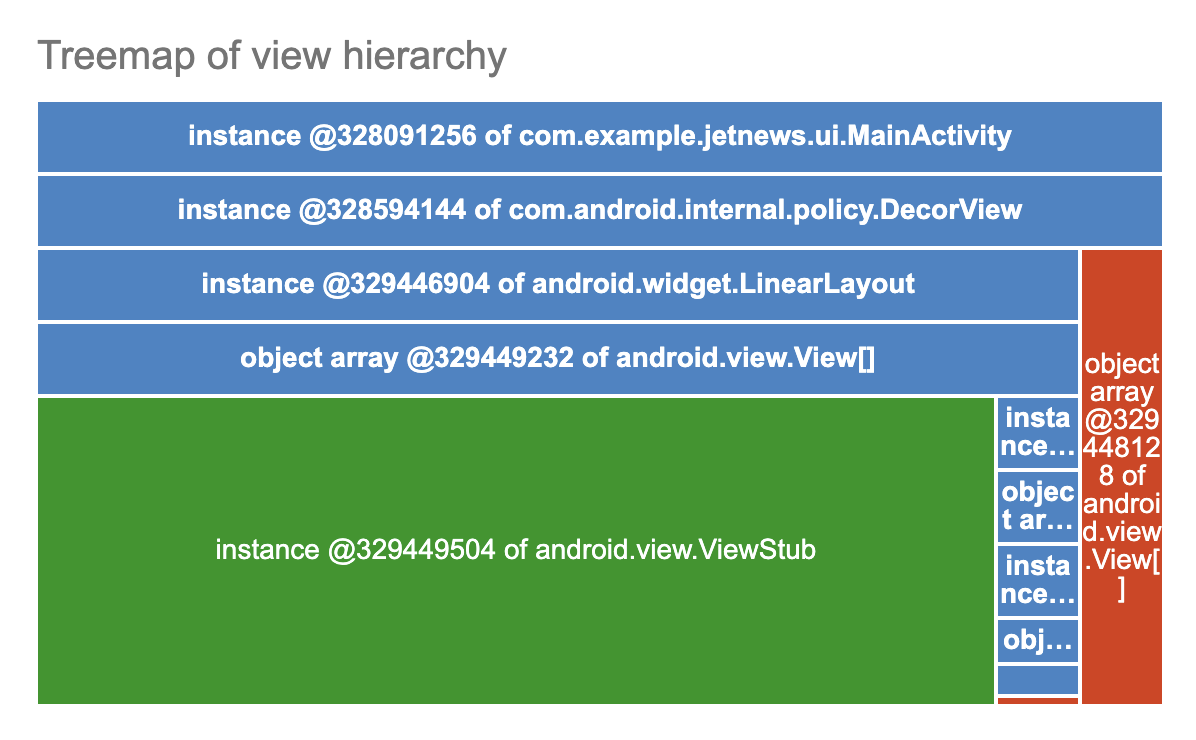
There’s a bit more code involved in that one, check out the gist!
Side-Quest: Compose Treemap
Last year, I started exploring this as a LeakCanary feature. I didn’t get very far but I did port to Compose the TreeMap rendering implementation from d3-hierarchy (see TreemapLayout.kt and TreeMapScreen.kt). Let’s copy the contents of the previous gist straight into that code. Then we can see the results immediately with the Compose Preview!
@Composable
@Preview(device = Devices.FOLDABLE)
fun RealHprofHeapTreemapPreview() {
  val heapDumpFile = File("/Users/py/Desktop/memory-20240919T161101.hprof")

  val root = heapDumpFile.openHeapGraph().use { graph ->
    ... // Same code as in previous gist.

    fun DominatorObject.mapToTreeMapNode(): NodeValue<String> {
      val children = dominatedNodes.map { it.mapToTreeMapNode() }
      return NodeValue(retainedSize, name, children)
    }


    NodeValue(
      value = rootDominators.sumOf { it.retainedSize },
      content = "root",
      children = rootDominators.map { it.mapToTreeMapNode() }
    )
  }

  Treemap(root) { it }
}

This is fairly ugly and probably buggy, but hey, a Compose Treemap, how cool is that?
Entire heap as a Treemap?
So far we only looked at a small subset of objects, the view instances. My original goal was to visualize how memory is used for the entire heap. So, I removed the code that filters only on view instances:
val traversalRoots = graph.gcRoots
  // Exclude Java local references
  .filter { it !is JavaFrame }
  .map { HeapNode(it.id) }.toSet()

val (sortedHeapNodes, immediateDominators) = with(LinkEvalDominators()) {
  computeDominators(traversalRoots) { (sourceObjectId) ->
    val sourceObject = graph.findObjectById(sourceObjectId)
    referenceReader.read(sourceObject).map { reference ->
      HeapNode(reference.valueObjectId)
    }
  }
}
This generates a 29 MB CSV with 293K rows, which I imported in Google Spreadsheet to turn into the following Treemap:
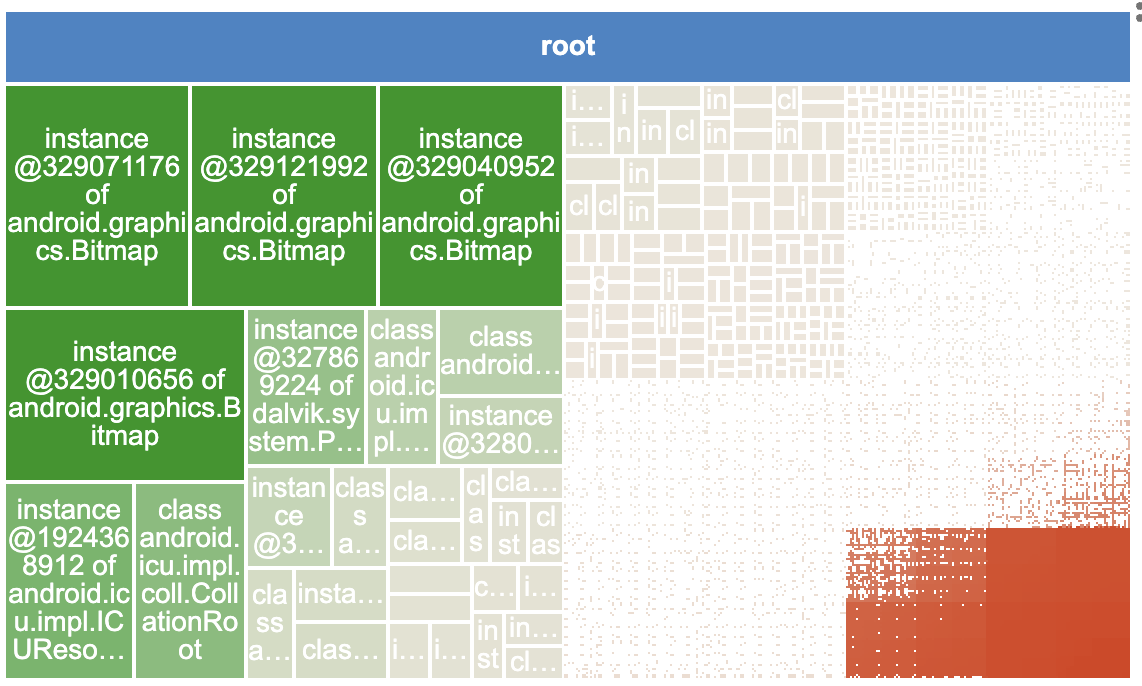
That’s unexpected! I configured the chart to only draw the top level, why am I seeing all these root nodes?
The heap dump has 25002 gc roots, and we end up with 56387 root dominators. How comes?
Dominator roots
Let’s look at a simple example, let’s say we have 2 classes that both have a reference to the android.app.Application singleton instance:
class A {
  static final Context sContext = retrieveAppContext();
}

class B {
  static final Application sApplication = retrieveAppContext();
}
In the heap dump we will see two system class GC Roots:

Remember the dominator definition?
A dominator node D of a node A is a node that if removed would make A unreachable.
Here, there isn’t a single node that could be removed to make the android.app.Application instance unreachable, if we remove one GC root the other GC root will still reference the android.app.Application instance.
So here’s the corresponding dominator graph:

Even though we had 2 gc roots, we ended up with 3 dominator roots.
Unfortunately, this also applies to instances that are deeper in the graph, without any additional GC roots. Let’s introduce a Dagger component:
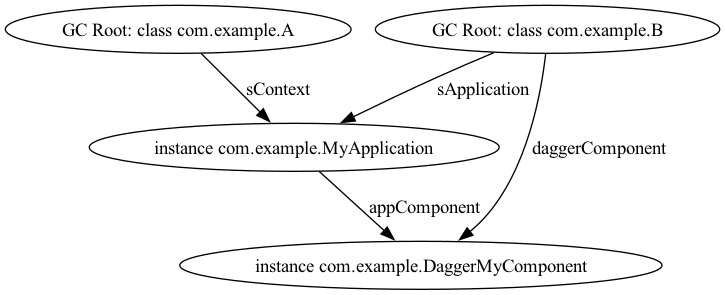
Once again, there is not a single node that could be removed to make the com.example.DaggerMyComponent instance unreachable, so our 2 GC roots now lead to 4 dominators:

Beyond dominator roots, this happens at every layer of the graph: an increase in graph breadth connectedness leads to lower depth in the dominator tree.
I captured the depth of every node in the dominator tree of the JetNews example heap dump, and generated a histogram of that depth:
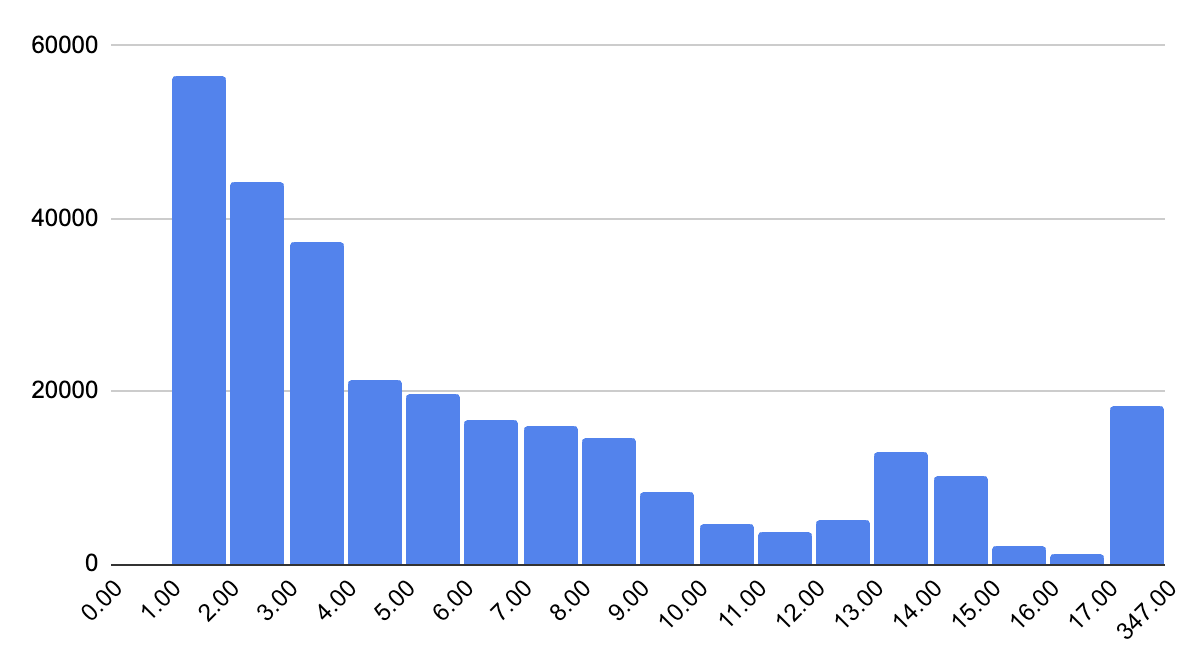
This shows most nodes live pretty high in the dominator tree, a lot more than I originally anticipated.
Conclusion
A Treemap generated from the dominator tree of a heap dump is less useful and intuitive than I expected.
In software engineering, we usually have a nice hierarchical mental model of our app components (e.g. an activity owns a view hierarchy, views own drawables, drawables own bitmaps, etc).
Unfortunately that nice hierarchy cannot be inferred automatically at runtime, because there are a lot of additional references that end up hiding what we expect to be the natural dominators.
Hope you enjoyed this ride!
Many thanks to Ishan Khanna for mentioning jQAssistant and starting a conversation about heap dump visualization tools, and Jesse Wilson for letting me spam his DMs and helping me think about this problem space differently.
Subscribe to my newsletter
Read articles from Pierre-Yves Ricau directly inside your inbox. Subscribe to the newsletter, and don't miss out.
Written by

Pierre-Yves Ricau
Pierre-Yves Ricau
My pronouns are he / him. Android Engineer at Square in San Francisco. A few things I enjoy: Publishing Open Source libraries (LeakCanary, Curtains, Radiography, square/logcat) Rollerblading Writing technical blogs (previously on dev.to/pyricau) Cooking Giving tech talks Reading sci-fi