💠 Altinity Cloud Observability with qryn
 Jachen Duschletta

Earlier this week our friends at Altinity released a guide on configuring Altinity Cloud stack observability using Grafana Cloud. Since qryn is a drop-in Grafana Cloud replacement (and so much more) with native ClickHouse storage, this is our redemption guide for Altinity Ops 😉
▶️ Altinity Cloud Observability with qryn
In this blog post, we’ll show you how to keep an eye on your Altinity-managed ClickHouse clusters using the qryn polyglot observability stack (or Gigapipe Cloud)
With the Altinity Cloud Manager, you can quickly configure your ClickHouse environment to send observability signals into qryn using Prometheus and Loki APIs and instantly use Grafana to create and share real-time visualizations and alerts.
We’ll walk you through the steps to:
Setup qryn or sign-up for Gigapipe Cloud
Send Prometheus metrics to qryn
Send ClickHouse Logs to qryn
Visualize and Explore data with Grafana and qryn
GOAL: Store qryn data in Altinity Cloud to kill Observability costs!
▶️ Get Polyglot
If you already have a qryn setup, you’re ready to go!
⚙️ If you’re using K8s: https://github.com/metrico/qryn-helm
⚙️ If you’d like a quick local setup use our qryn-demo bundle.
⚙️ If you’d like to keep things cloudy, signup for an Account on Gigapipe
▶️ Setup Prometheus + qryn
The qryn stack supports the Prometheus API out of the box, including remote_write capabilities. Using qryn and/or Gigapipe cloud, all you need is the qryn service URL and optional Authentication and Partitioning tokens:
From your Altinity Cloud Manager browse your list of environments, selecting the one you want to monitor and use the three-dot menu to edit the settings.
In the Environment Configuration dialog select the Metrics tab to configure
Once there, find the External Prometheus section and enter the qryn ingestions URL into the Remote URL field. When using Gigapipe, remember to add the API-Key as the Auth User and finally add the API-Secret as the Auth Password*.*
  https://qryn.local:3100/api/v1/prom/remote/write
  -- OR --
  https://qryn.gigapipe.com/api/v1/prom/remote/write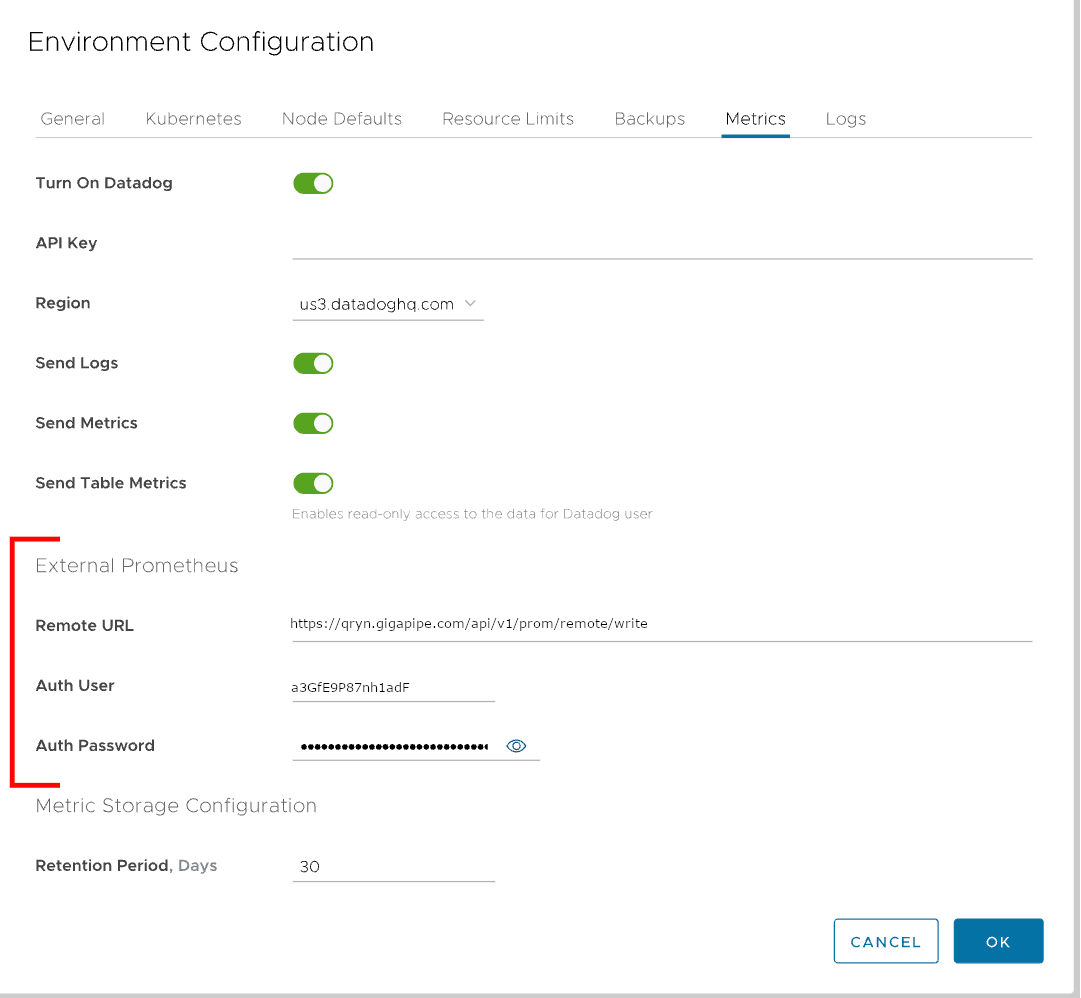
Click the OK button to save the changes. This will activate the required connections and initiate metrics generation towards your qryn instance
▶️ Setup Loki Logs + qryn
Let’s perform the same operation to emit our Logs using the qryn Loki API
From your Altinity Cloud Manager browse your list of environments, selecting the one you want to monitor and use the three-dot menu to edit the settings.
In the Environment Configuration dialog select the Metrics tab to configure
Once there, find the External Loki URL field, where you provide the qryn API URL
  https://qryn.local:3100/loki/api/v1/push
  -- OR --
  https://API-KEY:API-SECRET@qryn.gigapipe.com/loki/api/v1/push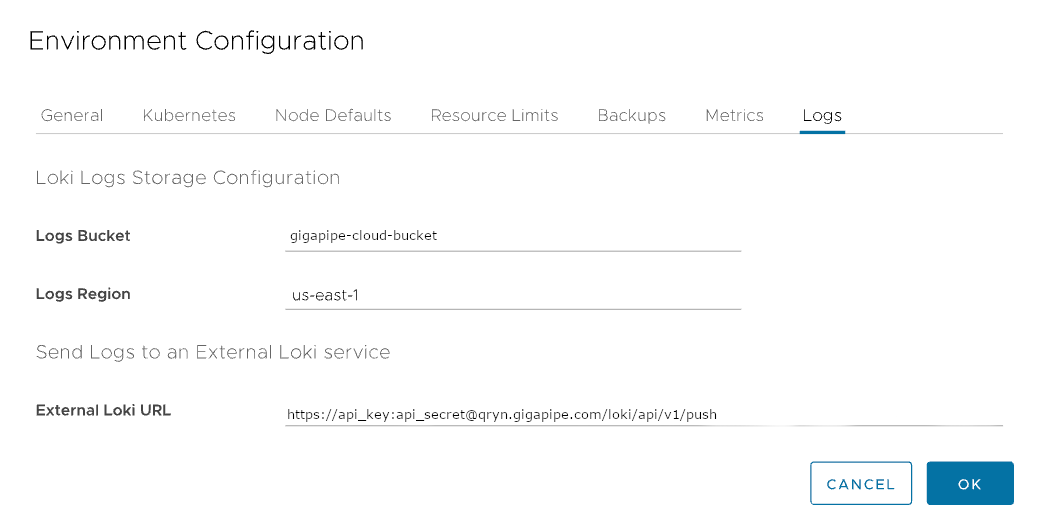
Click the OK button to save the changes, which will activate the connection and send logs to your qryn or Gigapipe Cloud instance. We’re all set!
🔎 Exploring Metrics
Let’s open our qryn Grafana or Gigapipe Grafana to browse our datasources.
Navigate to the Explore tab and use the New Metric Exploration application to see an overview of all the received Altinity Cloud Metrics:
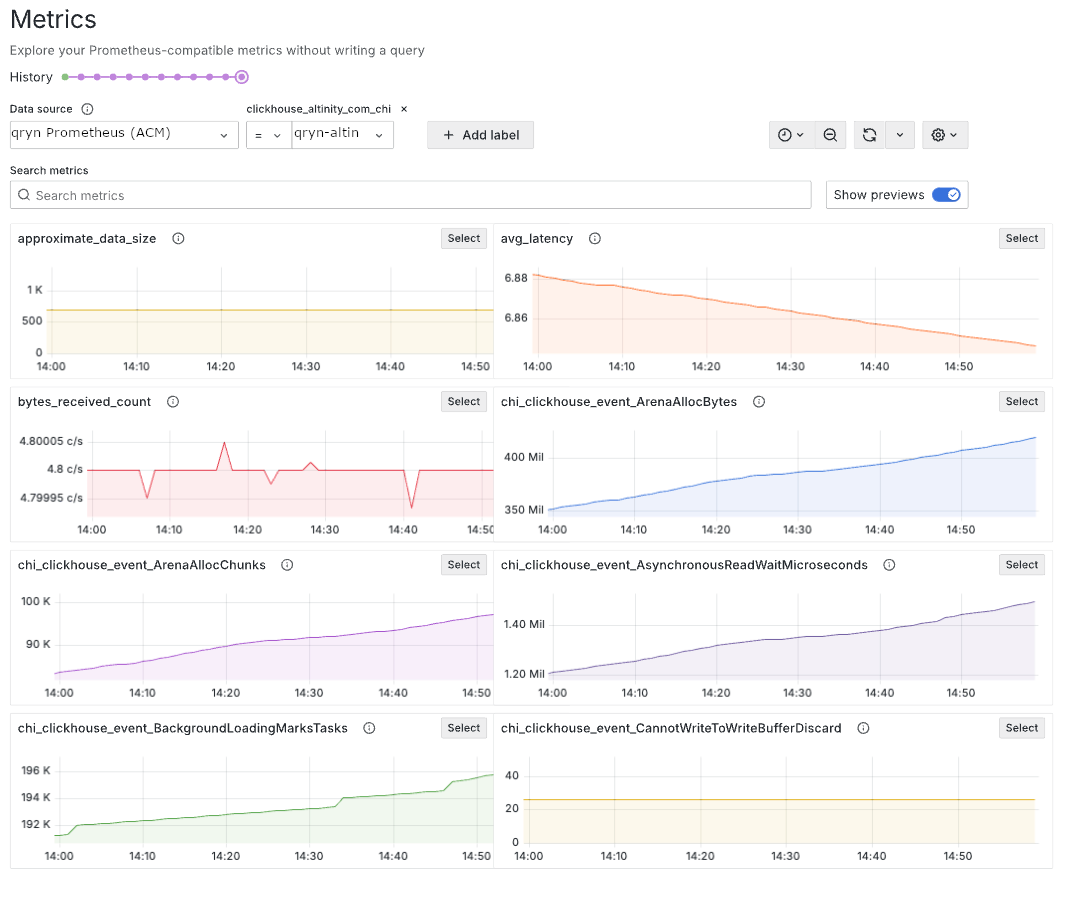
The labels will help you select the correct parts of your cluster and to generate queries to observe our stack from multiple angles. Each of these label based queries can be added into a dashboard or used for alerting, right from inside Grafana using the Select button to start. Each visualization is labeled with the name of the metric itself
Every metric sent to the Prometheus server has one or more labels attached to it. We can filter what we see by selecting one or more labels. Click the Add label button to add a label to the query. When you click the button, you’ll see a dropdown list of labels from all the metrics sent to this server:
🔎 Exploring Logs
Click the Label browser button to see the labels available in your qryn instance:
Let’s start with some well known labels: namespace and pod.
Browse and select the available values to see logs produced by them:
{namespace="altinity-maddie-na",pod="clickhouse-operator-7778d7cfb6-9q8ml"}
Click the Show Logs button to see all the matching messages from those services.
That’s it! You’re ready to use LogQL features to filter, extract and transform logs!
🎱 Advanced Techniques
Logs can be used to create ad hoc statistics about rates of errors or count of ‘query types’ over time, to allow alerting or monitoring of important health related status logs.
To make ad hoc statistics, we can use a query that filters the logs to something interesting (e.g. Logs that contain the word ‘Error’) and then use a counter query to see the amount of occurrences of the Error logs over time.
count_over_time({job="dummy-server"} |~ `Error` [$__auto])
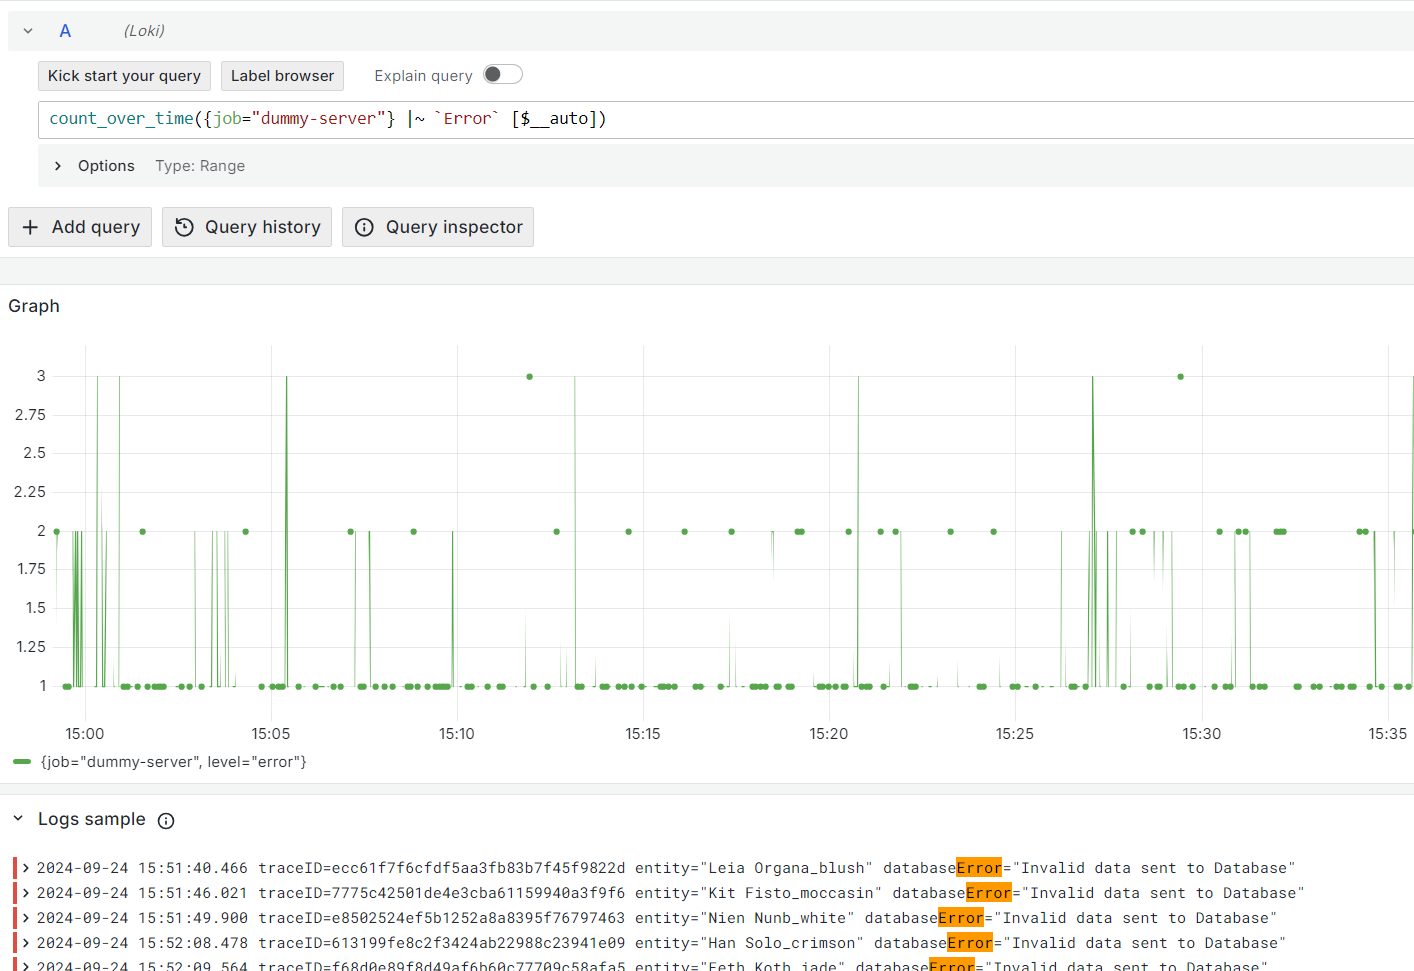
This allows us to see how many Errors are occurring and if they increase over time. Using this query, we can also set an alert to detect if Errors pass a threshold.
To add an alert, we can navigate to the Alerting Menu inside Grafana and select Manage Alert Rules. Once there, we click New Alert rule to create a new rule.
Now we can use the above query to create an Alert for ‘Error’ log lines. Using this alert we can now get notified by Grafana when our cumulative ‘Error’ count goes above 100 in a 10 minutes span.
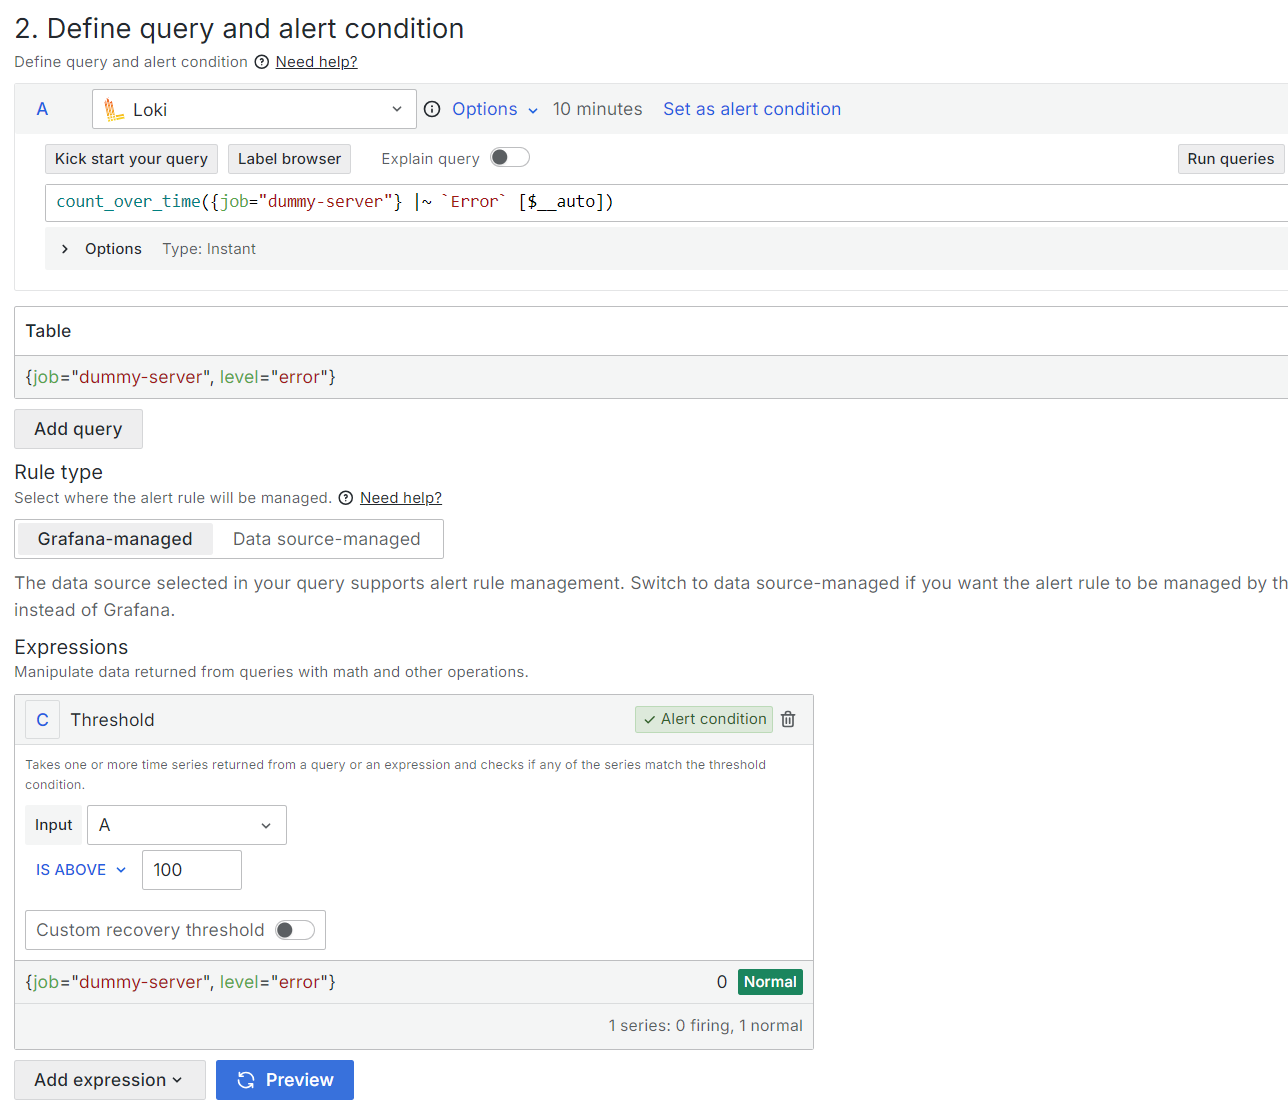
Through the power of qryn and Grafana, you can be alerted on Metric spikes, Log rates and Occurrences. Making it faster to find and resolve issues in your system.
👁️🗨️ Conclusion
If you use Clickhouse, use it all the way and store your observability in OLAP!
With qryn you get the same APIs and features as Grafana Cloud as a thin overlay on top of your existing ClickHouse storage, retaining control of costs, storage and without dependencies on third-party providers and their usage based plans…
Don’t drop your data to save. Drop your expensive Observability provider!
Subscribe to my newsletter
Read articles from Jachen Duschletta directly inside your inbox. Subscribe to the newsletter, and don't miss out.
Written by

