End-to-End Kubernetes Observability with ArgoCD, Prometheus, and Grafana on KinD using Terraform
 Balraj Singh
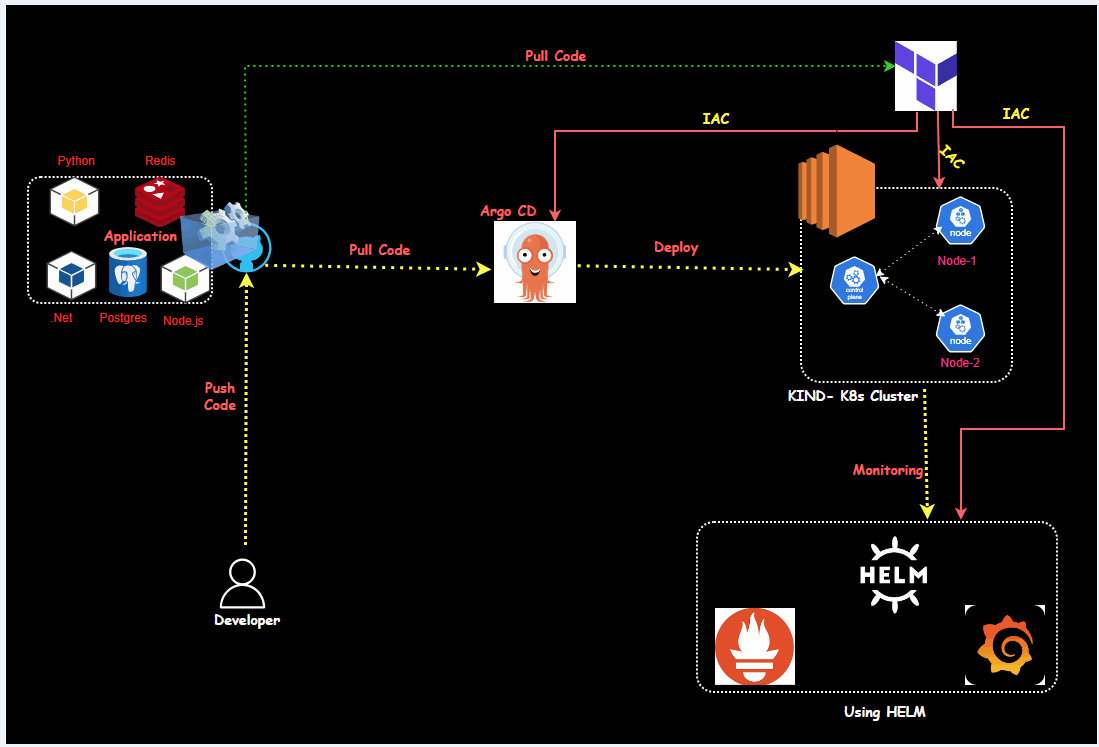
This guide will help you set up Prometheus and Grafana on Kubernetes with ArgoCD, ideal for both beginners and experienced DevOps professionals. The project focuses on monitoring Kubernetes clusters using Prometheus (for metrics collection) and Grafana (for visualizing those metrics). We'll also briefly cover ArgoCD for continuous delivery and how to integrate these tools to create a robust observability platform.
What is KinD?
KinD (Kubernetes in Docker)
Overview:
Purpose: KinD is a tool for running local Kubernetes clusters using Docker container “nodes”.
Use Case: Ideal for testing and developing Kubernetes features in a test environment.
Advantages:
- Simplicity: Creating and managing a local Kubernetes cluster is straightforward. Ephemeral Nature: Clusters can be easily deleted after testing.
Limitations:
Not for Production: KinD is not designed for production use.
Lacks Patching and Upgrades: No supported way to maintain patching and upgrades.
Resource Restrictions: Unable to provide functioning OOM metrics or other resource restriction features.
Minimal Security: No additional security configurations are implemented. Single Machine: Not intended to span multiple physical machines or be long-lived.
Suitable Use-Cases:
Kubernetes Development: Developing Kubernetes itself.
Testing Changes: Testing application or Kubernetes changes in a continuous integration environment.
Local Development: Local Kubernetes cluster application development.
Cluster API: Bootstrapping Cluster API.
If you would like to learn more about KinD and its use cases, I recommend reading the KinD project scope document which outlines the project’s design and development priorities.
Prerequisites for This Project
Before starting, make sure you have the following ready:
Kubernetes Cluster: A working Kubernetes cluster (KIND cluster or any managed Kubernetes service like EKS or GKE).
Docker Installed: To run KIND clusters inside Docker containers.
Basic Understanding of Kubernetes: Knowledge of namespaces, pods, and services.
Kubectl Installed: For interacting with your Kubernetes cluster.
ArgoCD Installed: If you want to use GitOps practices for deploying applications.
Key Steps and Highlights
Here’s what you’ll be doing in this project:
Port Forwarding with Prometheus: Bind Prometheus to port 9090 and forward it to 0.0.0.0:9090. This allows you to access the Prometheus dashboard from your machine.
Expose Ports on Security Groups: Open necessary ports (like 9090 for Prometheus and 3000 for Grafana) in your instance's security group to access them from outside.
Monitoring Services: Verify that Kubernetes is sending data to Prometheus. You can check this in the Targets section of Prometheus.
PromQL Queries: Use PromQL queries to monitor metrics like container CPU usage, network traffic, etc. You can execute these queries to analyze performance metrics.
Visualizing in Grafana: After adding Prometheus as a data source in Grafana, create dashboards to visualize CPU, memory, and network usage over time.
Real-Time Monitoring: Generate traffic or CPU load in your applications (like the voting app) to observe how Prometheus collects metrics and Grafana displays them.
Custom Dashboards: Use pre-built Grafana dashboards by importing them through dashboard IDs, making it easier to visualize complex data without starting from scratch.
Setting Up the Environment
I have created a Terraform file to set up the entire environment, including installing required applications, and tools, and the ArgoCD cluster automatically created.
Setting Up the Virtual Machines (EC2)
First, we'll create the necessary virtual machines using terraform.
Below is a terraform configuration:
Once you clone the repo, go to folder "12.Real-Time-DevOps-Project/Terraform_Code" and run the terraform command.
cd Terraform_Code/

$ ls -l
Mode                 LastWriteTime         Length Name
----                 -------------         ------ ----
da---l          25/09/24   7:32 PM                Terraform_Code
Note ⇒ Make sure to run main.tf from inside the folders.
cd 11.Real-Time-DevOps-Project/Terraform_Code"

Mode                 LastWriteTime         Length Name
----                 -------------         ------ ----
-a---l          25/09/24   2:56 PM            500 .gitignore
-a---l          25/09/24   7:29 PM           4287 main.tf
You need to run main.tf the file using the following terraform command.
Now, run the following command.
terraform init
terraform fmt
terraform validate
terraform plan
terraform apply
# Optional <terraform apply --auto-approve>
Once you run the terraform command, then we will verify the following things to make sure everything is set up via a terraform.
Inspect the Cloud-Init logs:
Once connected to the EC2 instance then you can check the status of the user_data script by inspecting the log files.
# Primary log file for cloud-init
sudo tail -f /var/log/cloud-init-output.log
If the user_data script runs successfully, you will see output logs and any errors encountered during execution.
If there’s an error, this log will provide clues about what failed.
Verify the Docker version
ubuntu@ip-172-31-95-197:~$ docker --version
Docker version 24.0.7, build 24.0.7-0ubuntu4.1


docker ps -a
ubuntu@ip-172-31-94-25:~$ docker ps
CONTAINER ID   IMAGE                  COMMAND                  CREATED         STATUS         PORTS                       NAMES
8436c820f163   kindest/node:v1.31.0   "/usr/local/bin/entr…"   4 minutes ago   Up 3 minutes   127.0.0.1:35147->6443/tcp   kind-control-plane
0d6ed793da0e   kindest/node:v1.31.0   "/usr/local/bin/entr…"   4 minutes ago   Up 3 minutes                               kind-worker
5146cf4dfd20   kindest/node:v1.31.0   "/usr/local/bin/entr…"   4 minutes ago   Up 3 minutes                               kind-worker2
Verify the KIND cluster:
After Terraform deploys the instance and the cluster is set up, you can SSH into the instance and run:
kubectl get nodes
kubectl cluster-info
kubectl config get-contexts
kubectl cluster-info --context kind-kind
Managing Docker and Kubernetes Pods
Check Docker containers running:
docker ps
ubuntu@ip-172-31-81-94:~$ docker ps
CONTAINER ID   IMAGE                  COMMAND                  CREATED         STATUS         PORTS                       NAMES
fb53c1a4ae3d   kindest/node:v1.31.0   "/usr/local/bin/entr…"   5 minutes ago   Up 4 minutes                               kind-worker2
0c9416ad738c   kindest/node:v1.31.0   "/usr/local/bin/entr…"   5 minutes ago   Up 4 minutes                               kind-worker
e2ff2e214404   kindest/node:v1.31.0   "/usr/local/bin/entr…"   5 minutes ago   Up 4 minutes   127.0.0.1:35879->6443/tcp   kind-control-plane
List all Kubernetes pods in all namespaces:
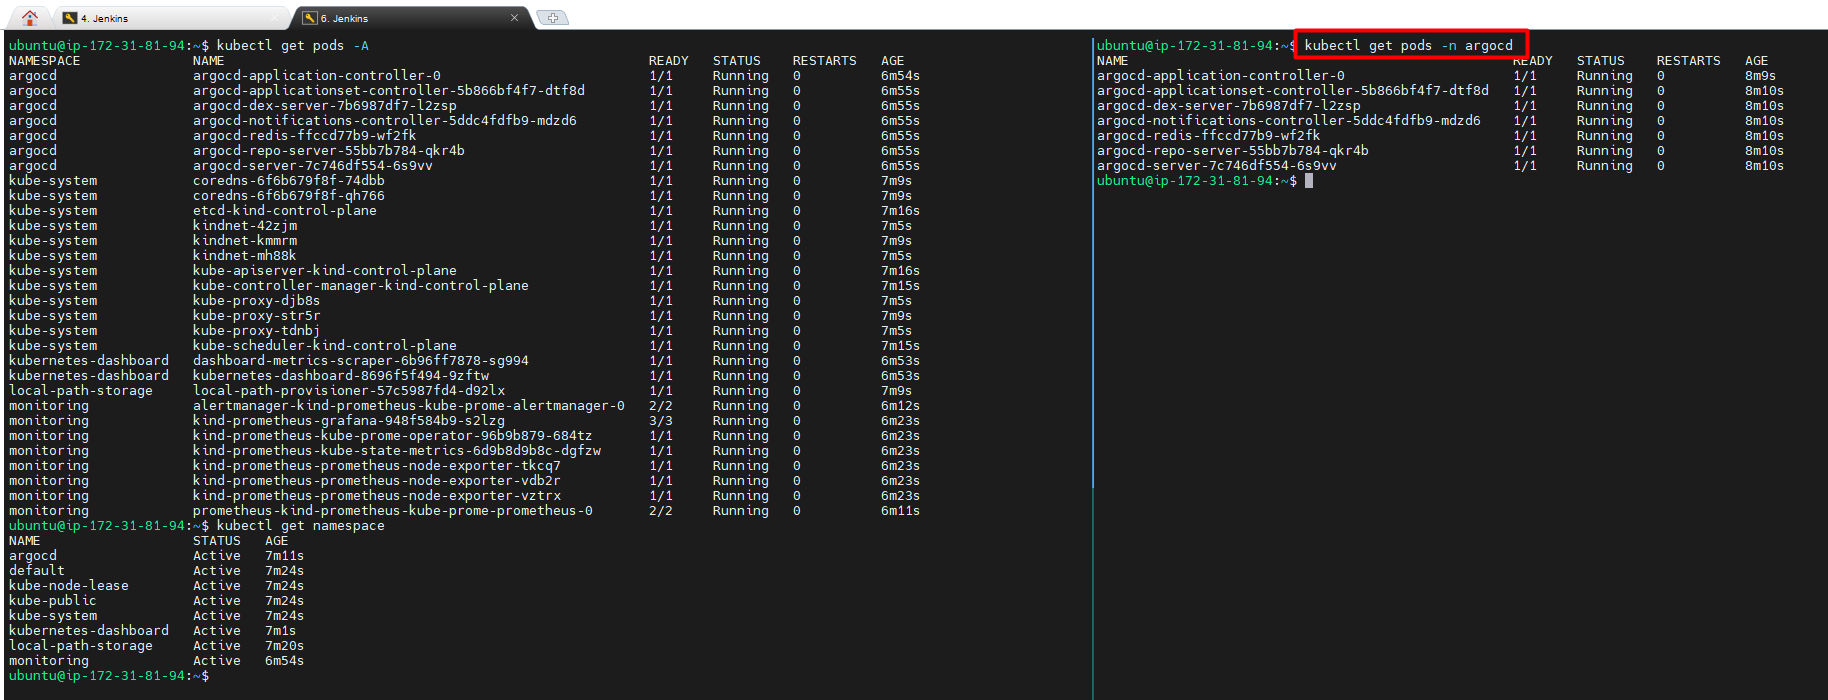
kubectl get pods -A
- To get the existing namespace
kubectl get namespace
ubuntu@ip-172-31-81-94:~$ kubectl get namespace
NAME                   STATUS   AGE
argocd                 Active   7m11s
default                Active   7m24s
kube-node-lease        Active   7m24s
kube-public            Active   7m24s
kube-system            Active   7m24s
kubernetes-dashboard   Active   7m1s
local-path-storage     Active   7m20s
monitoring             Active   6m54s
Setup Argo CD
Verify all nodes in namespace argocd
kubectl get pods -n argocd
Troubleshooting for error CreateContainerConfigError/ImagePullBackOff
as I am getting CreateContainerConfigError/ImagePullBackOff, if you getting the same then follow the below procedure to troubleshoot.
kubectl get pods -n argocd
NAME                                                READY   STATUS                       RESTARTS   AGE
argocd-application-controller-0                     0/1     CreateContainerConfigError   0          6m17s
argocd-applicationset-controller-744b76d7fd-b4p4f   1/1     Running                      0          6m17s
argocd-dex-server-5bf5dbc64d-8lp29                  0/1     Init:ImagePullBackOff        0          6m17s
argocd-notifications-controller-84f5bf6896-ztq6q    1/1     Running                      0          6m17s
argocd-redis-74b8999f94-x5cp5                       0/1     Init:ImagePullBackOff        0          6m17s
argocd-repo-server-57f4899557-b4t87                 0/1     CreateContainerConfigError   0          6m17s
argocd-server-7bc7b97977-vh4kg                      0/1     ImagePullBackOff             0          6m17s
Below is the steps to futher Troubleshooting Check Image Details: Run the following command to inspect the pod details:
kubectl describe pod -n argocd
Specifically, look for the Events section for more details about why the image cannot be pulled.
Review Logs for More Clues: You can also check the logs of the pods to see if there are more specific error messages that can help pinpoint the issue:
kubectl logs -n argocd
Network or DNS Issues: If your EC2 instance does not have proper internet access, it will not be able to pull images from DockerHub or other container registries. Ensure that your EC2 instance has internet access and can reach external container registries.
You can test connectivity by running:
curl -I https://registry.hub.docker.com
If there are connectivity issues, check the VPC configuration, security groups, and routing tables.
After researching the issue, it was discovered that there was insufficient disk space on the device. Previously, I was utilizing 8GB and edited that Terraform file to make it available 30GB. 
Check services in Argo CD namespace:
kubectl get svc -n argocd

Currently, it is set to
clusterIPand we will change it toNodePortExpose Argo CD server using NodePort:
kubectl patch svc argocd-server -n argocd -p '{"spec": {"type": "NodePort"}}'

Forward ports to access Argo CD server:
kubectl port-forward -n argocd service/argocd-server 8443:443 --address=0.0.0.0 &
# kubectl port-forward -n argocd service/argocd-server 8443:443 &
Now, we will open in browser to access argocd. https://<public IP Address of EC2>: 8443

- Argo CD Initial Admin Password
Grab the password to login to the dashboard/Retrieve Argo CD admin password:
kubectl get secret -n argocd argocd-initial-admin-secret -o jsonpath="{.data.password}" | base64 -d && echo

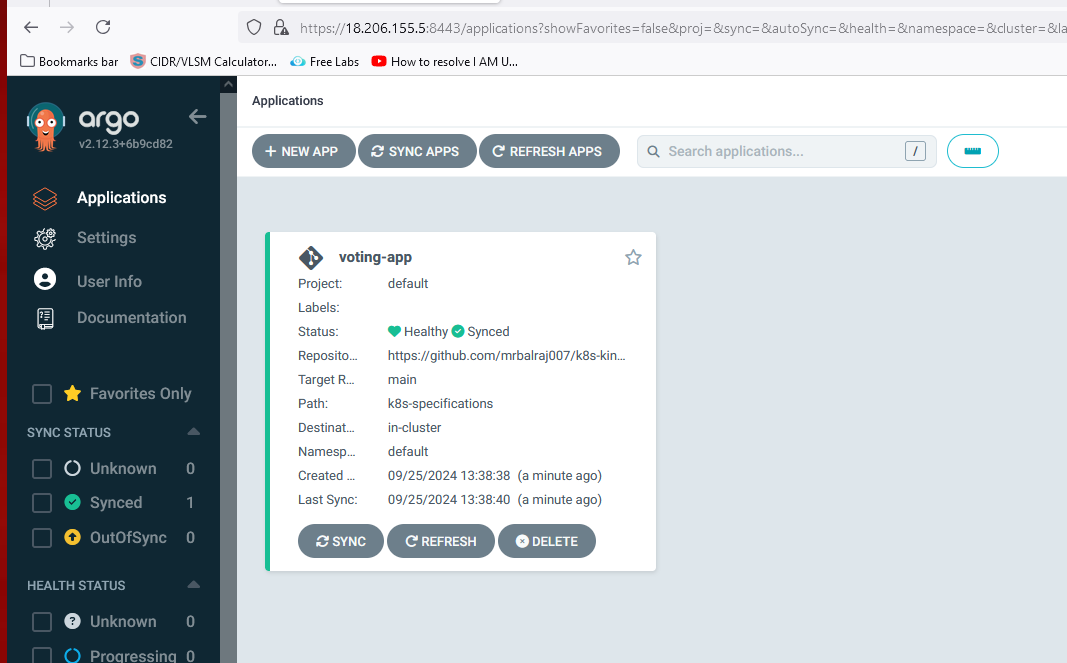
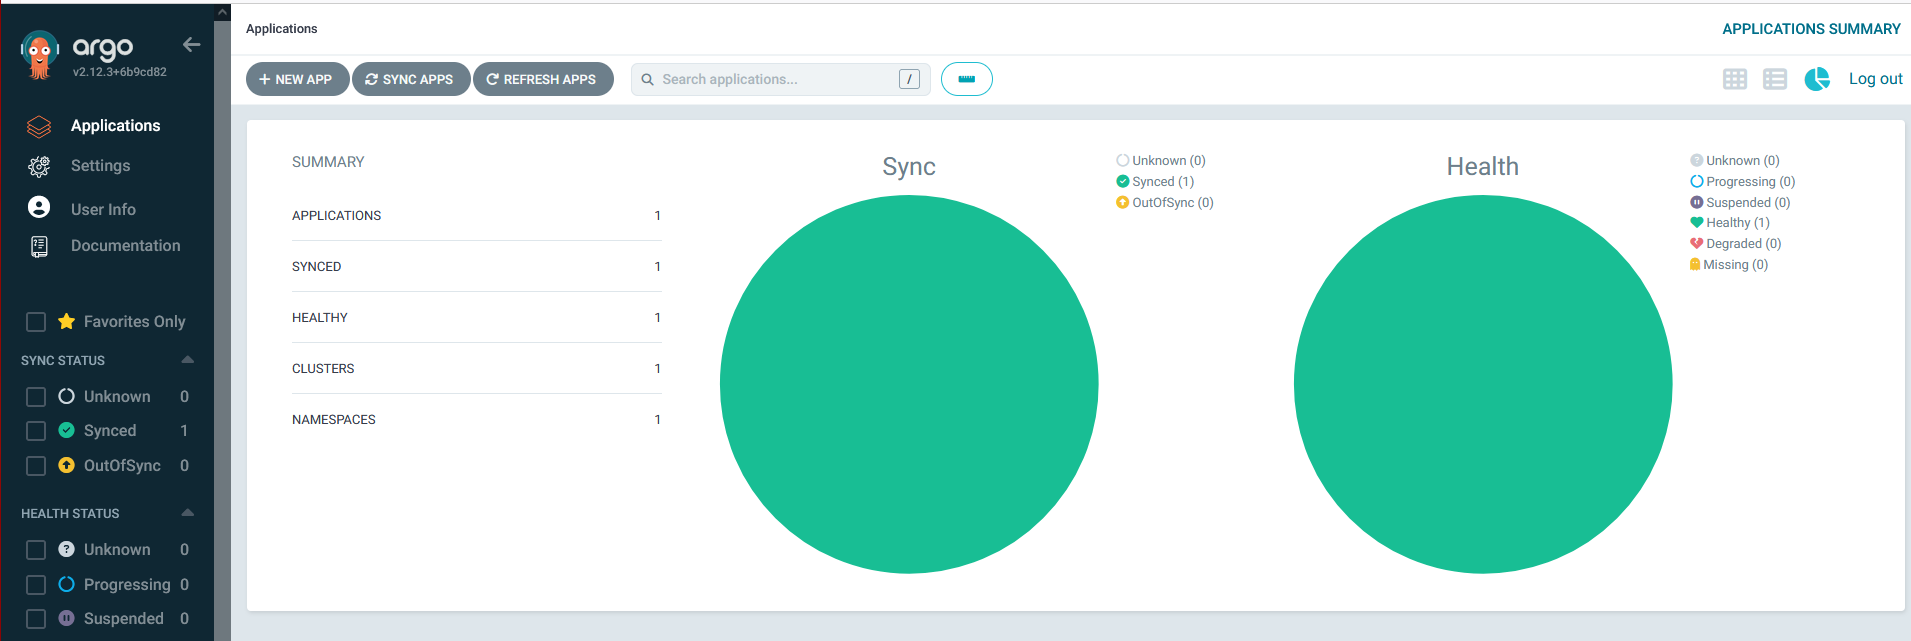
Configure the application in argocd
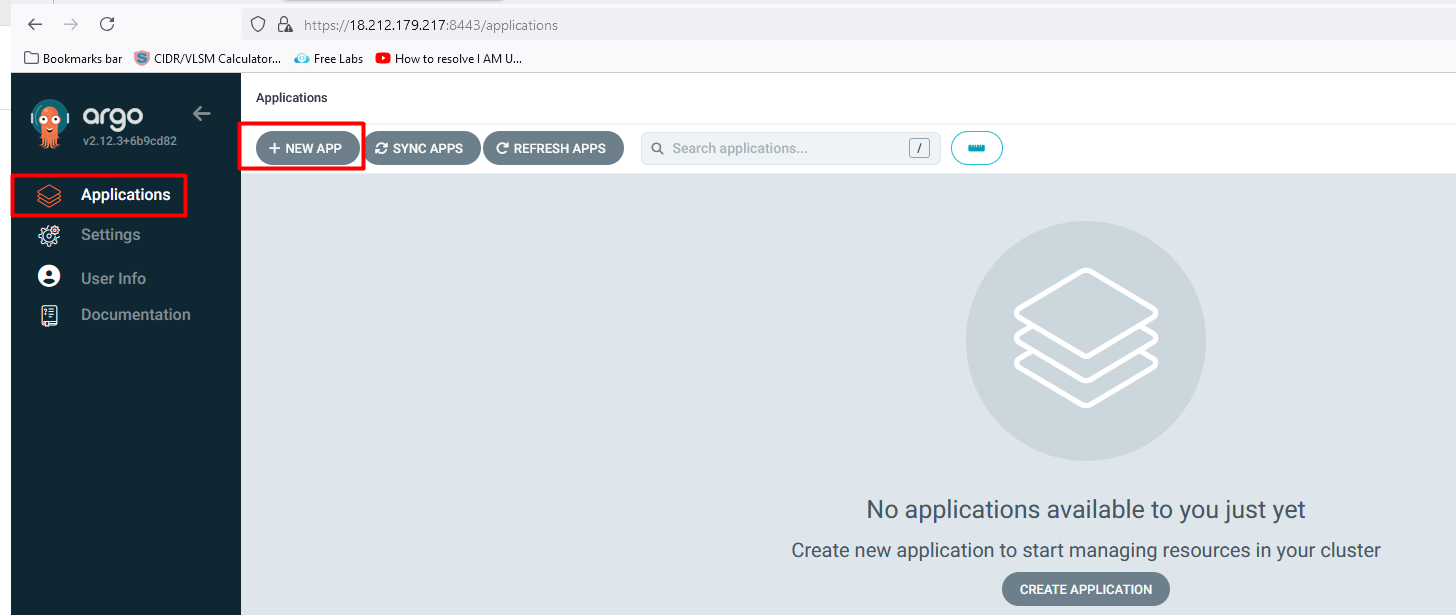
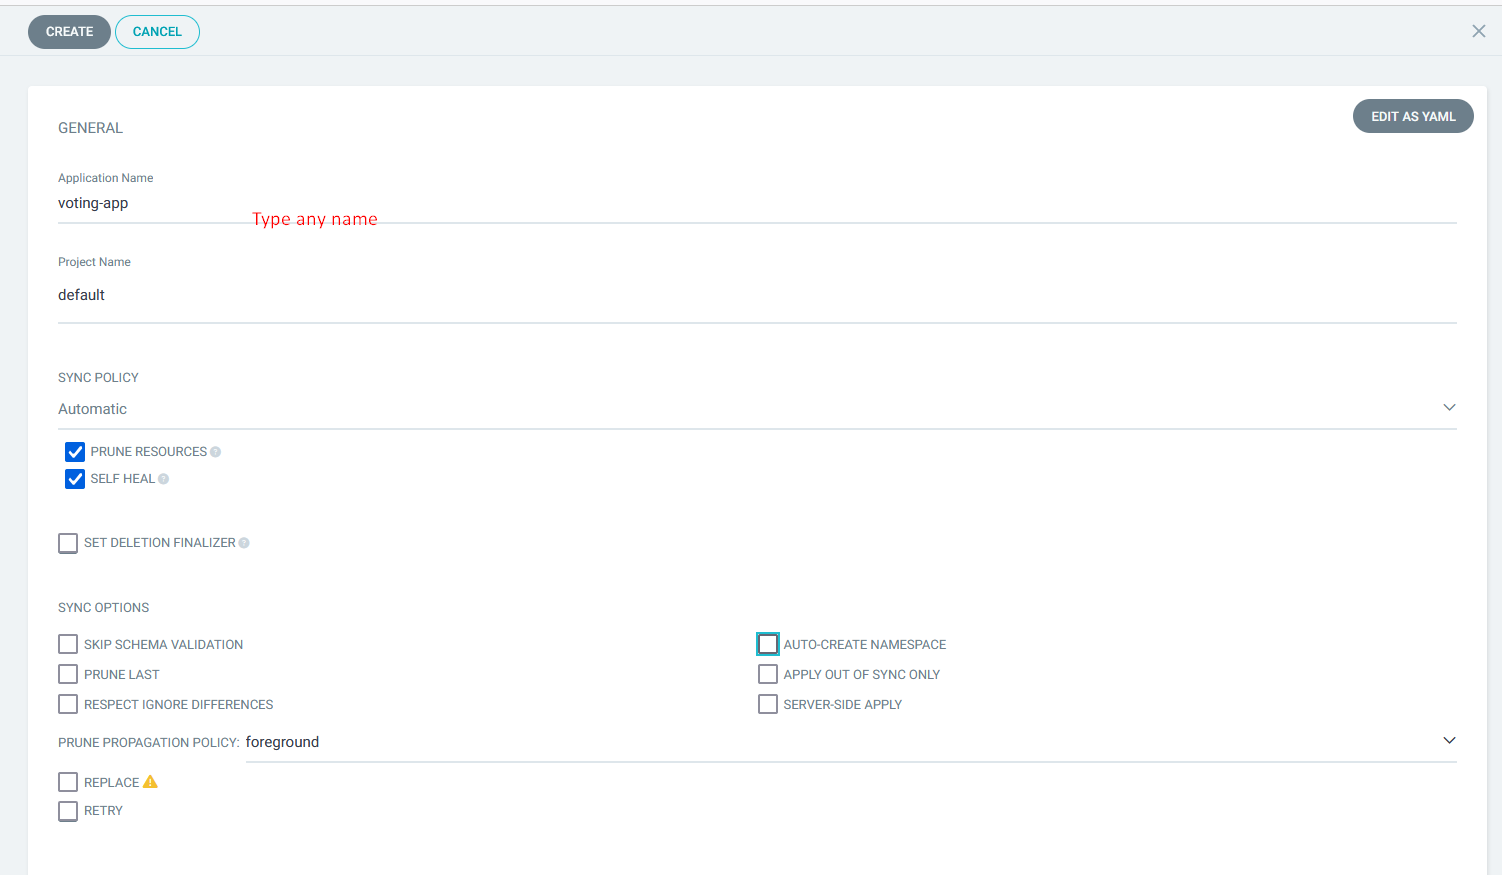
click on > applications>new apps>
Application Name: voting-app>
Project Name: default
Sync Policy: Automatic
Source>repogitory URL : https://github.com/mrbalraj007/k8s-kind-voting-app.git
Revision: main
Path: k8s-specifications # path for your manifest file
DESTINATION> Cluster URL : https://kubernetes.default.svc
Namespace: default


Validate the pods
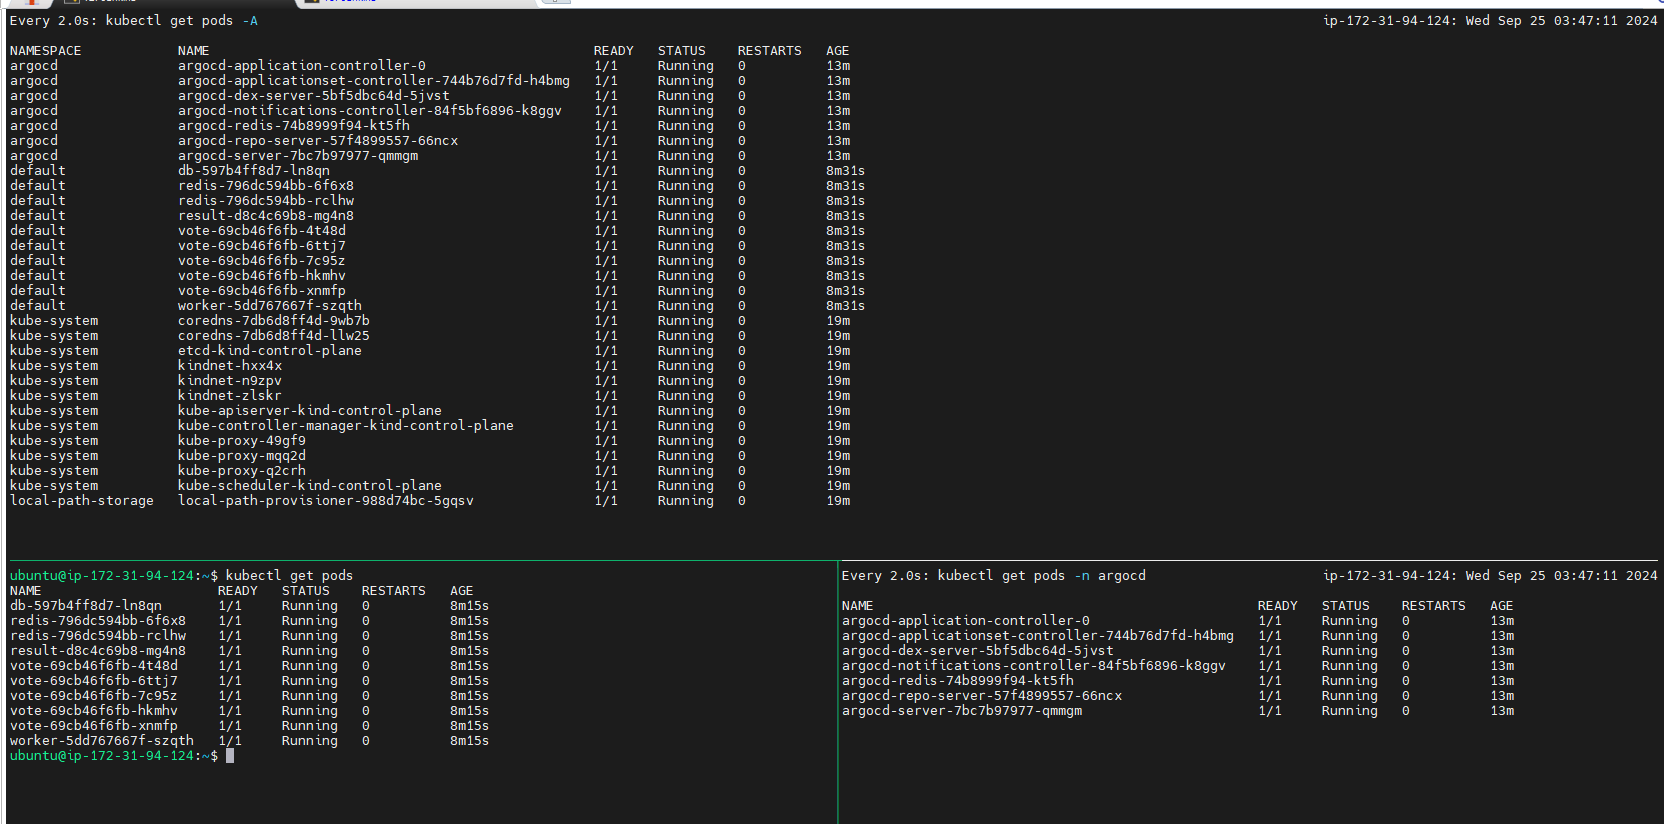
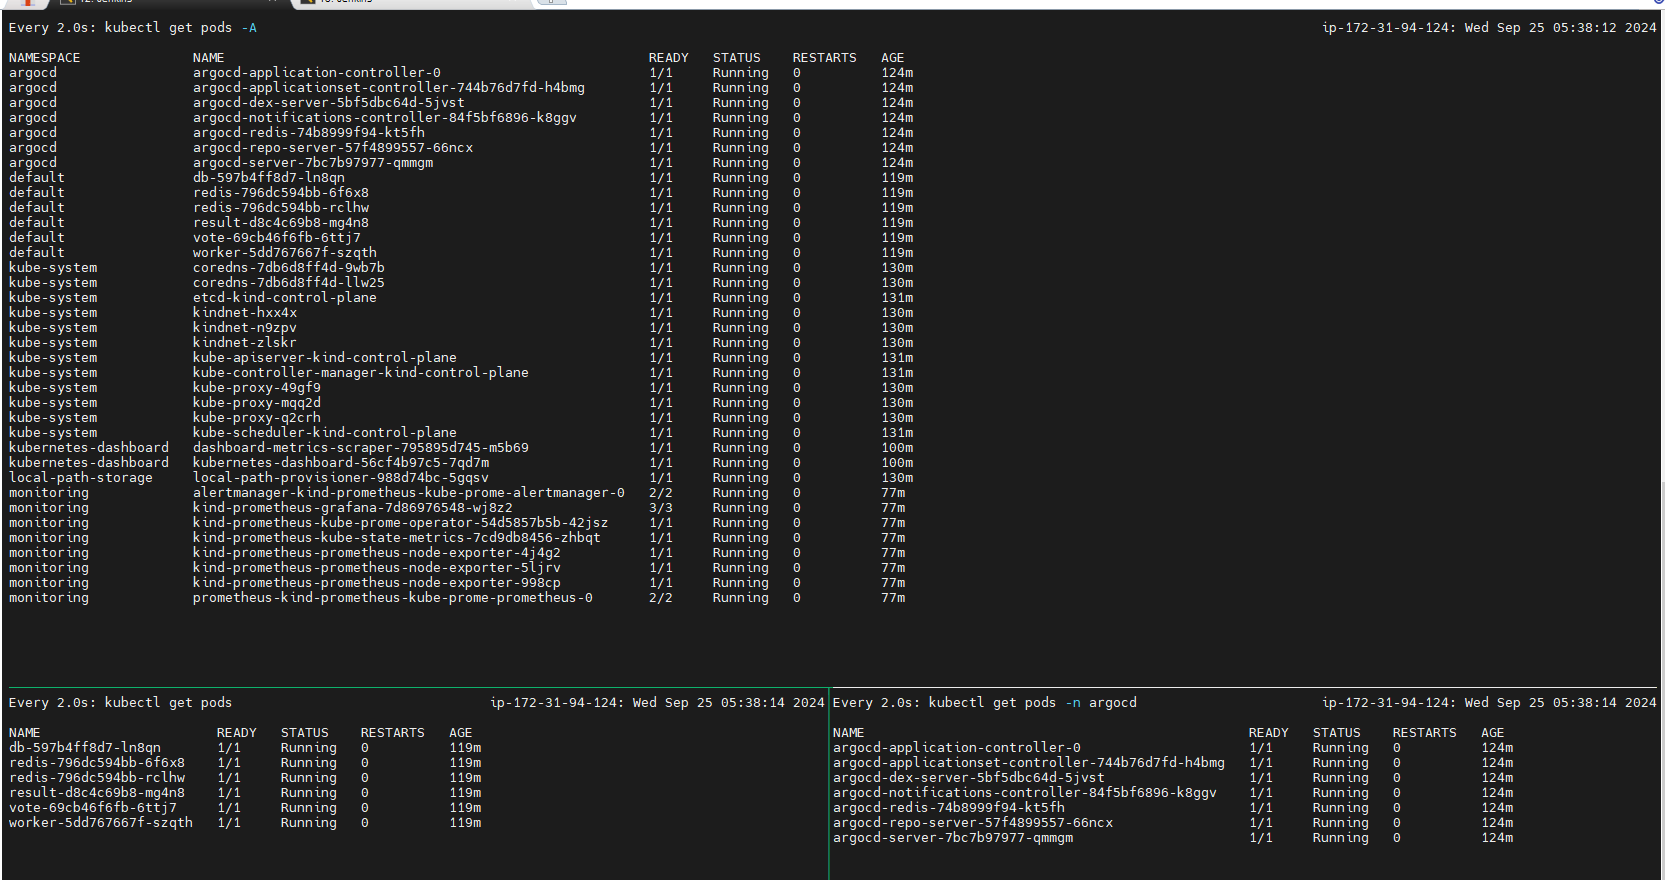
kubectl get pods

Verify the deployment
kubectl get deployments

Verify the service
kubectl get svc
kubectl get svc
NAME         TYPE        CLUSTER-IP      EXTERNAL-IP   PORT(S)          AGE
db           ClusterIP   10.96.201.0     <none>        5432/TCP         2m12s
kubernetes   ClusterIP   10.96.0.1       <none>        443/TCP          13m
redis        ClusterIP   10.96.65.124    <none>        6379/TCP         2m12s
result       NodePort    10.96.177.39    <none>        5001:31001/TCP   2m12s
vote         NodePort    10.96.239.136   <none>        5000:31000/TCP   2m12s
Now, we will do the port-forward to service Vote and results
kubectl port-forward svc/vote 5000:5000 --address=0.0.0.0 &
kubectl port-forward svc/result 5001:5001 --address=0.0.0.0 &
Verify the vote & results in browser.
Now, we will open in browser to access services.
http://<public IP Address of EC2>: 5000 (vote)http://<public IP Address of EC2>: 5001 (result)
For Vote:

For result:
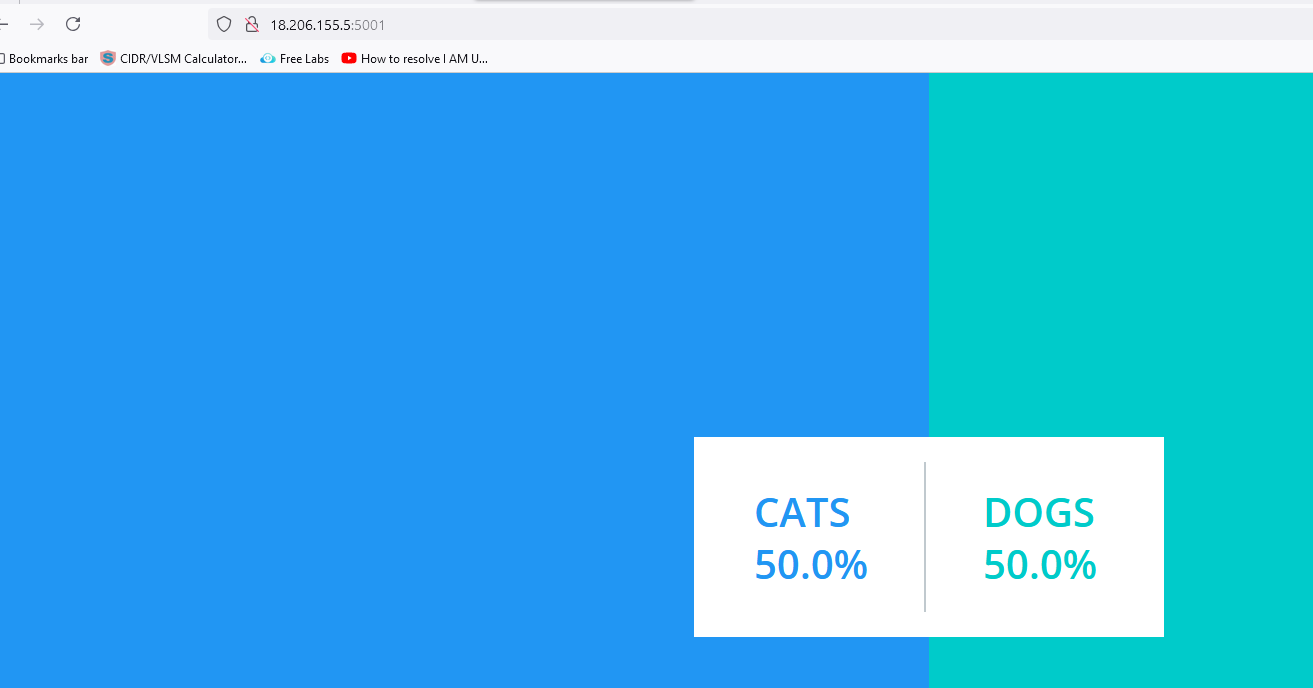
Click on any of the items on the voting page to see the results on the result page. I clicked on CATS, and the results are presented below.
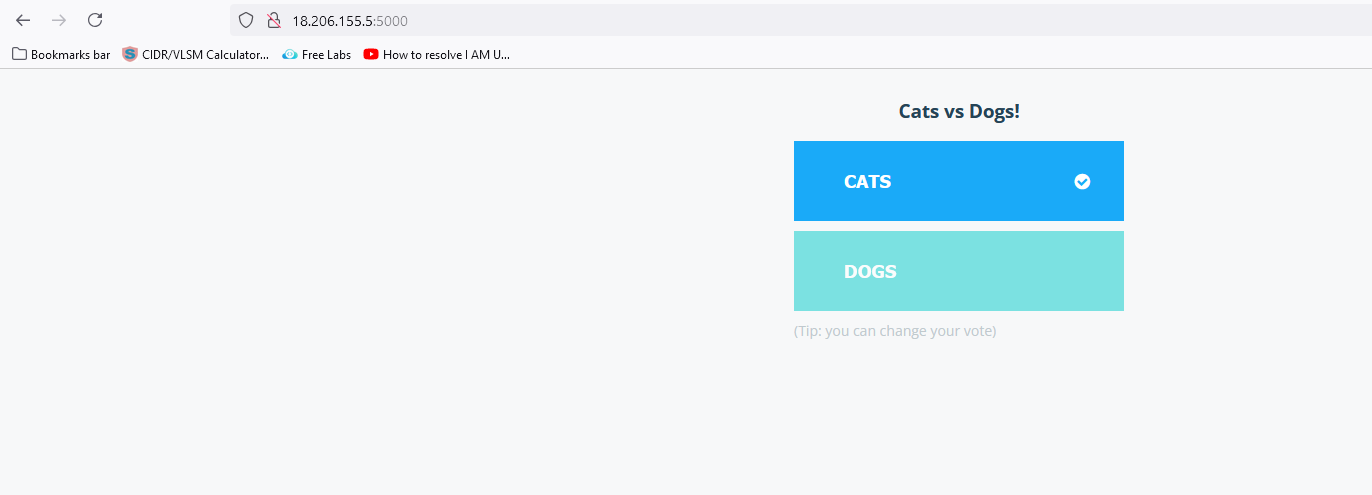
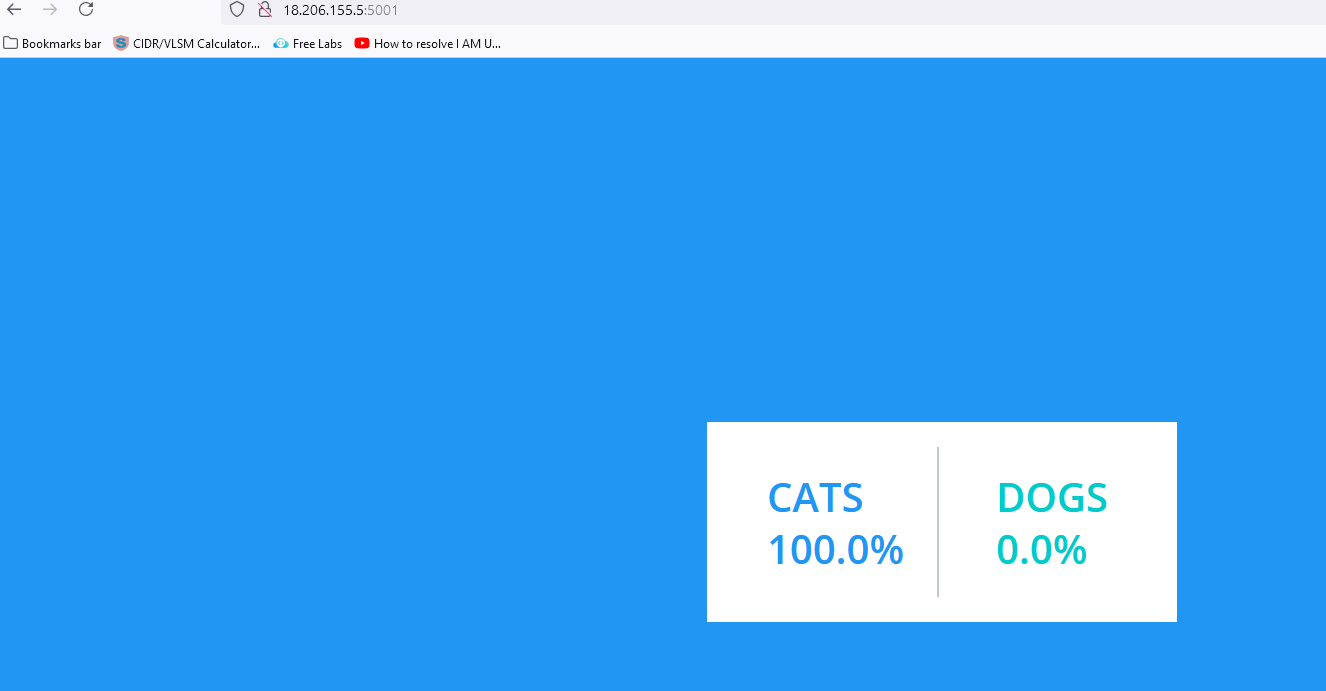
We have successfully set up Argo CD on a Kubernetes cluster & deployed the applications automatically.
Setup Kubernetes dashboard:
List all Kubernetes pods in all namespaces:
kubectl get pods -A
- To get the existing namespace
kubectl get namespace
ubuntu@ip-172-31-81-94:~$ kubectl get namespace
NAME                   STATUS   AGE
argocd                 Active   18m
default                Active   18m
kube-node-lease        Active   18m
kube-public            Active   18m
kube-system            Active   18m
kubernetes-dashboard   Active   18m
local-path-storage     Active   18m
monitoring             Active   18m
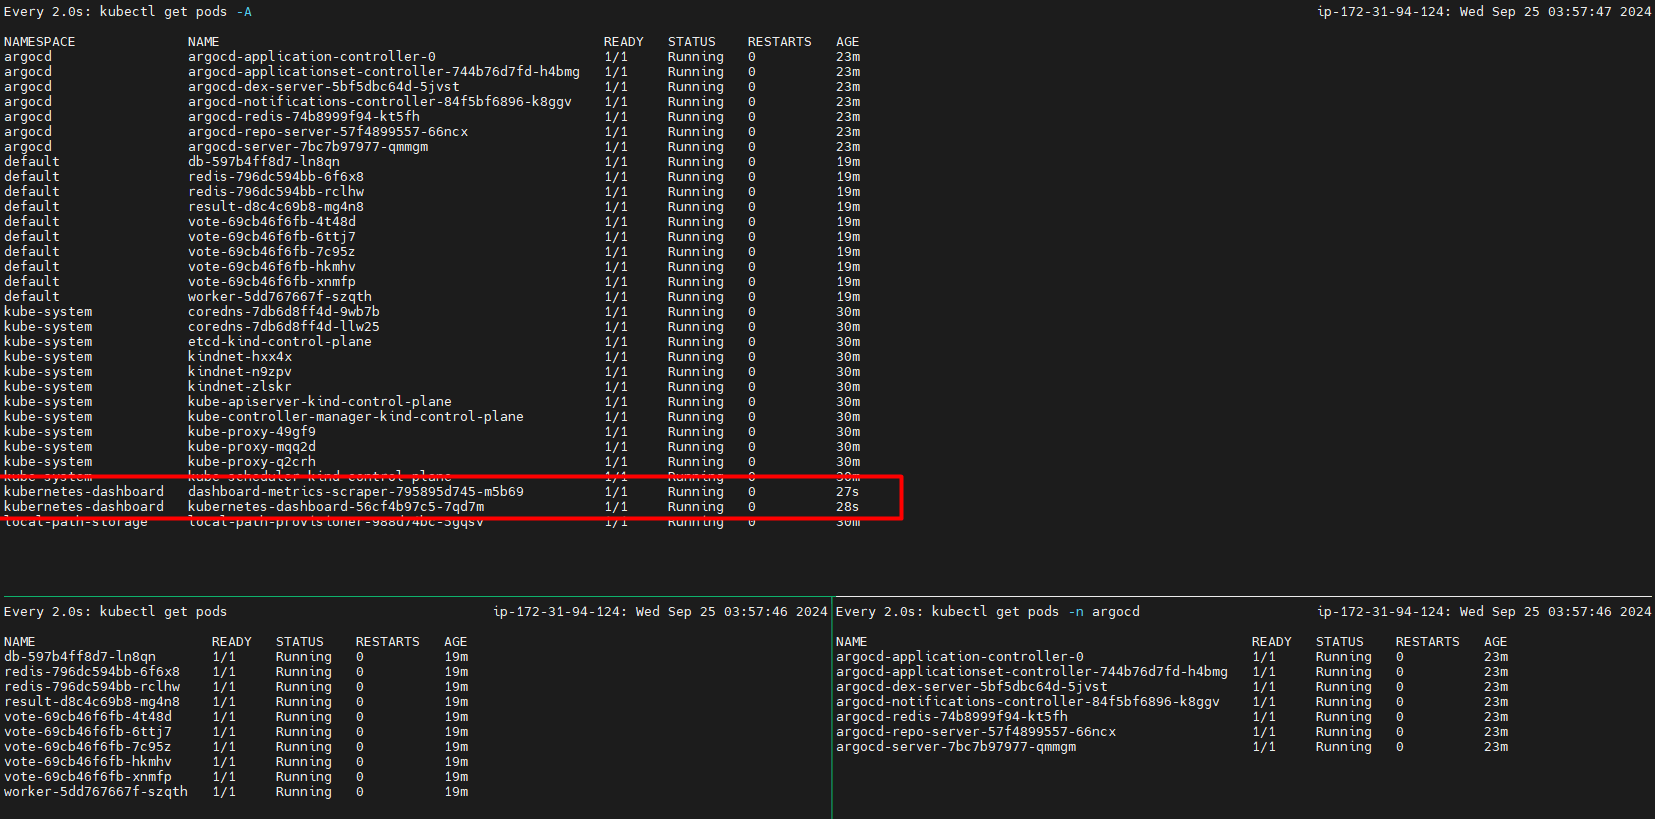
Create a admin user for Kubernetes dashboard: dashboard-adminuser.yml
sudo tee dashboard-adminuser.yml > /dev/null <<EOF
apiVersion: v1
kind: ServiceAccount
metadata:
  name: admin-user
  namespace: kubernetes-dashboard
---
apiVersion: rbac.authorization.k8s.io/v1
kind: ClusterRoleBinding
metadata:
  name: admin-user
roleRef:
  apiGroup: rbac.authorization.k8s.io
  kind: ClusterRole
  name: cluster-admin
subjects:
- kind: ServiceAccount
  name: admin-user
  namespace: kubernetes-dashboard
EOF
kubectl apply -f dashboard-adminuser.yml
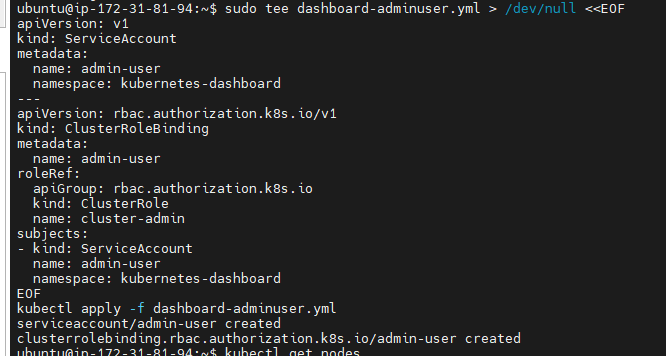
ubuntu@ip-172-31-81-94:~$ kubectl get namespace
NAME                   STATUS   AGE
argocd                 Active   23m
default                Active   23m
kube-node-lease        Active   23m
kube-public            Active   23m
kube-system            Active   23m
kubernetes-dashboard   Active   23m
local-path-storage     Active   23m
monitoring             Active   23m
Create a token for dashboard access:
kubectl -n kubernetes-dashboard create token admin-user

token:
eyJhbGciOiJSUzI1NiIsImtpZCI6ImVUMnZfV3dTVFRZVmw4Z2ZUOXRtY0ZiUVVDY1ZYb2R1VTdLaXh3LWxVa2cifQ.eyJhdWQiOlsiaHR0cHM6Ly9rdWJlcm5ldGVzLmRlZmF1bHQuc3ZjLmNsdXN0ZXIubG9jYWwiXSwiZXhwIjoxNzI3MzIzOTU5LCJpYXQiOjE3MjczMjAzNTksImlzcyI6Imh0dHBzOi8va3ViZXJuZXRlcy5kZWZhdWx0LnN2Yy5jbHVzdGVyLmxvY2FsIiwianRpIjoiY2M3NzBhMWUtN2VlNi00Y2UwLTg4YzEtODk2NWUwYjExODc3Iiwia3ViZXJuZXRlcy5pbyI6eyJuYW1lc3BhY2UiOiJrdWJlcm5ldGVzLWRhc2hib2FyZCIsInNlcnZpY2VhY2NvdW50Ijp7Im5hbWUiOiJhZG1pbi11c2VyIiwidWlkIjoiNjRkZGY1YWYtZWU5Ny00MmE2LWE0OTctMTZhYTEzOTBjZThlIn19LCJuYmYiOjE3MjczMjAzNTksInN1YiI6InN5c3RlbTpzZXJ2aWNlYWNjb3VudDprdWJlcm5ldGVzLWRhc2hib2FyZDphZG1pbi11c2VyIn0.UqIZ2GMrrpHF6a820JnXW_WSBXSmmg-B70RvTmUhi2iPXyIF9lvbcZpZ0_FmwcsrRamAtE3ZEzJw_K7_8u4eYTMRftNbiUoIyuFk2Dll-EQC47xYXzlcycdJ6gTbYLDfZecP9-IniroIm3qvo9oAiOBO4ftHr1KYcuKYp21kMMmsC6uxxIQ2iwloqLBuqjZT7oUB3T4ooXQo1lQP_4PwzFaDGPe5XYKmsHCefckpkNVpeSyMYkfvGGWPw8AmvqopRCbEK-GxosSZ1R18zGHzdDYQxEsuCLjPC2A4dJYpqT0q4JaKs6IWjd6yo0WS0sKraYN3Xea8sG3dFE1-djbsHQ
Now, we have to port-forward to kubernets dashboard as well.
kubectl get svc -n kubernetes-dashboard

kubectl port-forward svc/kubernetes-dashboard -n kubernetes-dashboard 8080:443 --address=0.0.0.0 &
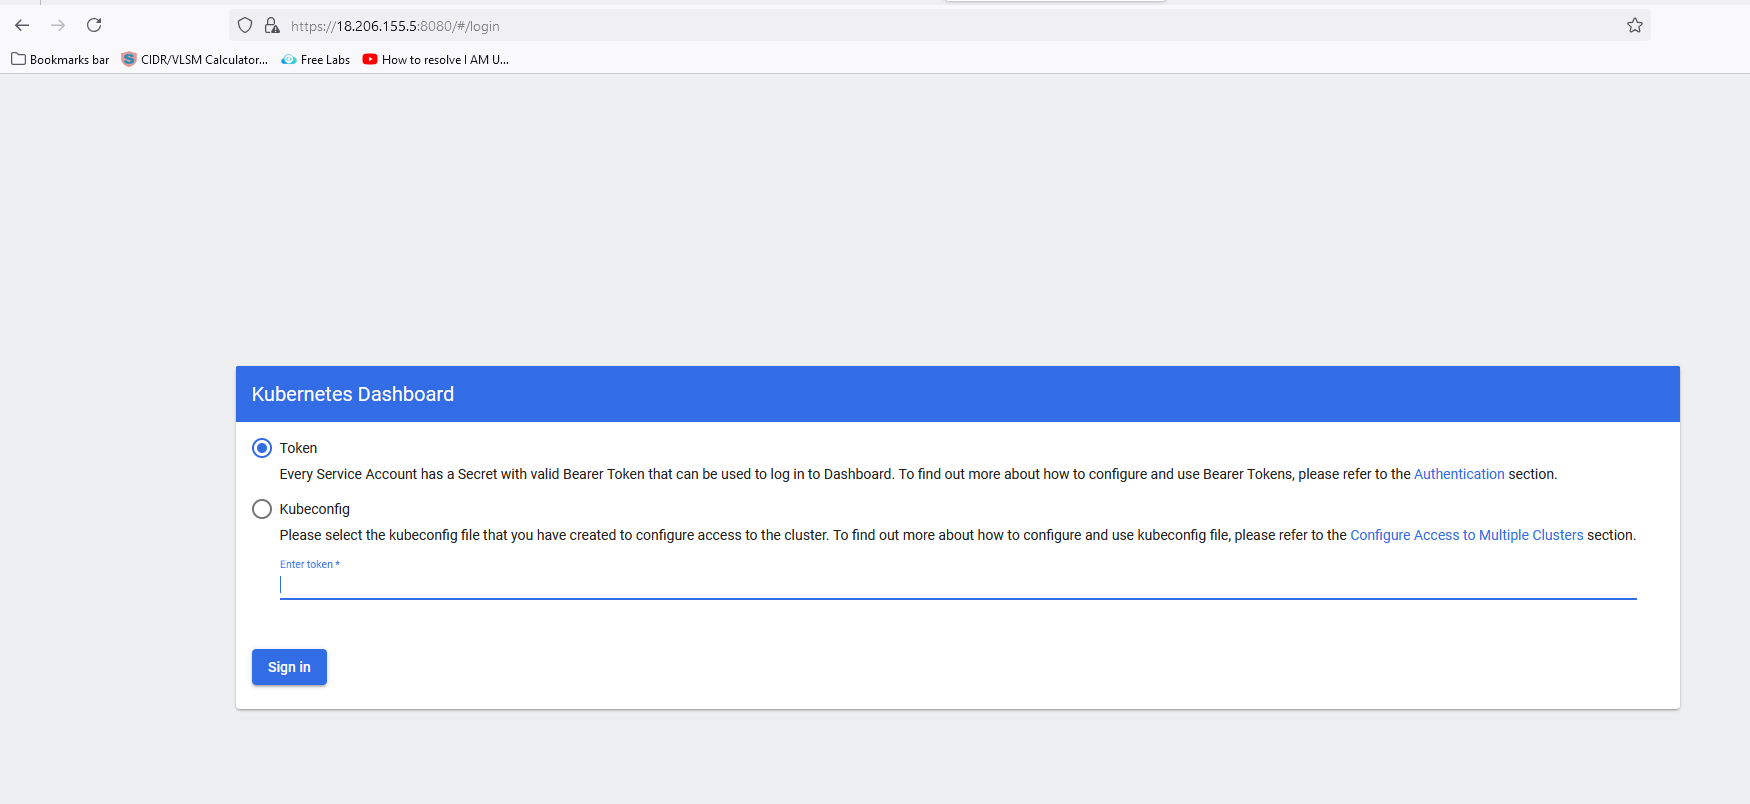
Verify the dashboard in browser.
Now, we will open in browser to access services.
https://<public IP Address of EC2>: 8080
You have to paste the token you generated above.
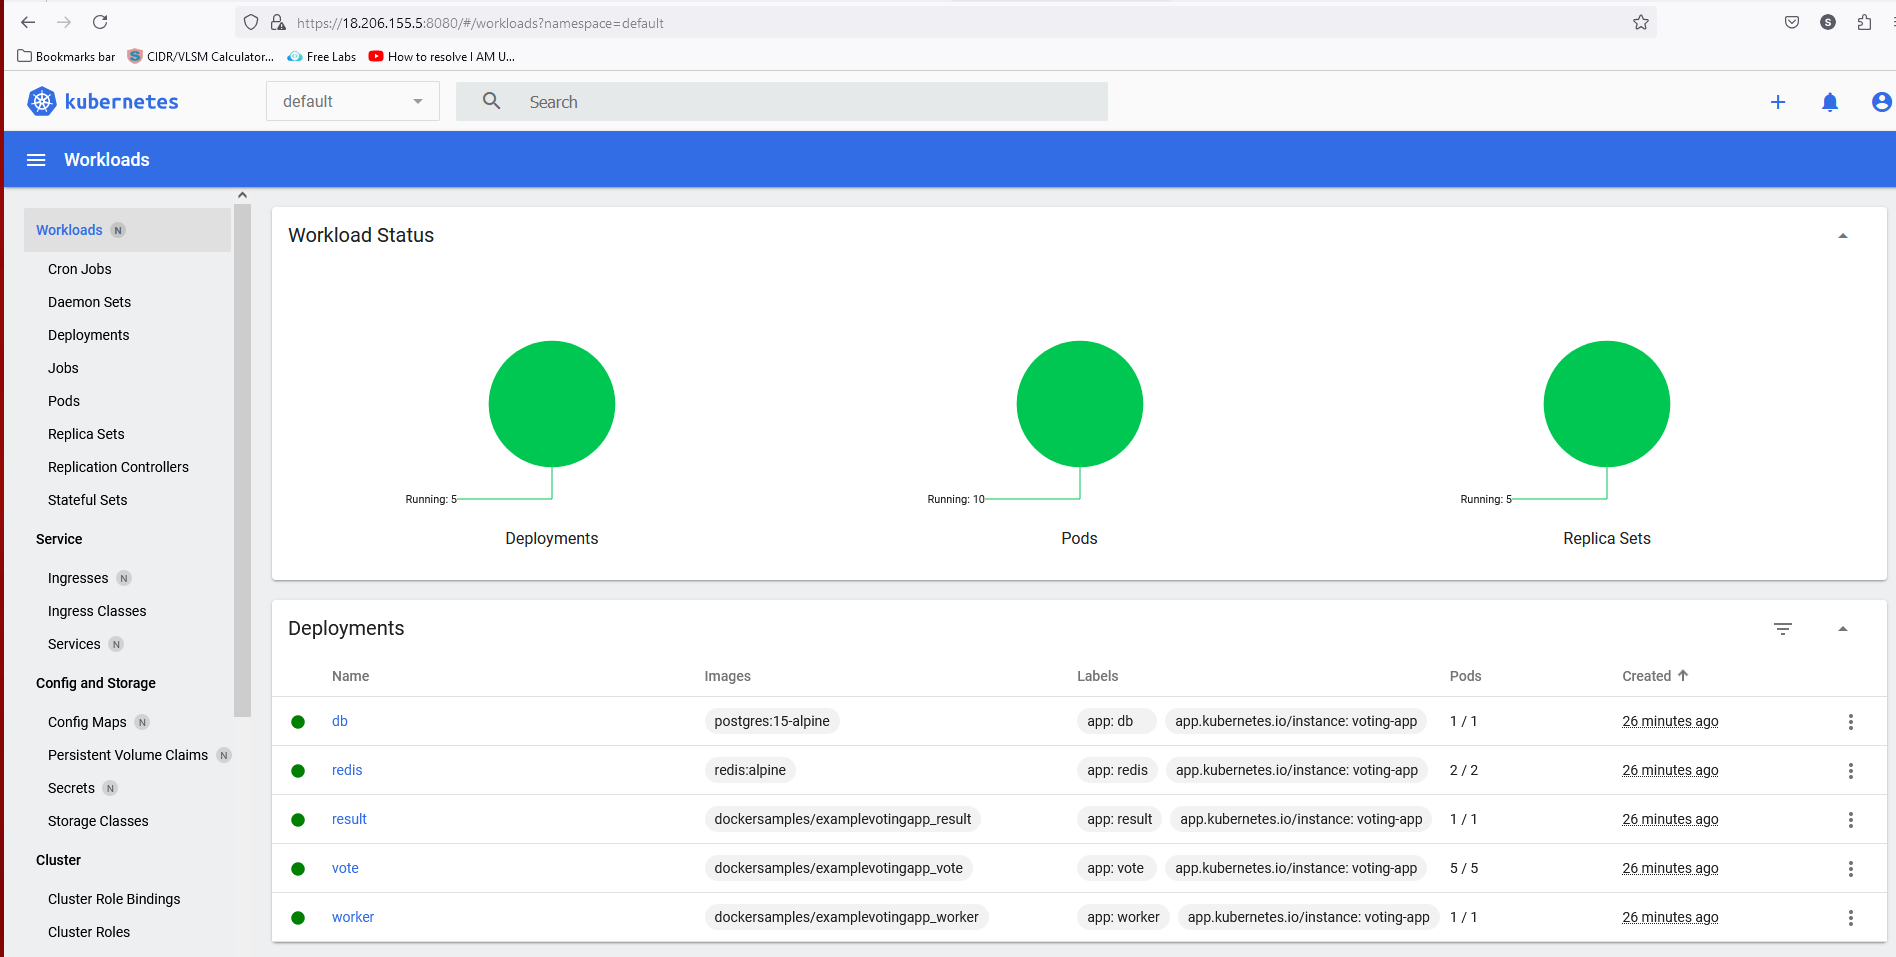
Here is the final dashboard view:
Setting Up the Monitoring
Verify Helm Version
helm version

Verify Prometheus charts in Helm,namespace, and services
kubectl get svc -n monitoring
kubectl get namespace
To view all pods in the monitoring namespace.
kubectl get pods -n monitoring


Over all Pods details
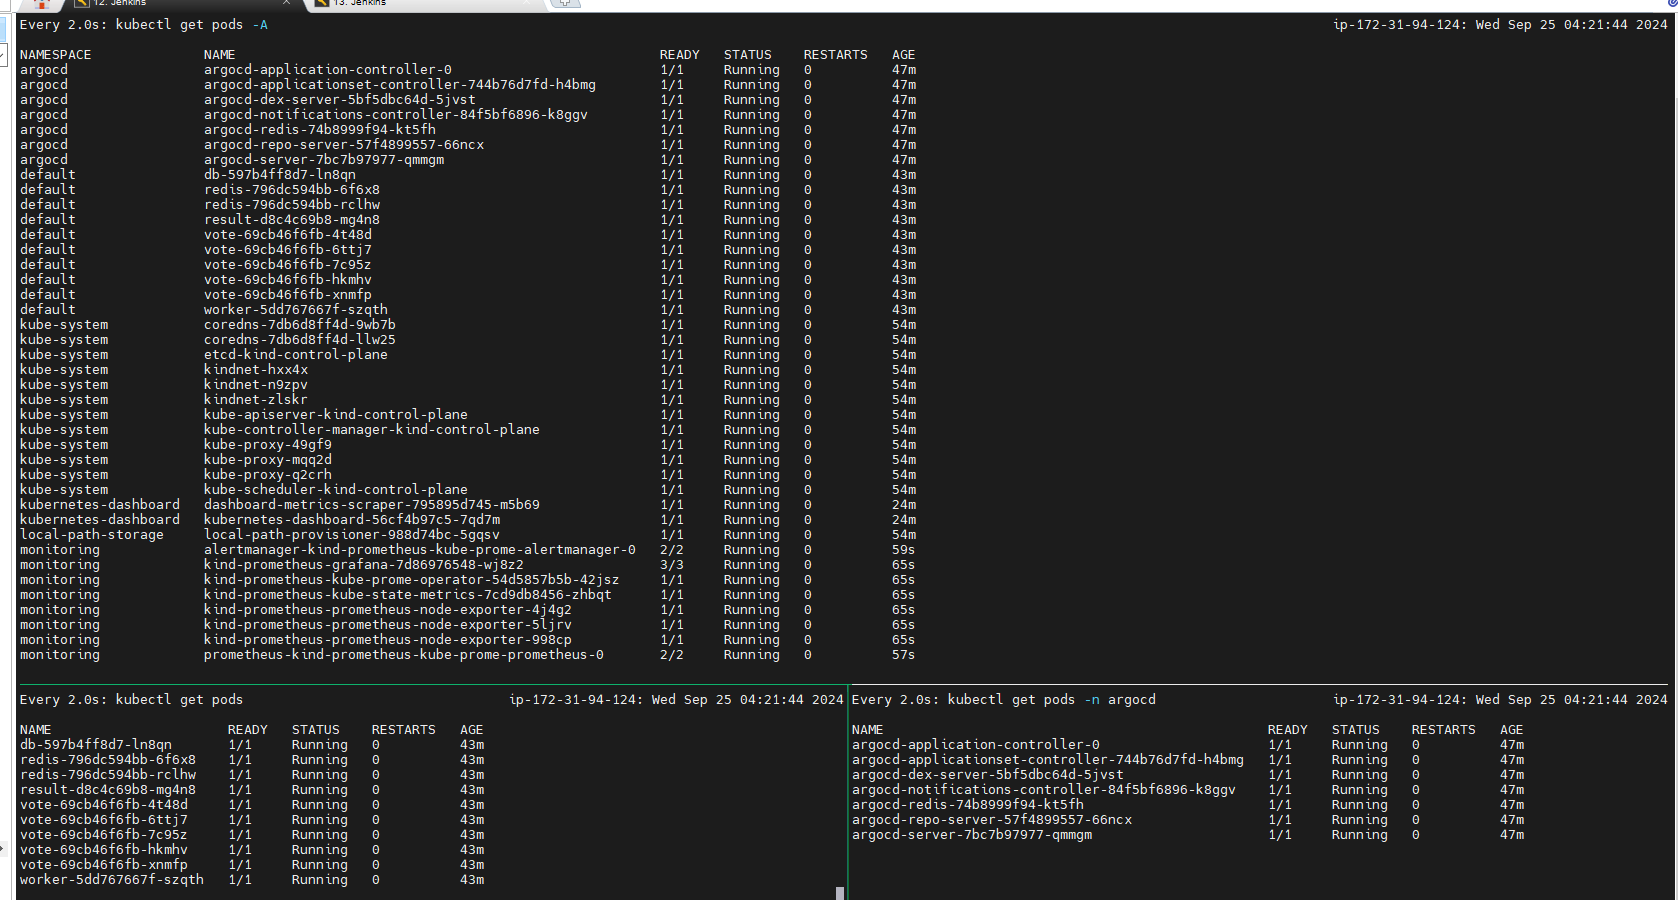
Now, we have to port-forward for kind-prometheus-kube-prome-prometheus & kind-prometheus-grafana
kubectl get svc -n monitoring
 kubectl get svc -n monitoring
NAME                                       TYPE        CLUSTER-IP     EXTERNAL-IP   PORT(S)                         AGE
alertmanager-operated                      ClusterIP   None           <none>        9093/TCP,9094/TCP,9094/UDP      6m17s
kind-prometheus-grafana                    NodePort    10.96.184.88   <none>        80:31000/TCP                    6m23s
kind-prometheus-kube-prome-alertmanager    NodePort    10.96.44.175   <none>        9093:32000/TCP,8080:31594/TCP   6m23s
kind-prometheus-kube-prome-operator        ClusterIP   10.96.88.60    <none>        443/TCP                         6m23s
kind-prometheus-kube-prome-prometheus      NodePort    10.96.47.99    <none>        9090:30000/TCP,8080:32323/TCP   6m23s
kind-prometheus-kube-state-metrics         ClusterIP   10.96.120.53   <none>        8080/TCP                        6m23s
kind-prometheus-prometheus-node-exporter   NodePort    10.96.34.125   <none>        9100:32001/TCP                  6m23s
prometheus-operated                        ClusterIP   None           <none>        9090/TCP                        6m15s
For Prometheus
kubectl port-forward svc/kind-prometheus-kube-prome-prometheus -n monitoring 9090:9090 --address=0.0.0.0 &
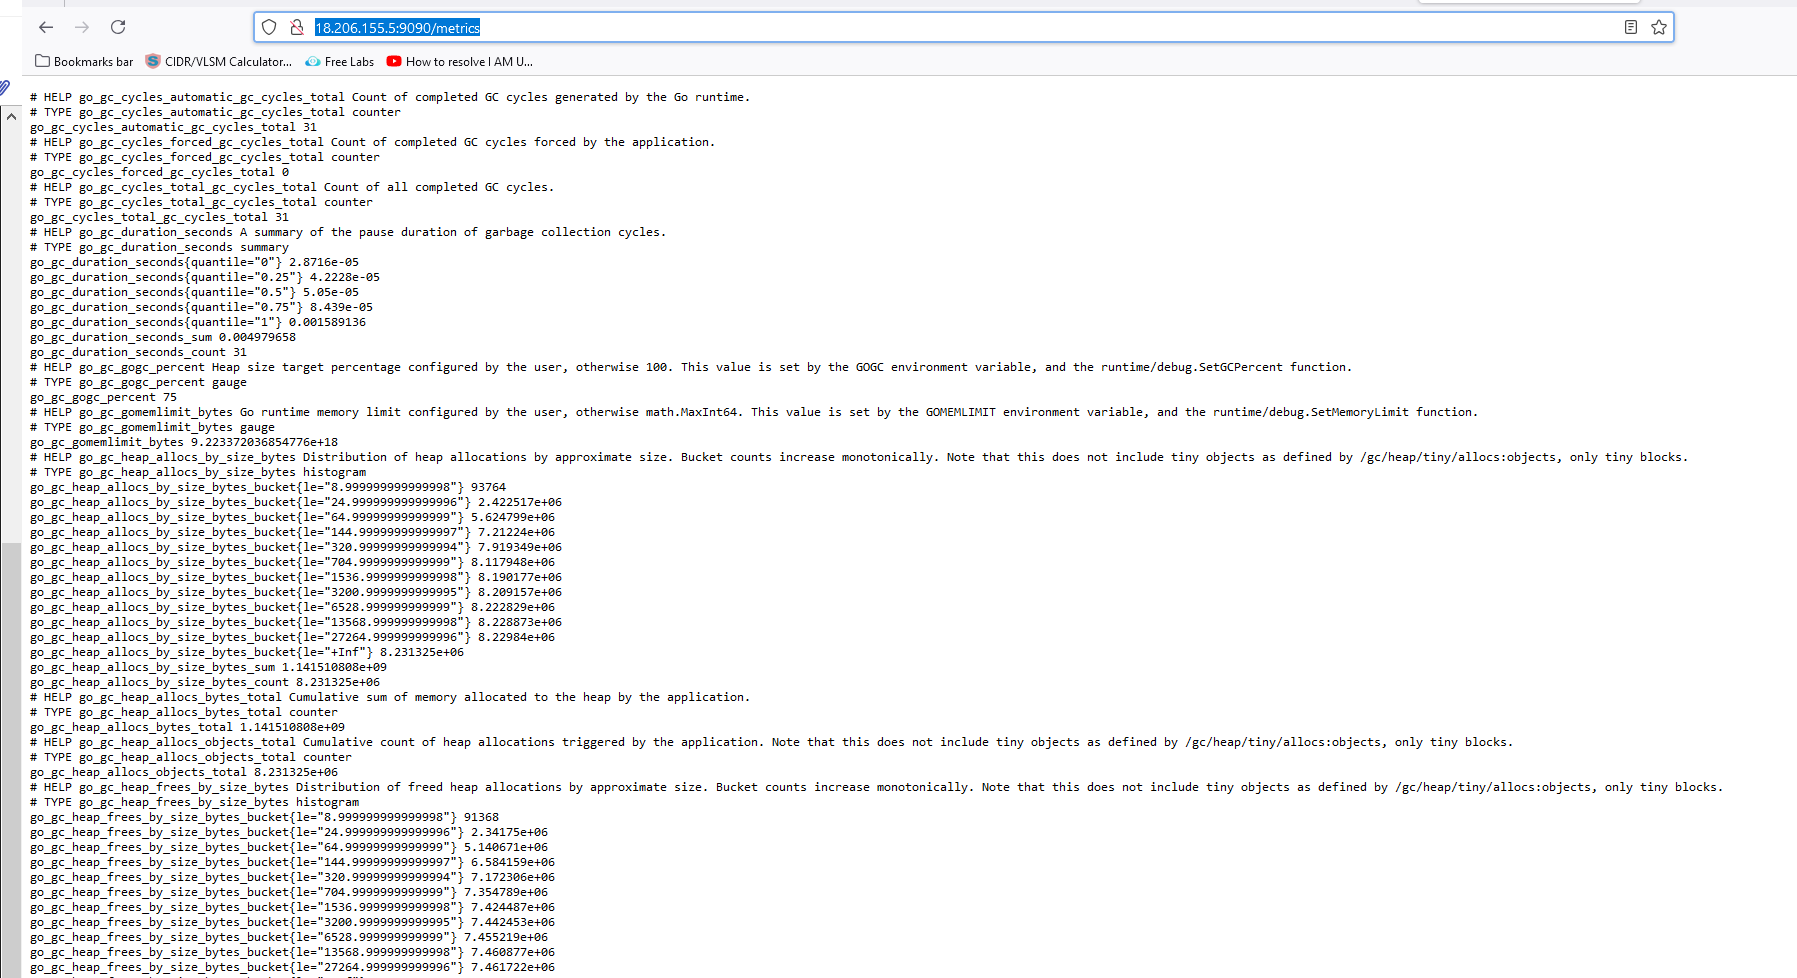
Verify the prometheus in browser.
Now, we will open the browser to access services.http://<public IP Address of EC2>:9090http://<public IP Address of EC2>:9090/metrics # It is sent to Prometheus http://18.206.155.5:9090/metrics

Prometheus Queries
paste the below query in expression on Prometheus and click on execute

sum (rate (container_cpu_usage_seconds_total{namespace="default"}[1m])) / sum (machine_cpu_cores) * 100
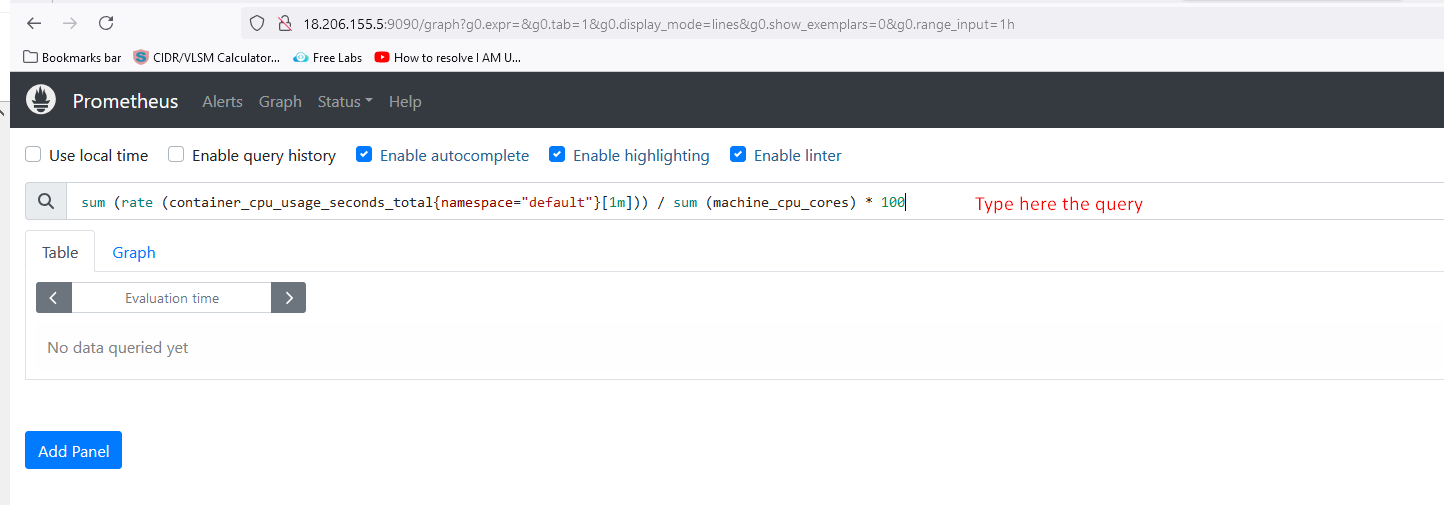
Now, click on the graph after executing the command
For network query-
sum(rate(container_network_receive_bytes_total{namespace="default"}[5m])) by (pod)
sum(rate(container_network_transmit_bytes_total{namespace="default"}[5m])) by (pod)
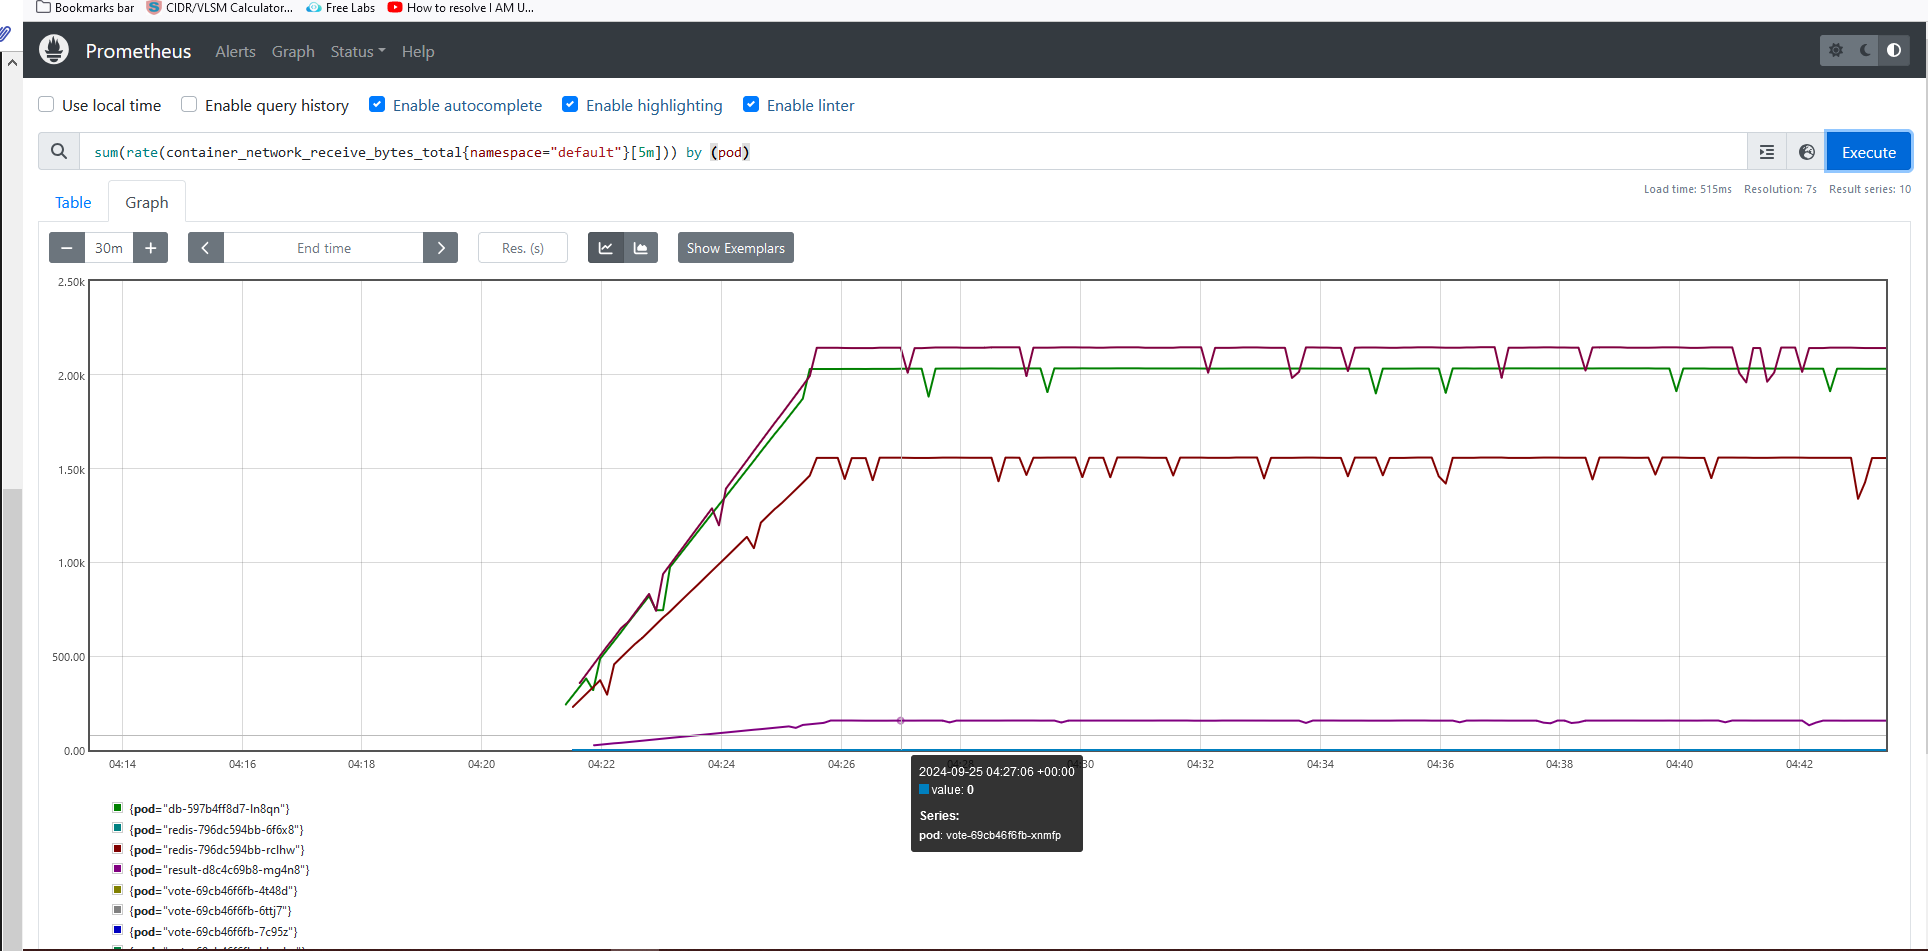
Now, we will use our vote service to see the traffic in prometheous.
kubectl get svc
NAME         TYPE        CLUSTER-IP      EXTERNAL-IP   PORT(S)          AGE
db           ClusterIP   10.96.201.0     <none>        5432/TCP         68m
kubernetes   ClusterIP   10.96.0.1       <none>        443/TCP          79m
redis        ClusterIP   10.96.65.124    <none>        6379/TCP         68m
result       NodePort    10.96.177.39    <none>        5001:31001/TCP   68m
vote         NodePort    10.96.239.136   <none>        5000:31002/TCP   68m
Exposing the Voteapp
kubectl port-forward svc/vote 5000:5000 --address=0.0.0.0 &
If it is already exposed then don't need to perform.
Configure the Grafana
kubectl get svc -n monitoring
NAME                                       TYPE        CLUSTER-IP     EXTERNAL-IP   PORT(S)                         AGE
alertmanager-operated                      ClusterIP   None           <none>        9093/TCP,9094/TCP,9094/UDP      33m
kind-prometheus-grafana                    NodePort    10.96.184.88   <none>        80:31000/TCP                    33m
kind-prometheus-kube-prome-alertmanager    NodePort    10.96.44.175   <none>        9093:32000/TCP,8080:31594/TCP   33m
kind-prometheus-kube-prome-operator        ClusterIP   10.96.88.60    <none>        443/TCP                         33m
kind-prometheus-kube-prome-prometheus      NodePort    10.96.47.99    <none>        9090:30000/TCP,8080:32323/TCP   33m
kind-prometheus-kube-state-metrics         ClusterIP   10.96.120.53   <none>        8080/TCP                        33m
kind-prometheus-prometheus-node-exporter   NodePort    10.96.34.125   <none>        9100:32001/TCP                  33m
prometheus-operated                        ClusterIP   None           <none>        9090/TCP                        33m
For grafana (expose port)
kubectl port-forward svc/kind-prometheus-grafana -n monitoring 3000:80 --address=0.0.0.0 &
Verify the Grafana in browser.
Now, we will open the browser to access services.http://<public IP Address of EC2>:3000
http://18.206.155.5:3000
username: admin
Password: prom-operator
Note--> In Grafana, we have to add data sources and create a dashboard.
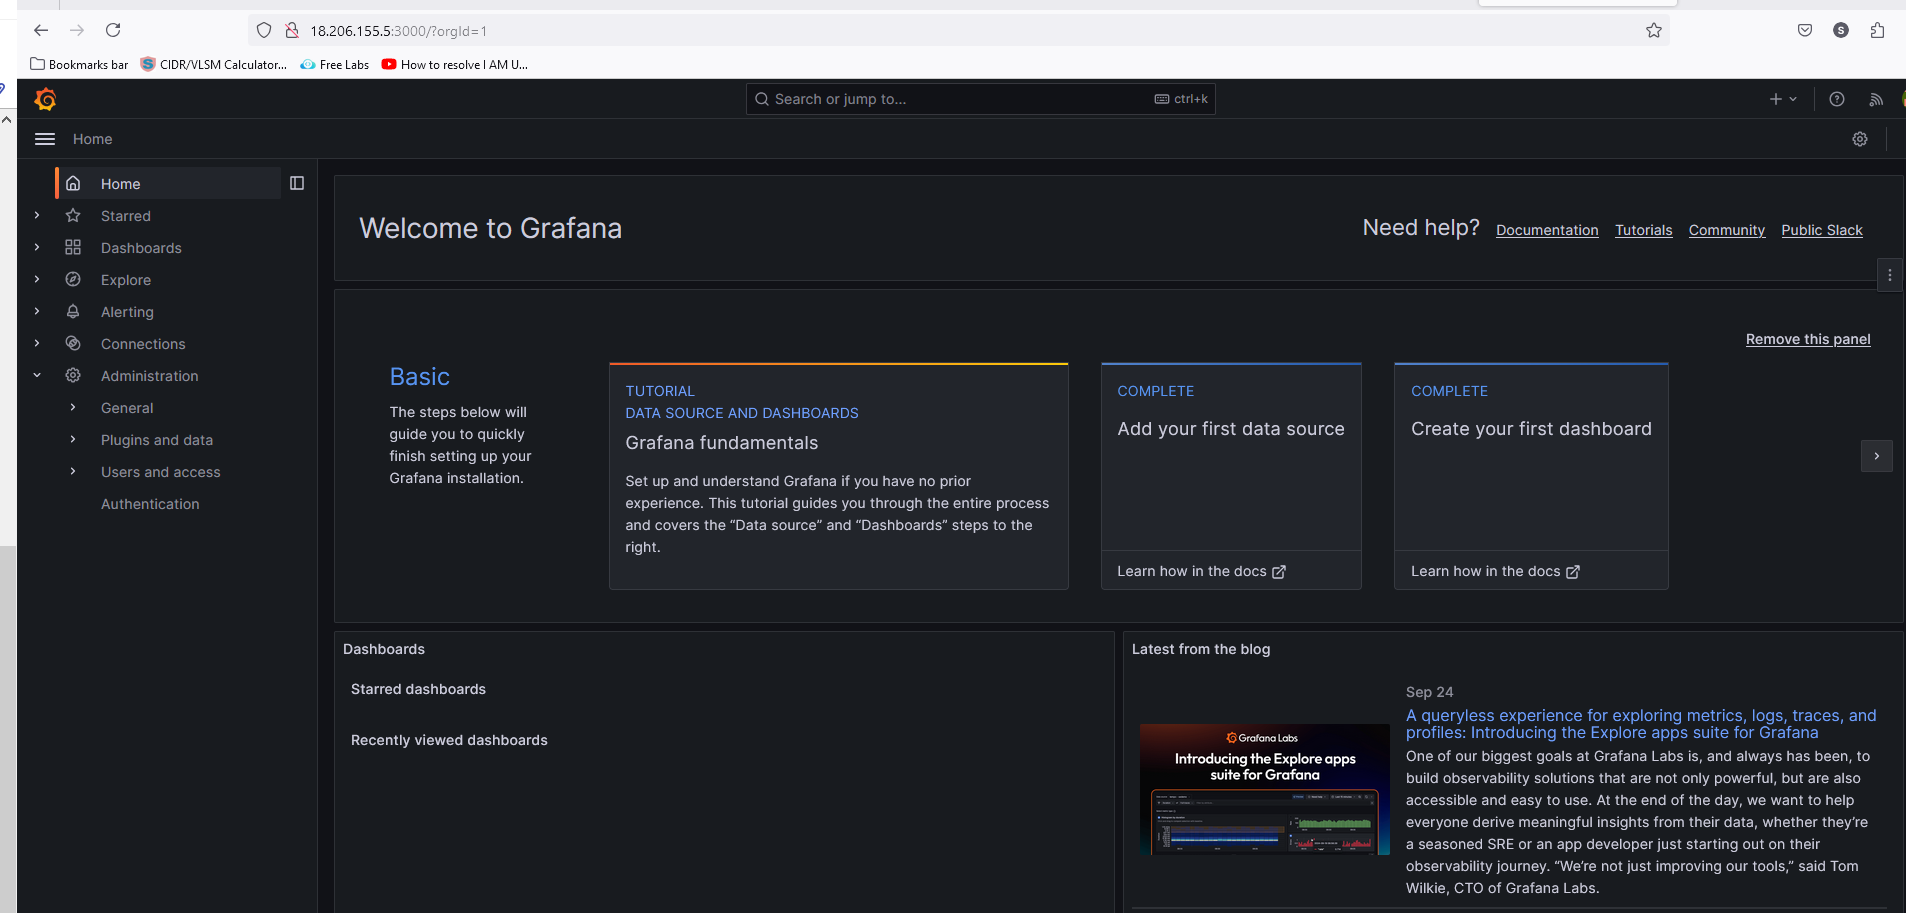
Creating a user in Grafana
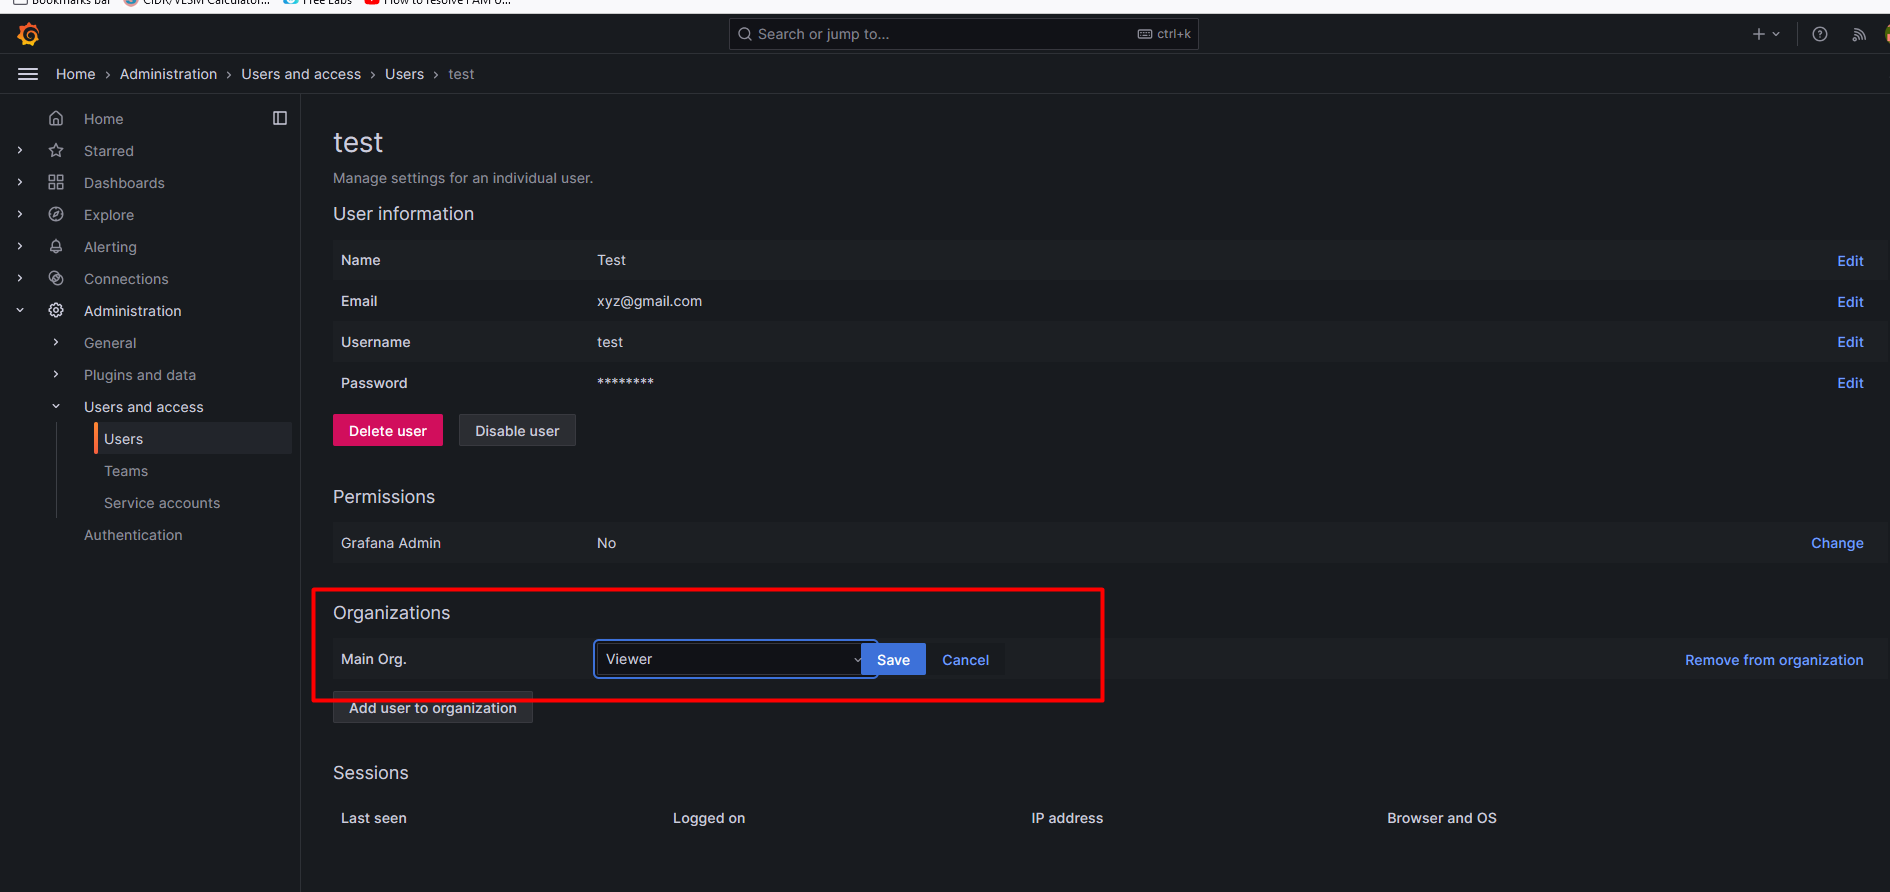
Now, we will create a test user and will give permission accordingly.
Home> Administration> Users and access> Users> create user
You can change the role as well, as per the below screenshot.
Creating a dashboard in Grafana
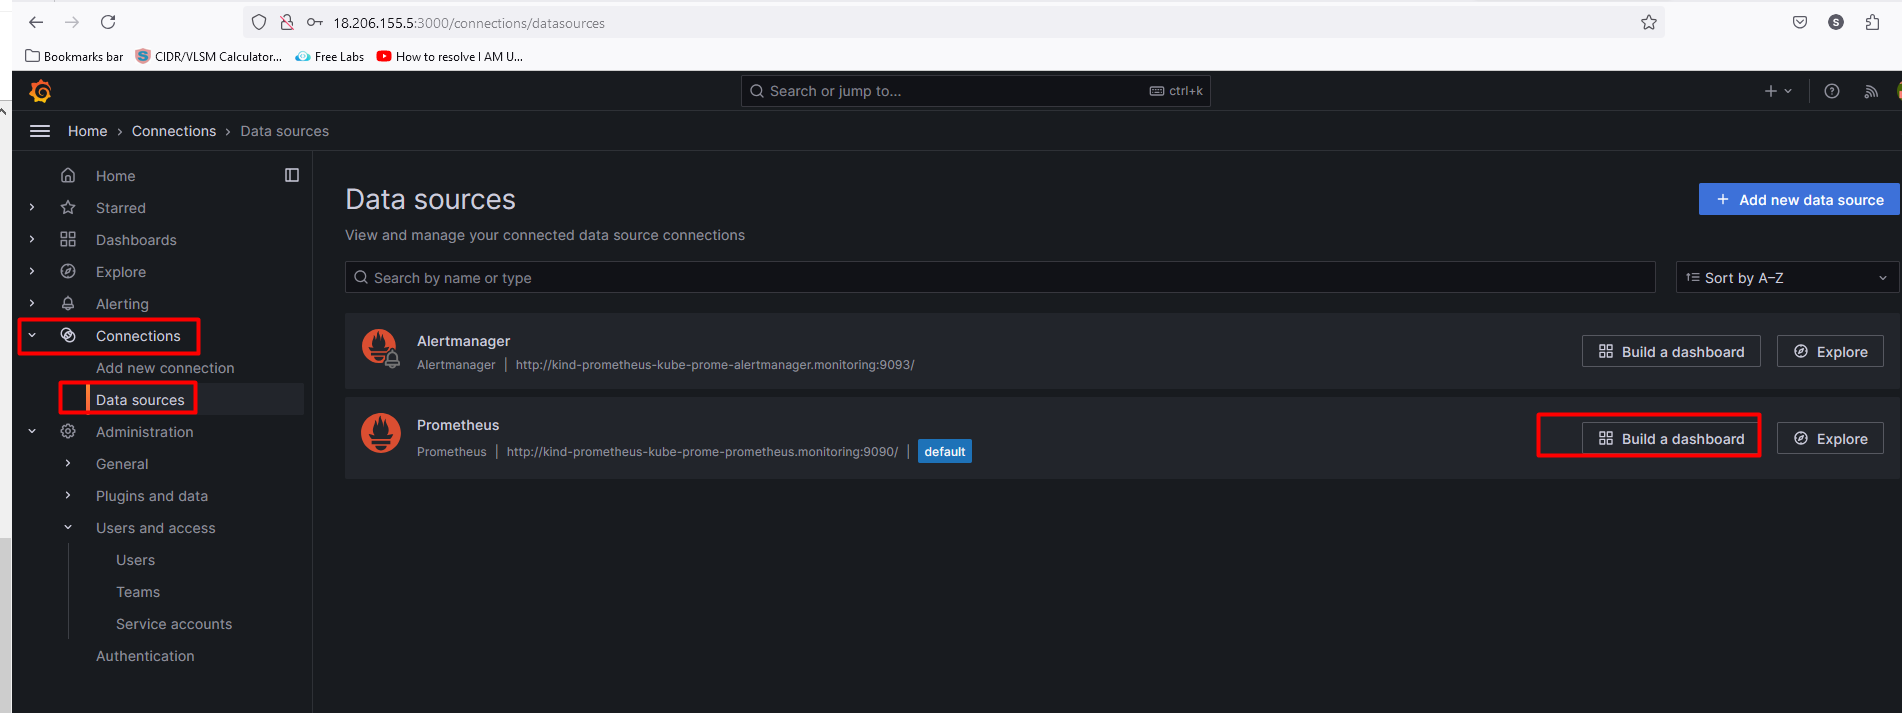
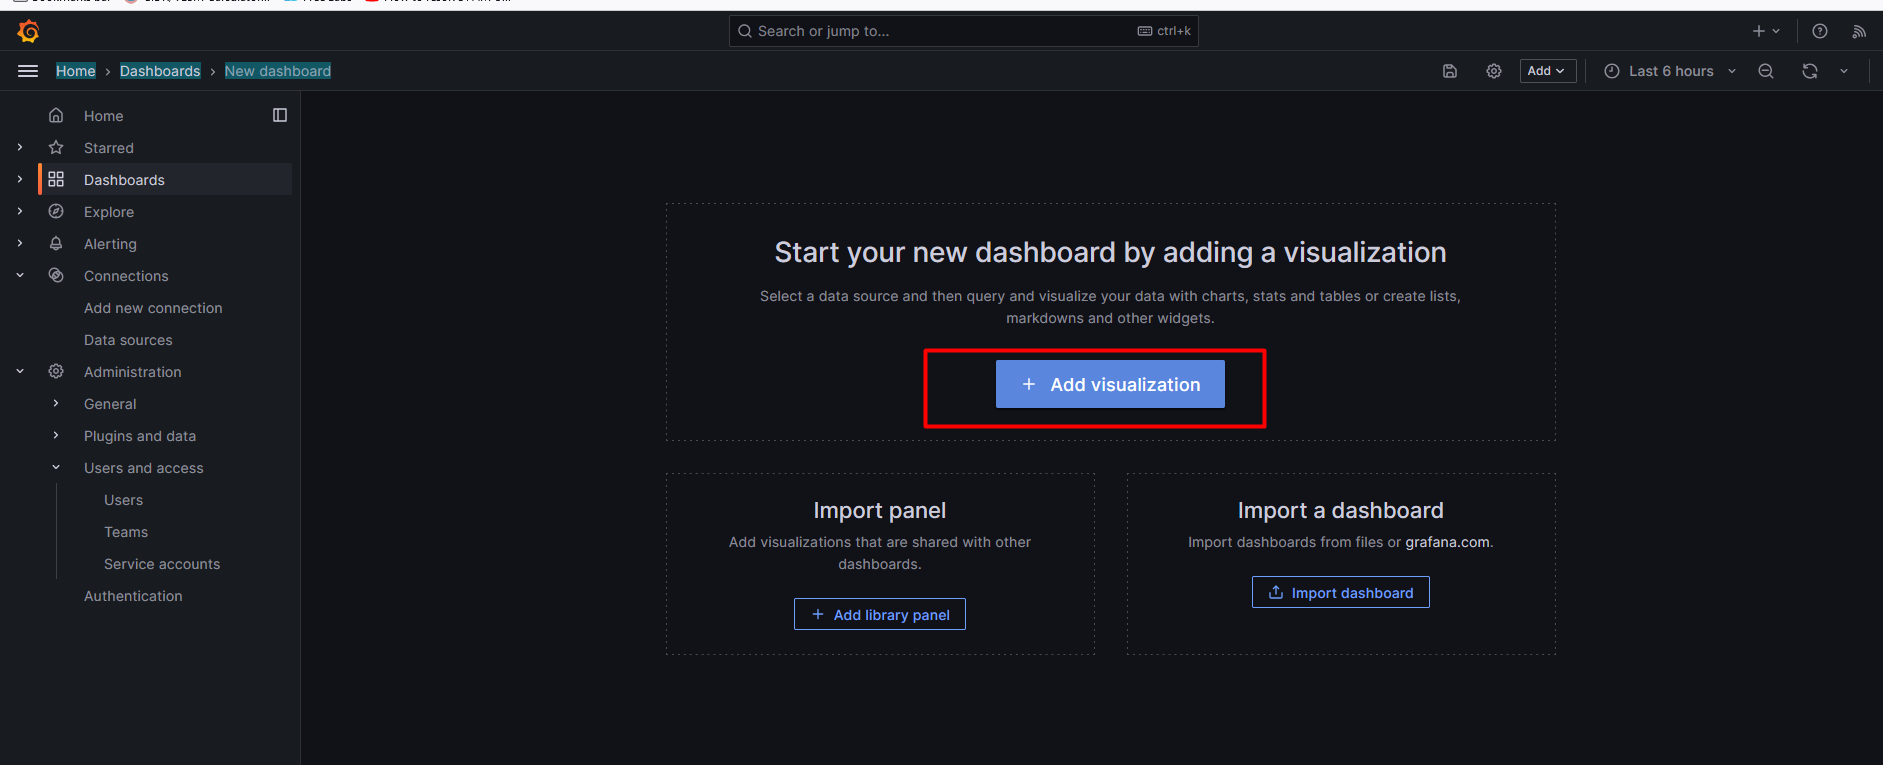
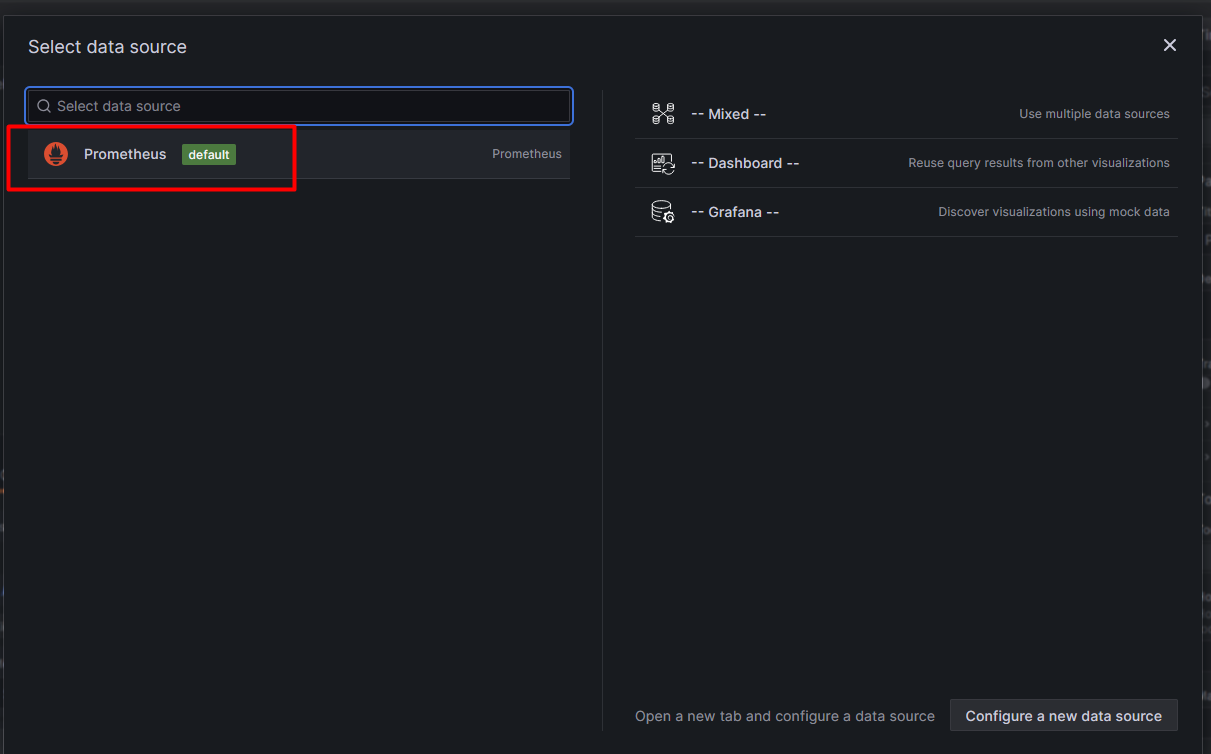
Home> Connections> Data sources >Build a dashboard>add visualization> Select the Prometheus
select the matrix, and label filter... Hit on run query>click save.
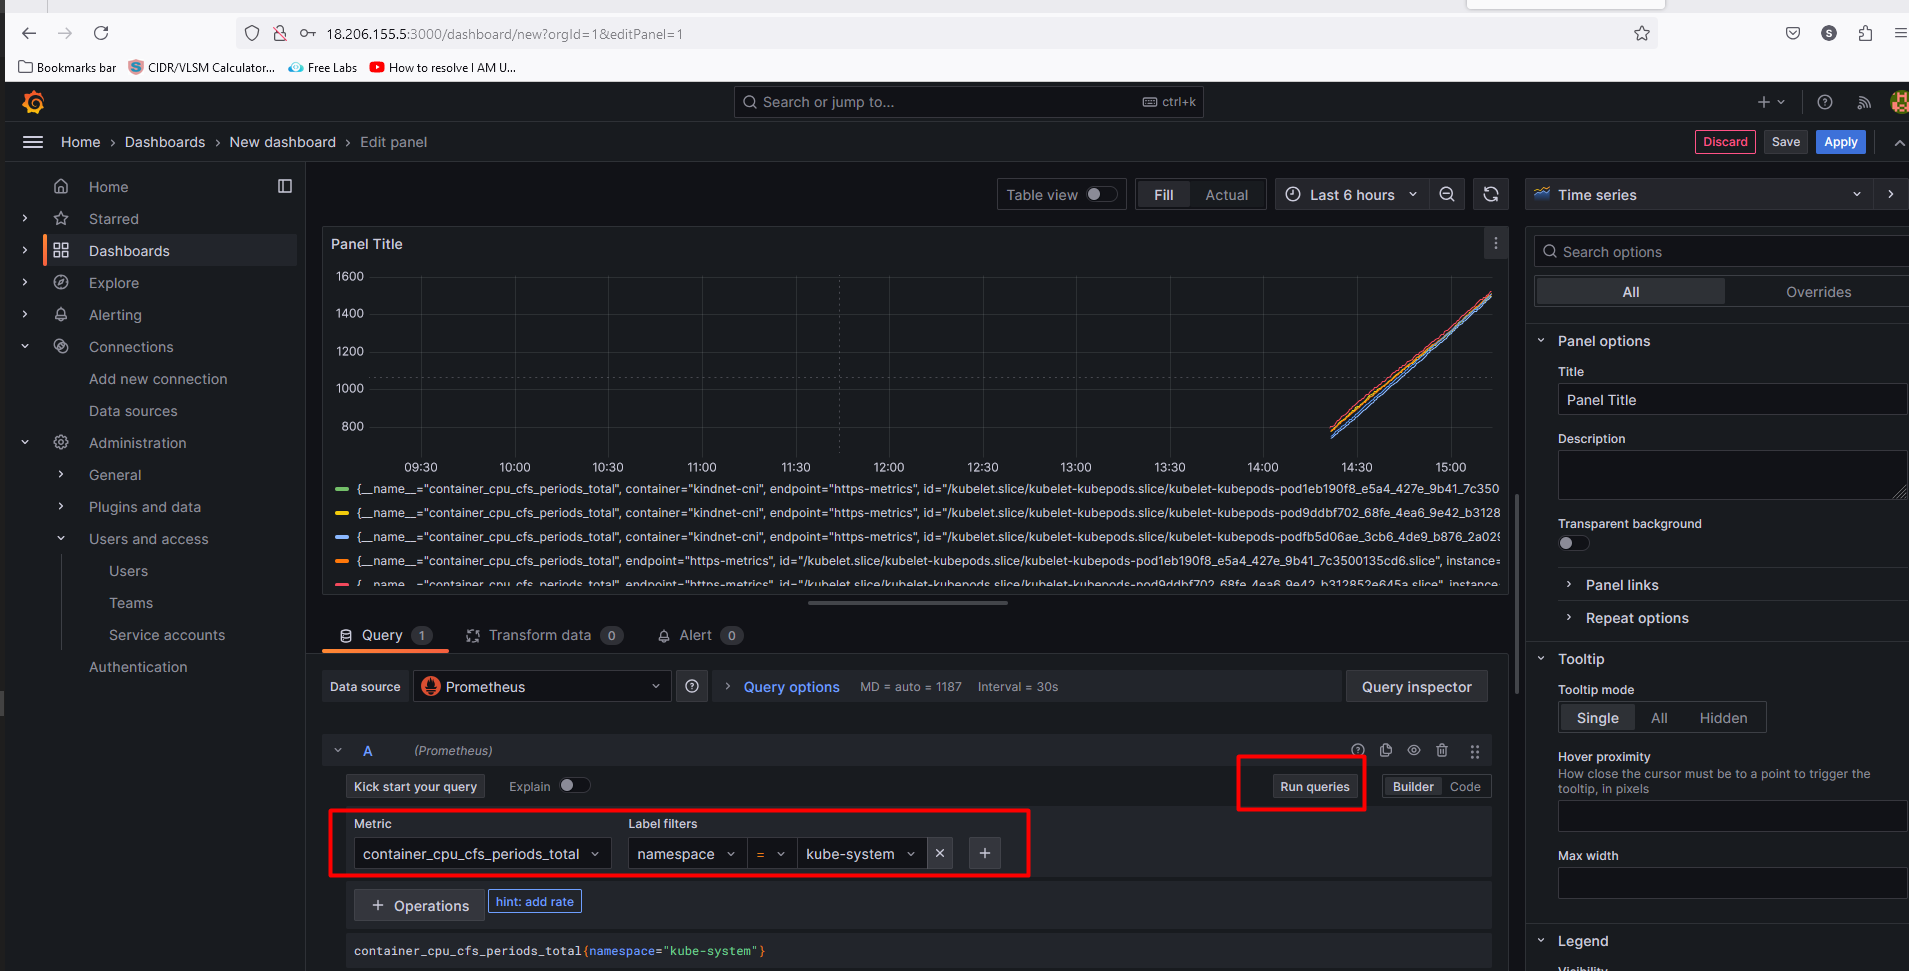
If you want to use the custom dashboard then do- open Google and reach "
grafana dashboard"I choose this dashboard Click onCopy ID to clickboard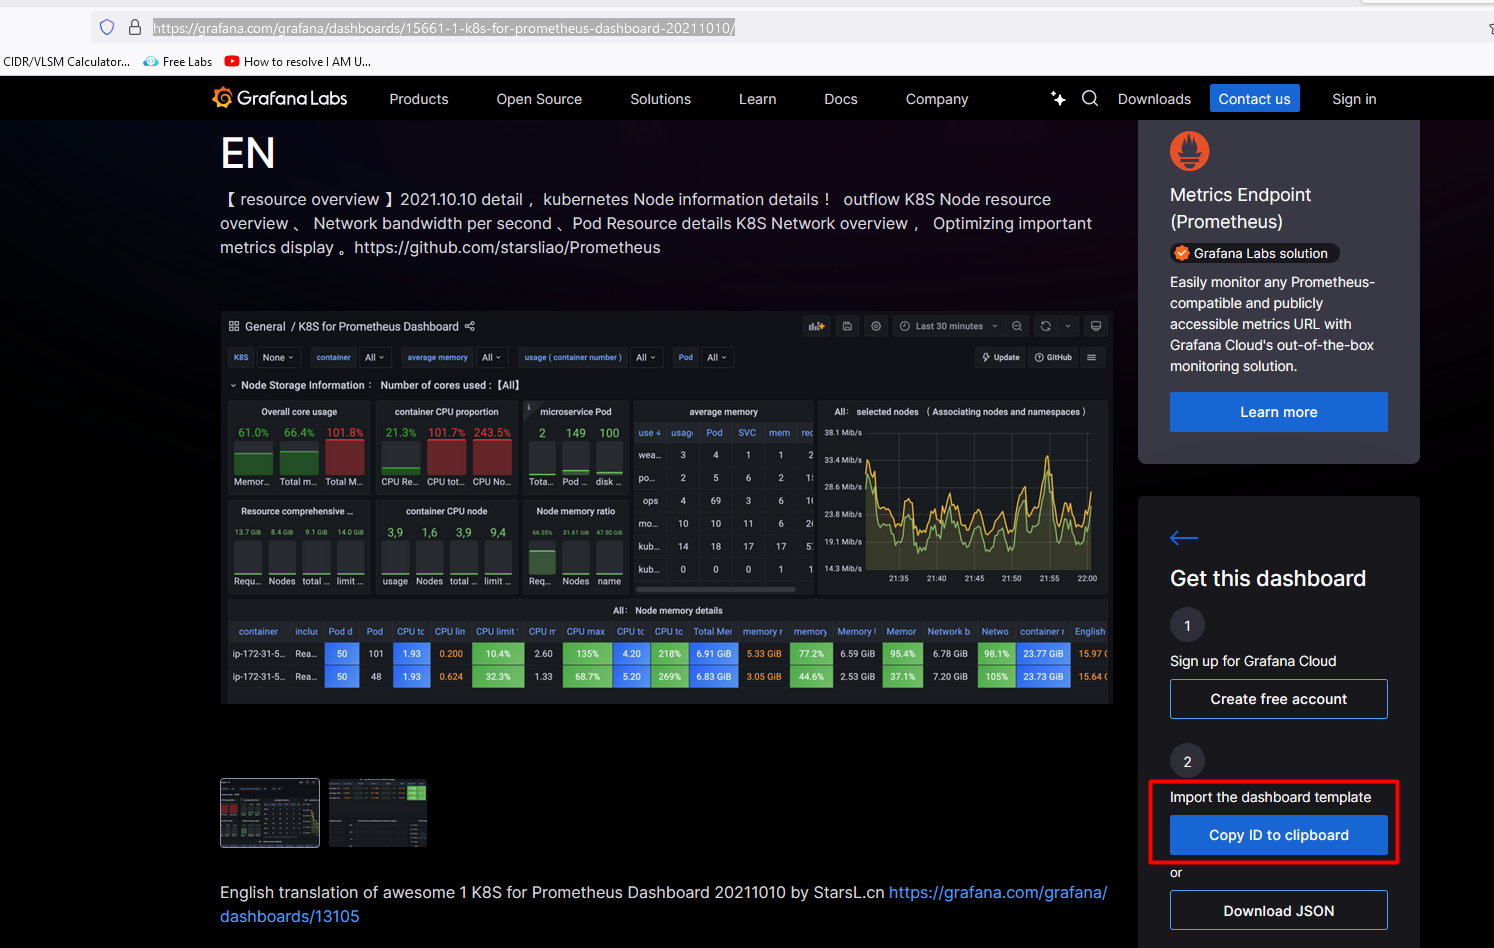
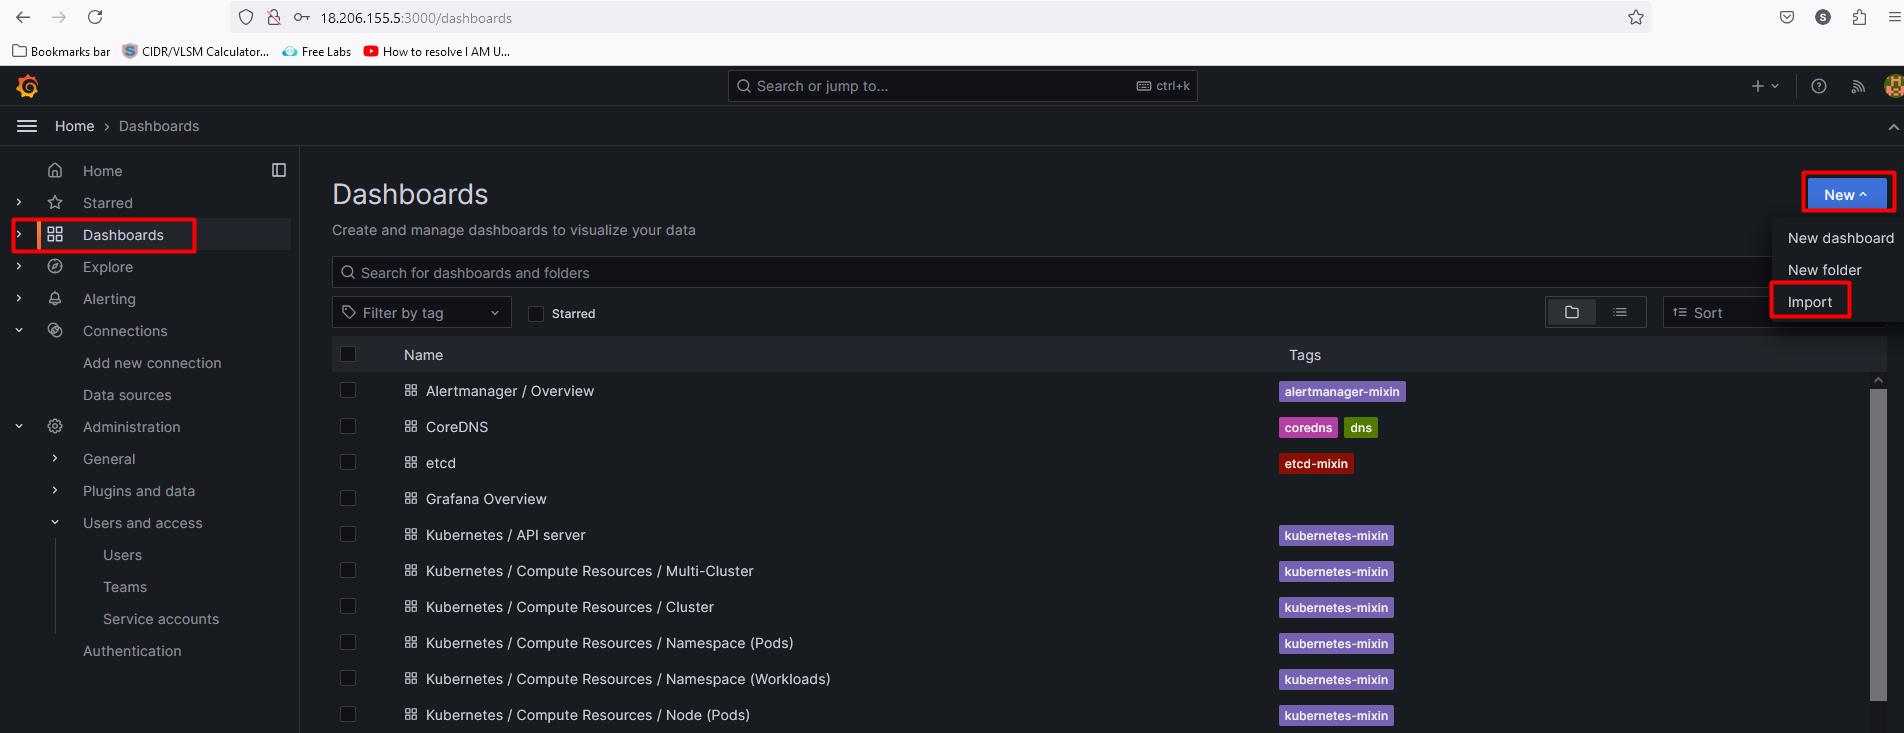
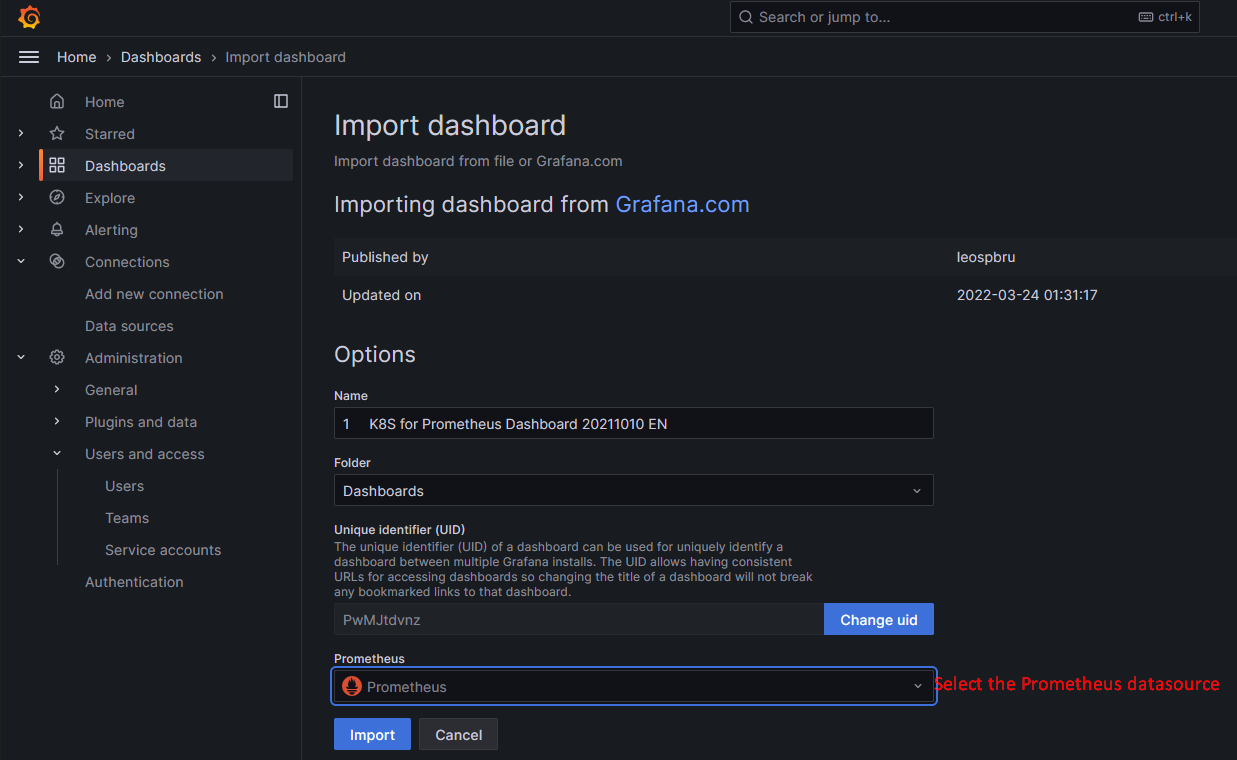
Now, go to the Grafana dashboard. click on new> select Import> type the dashboard ID "15661" and click on load> select the Prometheus as a data source and click on import.
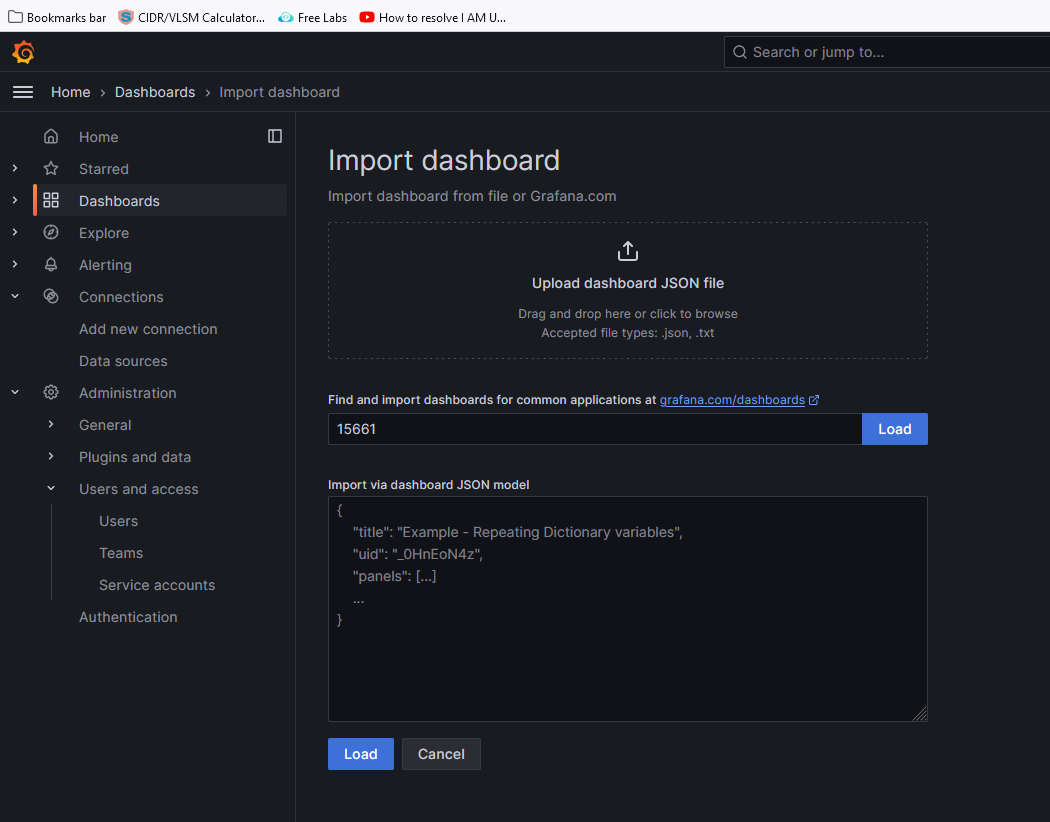
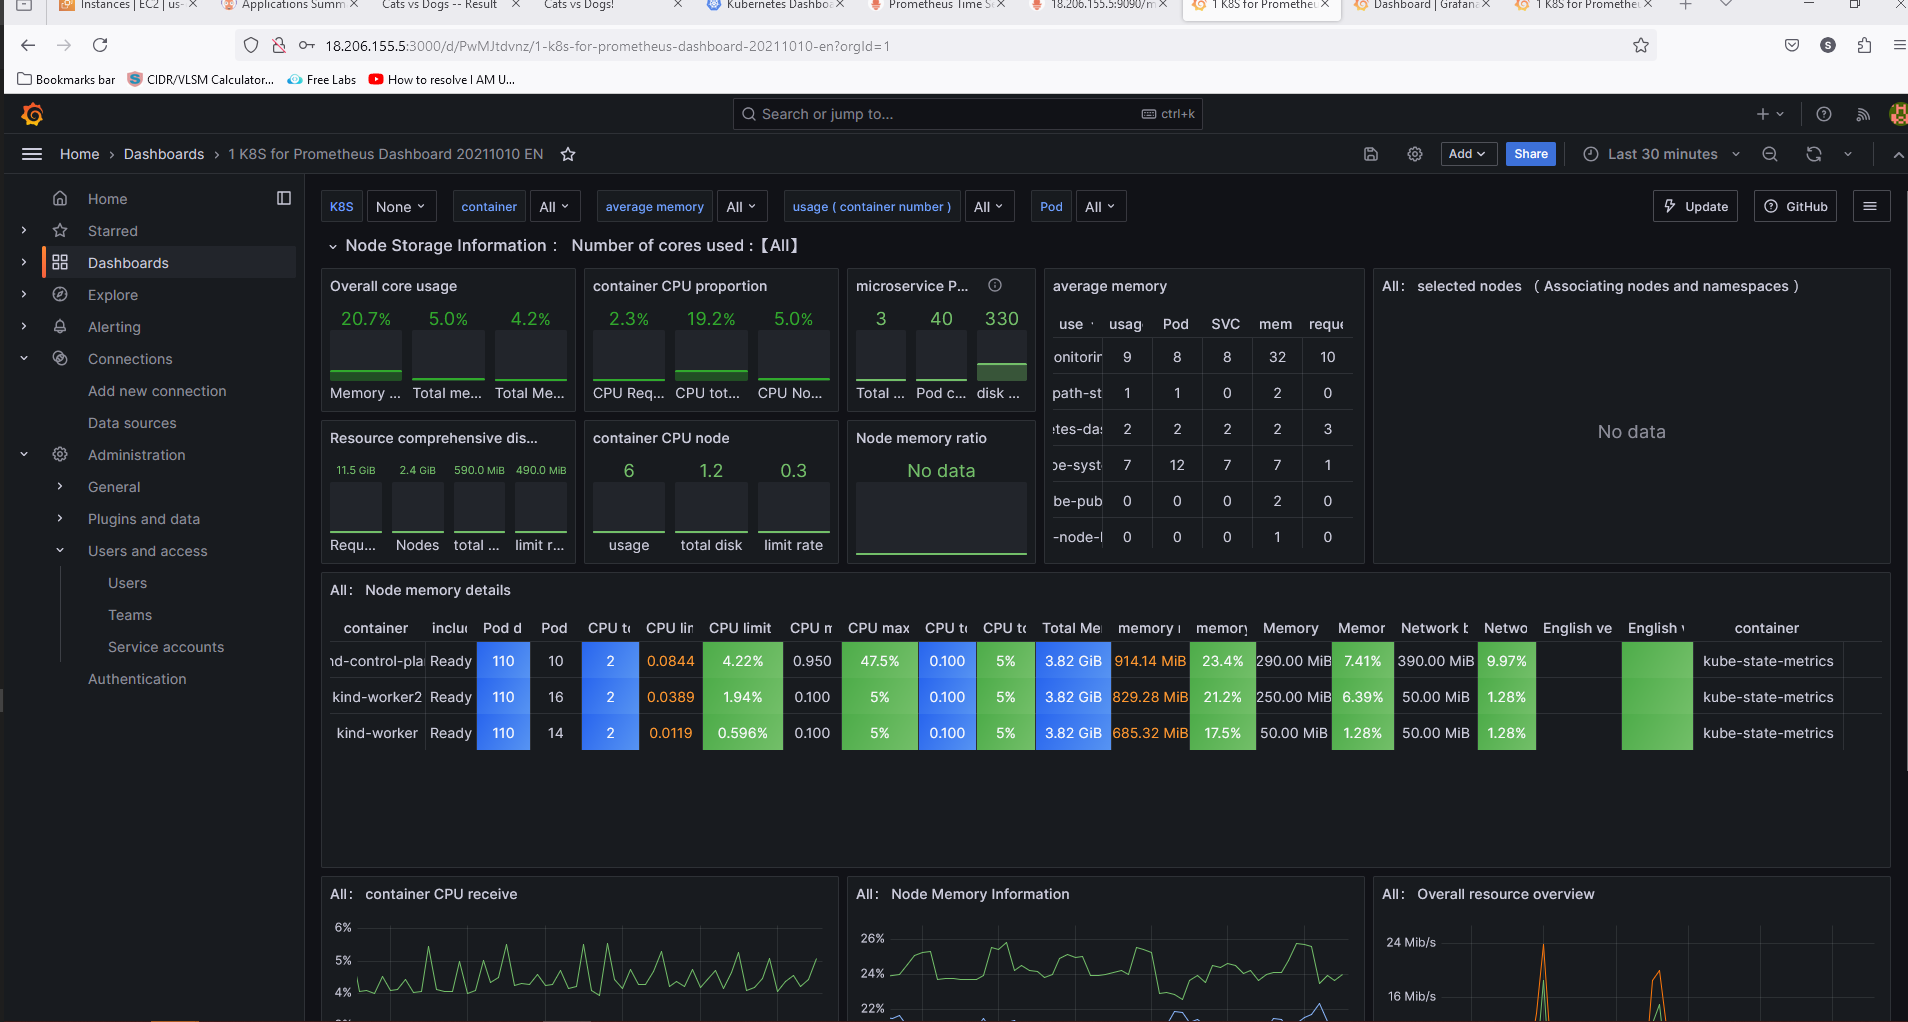
Final Dashboard
AWS Resources:

Environment Cleanup:
Delete ArgoCD
To remove ArgoCD resources, it is recommended to delete the corresponding argocd namespace within the Kubernetes environment. This can be achieved by executing the following command:
kubectl delete namespace argocdDelete KinD Cluster
Once you have completed your testing, you may delete the KinD cluster by executing the following command, which will remove the associated Docker containers and volumes.
kind delete cluster --name argocdNote⇒:It is critical that the name of the cluster to be destroyed be supplied. In the current demonstration, a cluster with the name argocd was established, hence the same name must be supplied during the deletion procedure. Failure to supply the cluster name would result in the deletion of the default cluster, even though it does not exist. It is crucial to note that in such a scenario, no error notice will be provided, and the prompt will state that the cluster was successfully deleted. To minimize any potential interruption to test pipelines, we have conducted conversations with the KinD maintainers team and agreed that it is critical to mention the actual name of the cluster when deletion.
Time to delete the Virtual machine.
Note- As we are using Terraform, we will use the following command to delete the environment
Go to folder "12.Real-Time-DevOps-Project/Terraform_Code" and run the Terraform command.
  cd Terraform_Code/

  $ ls -l
  Mode                 LastWriteTime         Length Name
  ----                 -------------         ------ ----
  da---l          25/09/24   9:48 PM                Terraform_Code

  Terraform destroy --auto-approve
Key Takeaways
Prometheus for Metrics Collection: It's a time-series database that scrapes data from Kubernetes services.
Grafana for Visualization: Allows you to create beautiful dashboards from the metrics data stored in Prometheus.
Real-Time Monitoring: You can observe real-time performance metrics for CPU, memory, and network using the dashboards.
GitOps with ArgoCD: ArgoCD makes deploying and managing applications on Kubernetes easier by automating continuous deployment.
What to Avoid
Incorrect Port Forwarding: Make sure you expose the correct ports for both Prometheus (9090) and Grafana (3000). Missing this can lead to connection issues.
Skipping Security Groups Configuration: Always open the necessary ports in your cloud provider's security groups. Otherwise, the services won't be accessible externally.
Not Using PromQL Effectively: PromQL can seem complex, but it's essential to retrieve valuable metrics like CPU or memory usage. Avoid using generic queries without understanding the context of your services.
Benefits of Using This Setup
Improved Observability: Combining Prometheus and Grafana gives you full observability over your Kubernetes clusters.
Real-Time Metrics: You can monitor your services in real-time, making troubleshooting faster and more efficient.
Scalability: This setup grows with your infrastructure, allowing you to monitor large-scale deployments with ease.
Cost-Efficient: Both Prometheus and Grafana are open-source, providing a cost-effective monitoring solution.
Ease of Use: With Grafana's pre-built dashboards and PromQL's flexibility, it’s easy to get started and scale monitoring solutions.
Ref Link
Subscribe to my newsletter
Read articles from Balraj Singh directly inside your inbox. Subscribe to the newsletter, and don't miss out.
Written by

Balraj Singh
Balraj Singh
Tech enthusiast with 15 years of experience in IT, specializing in server management, VMware, AWS, Azure, and automation. Passionate about DevOps, cloud, and modern infrastructure tools like Terraform, Ansible, Packer, Jenkins, Docker, Kubernetes, and Azure DevOps. Passionate about technology and continuous learning, I enjoy sharing my knowledge and insights through blogging and real-world experiences to help the tech community grow!