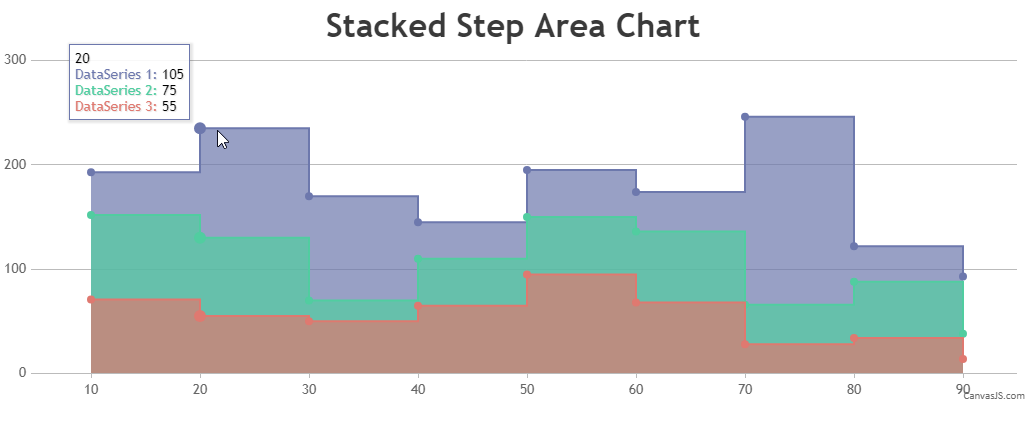
Stacked Stepped Area Chart using CanvasJS React Component
 Ananya Deka
Stacked Stepped Area Charts can be a powerful tool to visualize cumulative data over time, and provides a way to draw comparisons between different data series, by stacking them on top of each other. Values are plotted at discrete intervals, creating a stair-step appearance, and making them visually appealing.
In this article, we will look at how to create these charts in React by using CanvasJS React Component and their in-built stepArea chart type.
Prerequisites
Before we get started, make sure you have the following in place:
node.js
npm (Node Package Manager)
a React project set up (you can use create-react-app for this)
Getting Started
- Install CanvasJS
First, we will need to install the CanvasJS React Component. To do so, you can navigate to your project directory, and install it by running the following command:
npm install @canvasjs/react-charts
- Create the Chart Component
Create a new chart component, say StackedSteppedAreaChart, and import CanvasJS to start using it in your project.
import CanvasJSReact from '@canvasjs/react-charts';
let StackedStepAreaChart = () => {}
- Prepare the Data
We will create an array called dataSet which will include 3 data series, also represented as arrays.
let dataSet = [
    [
      { x: 10, y: 71 },
      { x: 20, y: 55 },
      { x: 30, y: 50 },
      { x: 40, y: 65 },
      { x: 50, y: 95 },
      { x: 60, y: 68 },
      { x: 70, y: 28 },
      { x: 80, y: 34 },
      { x: 90, y: 14 },
    ],
    [
      { x: 10, y: 81 },
      { x: 20, y: 75 },
      { x: 30, y: 20 },
      { x: 40, y: 45 },
      { x: 50, y: 55 },
      { x: 60, y: 68 },
      { x: 70, y: 38 },
      { x: 80, y: 54 },
      { x: 90, y: 24 },
    ],
    [
      { x: 10, y: 41 },
      { x: 20, y: 105 },
      { x: 30, y: 100 },
      { x: 40, y: 35 },
      { x: 50, y: 45 },
      { x: 60, y: 38 },
      { x: 70, y: 180 },
      { x: 80, y: 34 },
      { x: 90, y: 55 },
    ],
  ];
- Transform the Data
Within our chart options, we will call a function called createStackedStepAreaChart which will create a dataset in the required format, by summing up the corresponding y-values of each data series.
let createStackedStepAreaChart = () => {
    let data = [];
    let k = 0,
      yTotal = 0;

    for (let i = 0; i <= dataSet.length; i++) {
      data.push({
        type: 'stepArea',
        dataPoints: [],
      });
    }

    for (let i = 0; i < dataSet.length; i++) {
      for (let j = 0; j < dataSet[i].length; j++) {
        k = 0;
        yTotal = 0;
        while (k <= i) {
          yTotal += dataSet[k][j].y; // summing up the y-values from the previous dataSeries
          k++;
        }
        data[dataSet.length - 1 - i].dataPoints.push({
          x: dataSet[i][j].x,
          y: yTotal,
          actualYValue: dataSet[i][j].y,
        });
      }
    }

    return data;
  };
- Change Tooltip Content
We will use CanvasJS’ in-built function contentFormatter to format the tooltip content such that it displays the individual data point value and not the cumulative value.
toolTip: {
    shared: true,
    contentFormatter: function (e) {
        let content = ' ';
        content += e.entries[0].dataPoint.x + '</br>';
        for (let i = 0; i < e.entries.length; i++) {
            content += "<span style='color: "
                + e.entries[i].dataSeries.color + ";'>"
                + e.entries[i].dataSeries.name + ':</span> '
                + e.entries[i].dataPoint.actualYValue + '<br/>';
        }

        return content;
    }
}
- Import the New Component
You can then import this chart component into your App.js file to display the chart.
import StackedStepAreaChart from './StackedStepAreaChart';

let App = () => {
    return <div><StackedStepAreaChart /></div>;
};

export default App;
Check out this StackBlitz for the complete code of this example.
Conclusion
In this article, we have demonstrated how to create a stacked step area chart using CanvasJS in a React application. Feel free to experiment with different data sets and customize the options to make the chart fit your needs.
Subscribe to my newsletter
Read articles from Ananya Deka directly inside your inbox. Subscribe to the newsletter, and don't miss out.
Written by
