ELG Stack for Log Monitoring
 Satish Gogiya
In this setup, the application first generates logs. Filebeat then collects these logs, and Logstash processes them. The processed logs are sent to Elasticsearch, which acts as the central log storage. Finally, Grafana is used to visualize metrics and log data from Elasticsearch. This complete approach ensures efficient log management, processing, storage, and visualization, improving the system's monitoring and troubleshooting capabilities.
Prerequisite
Grafana Server.
FileBeat setup on Target Machine
When we start Filebeat, it takes one or more inputs that look in the specified locations for log data. For each log it finds, Filebeat starts a harvester. Each harvester reads a single log for new content and sends the new log data to libbeat. Libbeat then aggregates the events and sends the aggregated data to the output configured for Filebeat.
Create the executable file to setup the Filebeat on target machine.
sudo vim filebeat.sh
Copy and paste the below content in the filebeat.sh
#!/bin/bash

# Function to display an error message and exit
display_error() {
    echo "Error: $1"
    exit 1
}

# Check if script is being run as root
if [[ $EUID -ne 0 ]]; then
    display_error "This script must be run as root."
fi

# Add the Elastic APT repository key
wget -qO - https://artifacts.elastic.co/GPG-KEY-elasticsearch | apt-key add - || display_error "Failed to add GPG key."

# Add the Elastic APT repository
echo "deb https://artifacts.elastic.co/packages/7.x/apt stable main" > /etc/apt/sources.list.d/elastic-7.x.list

# Update the package index
apt-get update || display_error "Failed to update package index."

# Install Filebeat
apt-get install -y filebeat || display_error "Failed to install Filebeat."

# Start and enable Filebeat service
systemctl start filebeat || display_error "Failed to start Filebeat service."
systemctl enable filebeat || display_error "Failed to enable Filebeat service."

echo "Filebeat installed and configured successfully."
Please execute the filebeat.sh from the root user using the below command.
bash filebeat.sh
Once the filebeat is installed update the configuration file to send the Logs to the logstash.
- Enable the Filebeat inputs and mention the path of the log files.
# Change to true to enable this input configuration.
  enabled: true

# Paths that should be crawled and fetched. Glob based paths.
  paths:
    - /var/log/nginx/*.log
For example, we have defined the path for nginx logs (- /var/log/nginx/\.log*
- Comment out the Elasticsearch output to disable it.
#output.elasticsearch:
  # Array of hosts to connect to.
  # hosts: ["localhost:9200"]
- Enable Logstash output and define the Logstash host IP.
output.logstash:
  # The Logstash hosts
  hosts: ["172.0.1.45:5044"]
Once the Filebeat config file is ready restart the filebeats.
sudo systemctl restart filebeat.service
sudo systemctl status filebeat.service
To share the target logs with the host expose security group port 5044 within the VPC.
Logstash setup (on the host machine)
Create the executable file to set up the Logstash on the target machine.
sudo vim logstash.sh
Copy and paste the below content in the logstash.sh
#!/bin/bash

# Function to display an error message and exit
display_error() {
    echo "Error: $1"
    exit 1
}

# Check if script is being run as root
if [[ $EUID -ne 0 ]]; then
    display_error "This script must be run as root."
fi

# Add the Elastic APT repository key
wget -qO - https://artifacts.elastic.co/GPG-KEY-elasticsearch | apt-key add - || display_error "Failed to add GPG key."

# Add the Elastic APT repository
echo "deb https://artifacts.elastic.co/packages/7.x/apt stable main" > /etc/apt/sources.list.d/elastic-7.x.list

# Update the package index
apt-get update || display_error "Failed to update package index."

# Install Logstash
apt-get install -y logstash || display_error "Failed to install Logstash."

# Configure Logstash
cat <<EOF > /etc/logstash/conf.d/logstash.conf
input {
  beats {
    port => 5044
  }
}

output {
  elasticsearch {
    hosts => ["localhost:9200"]
    index => "%{[@metadata][beat]}-%{[@metadata][version]}-%{+YYYY.MM.dd}"
    document_type => "%{[@metadata][type]}"
  }
}
EOF

# Start and enable Logstash service
systemctl start logstash || display_error "Failed to start Logstash service."
systemctl enable logstash || display_error "Failed to enable Logstash service."

echo "Logstash installed and configured successfully."
If you want to make the changes in the logstash configuration file you can move to /etc/logstash/conf.d
Please execute the logstash.sh from the root user using the below command.
bash logstash.sh
Elasticsearch setup (on the host machine)
Create the executable file to setup the elastic search on the target machine.
sudo vim elasticsearch.sh
Copy and paste the below content in the elasticsearch.sh
#!/bin/bash

# Function to display an error message and exit
display_error() {
    echo "Error: $1"
    exit 1
}

# Check if script is being run as root
if [[ $EUID -ne 0 ]]; then
    display_error "This script must be run as root."
fi

# Add the Elastic APT repository key
wget -qO - https://artifacts.elastic.co/GPG-KEY-elasticsearch | apt-key add - || display_error "Failed to add GPG key."

# Add the Elastic APT repository
echo "deb https://artifacts.elastic.co/packages/7.x/apt stable main" > /etc/apt/sources.list.d/elastic-7.x.list

# Update the package index
apt-get update || display_error "Failed to update package index."

# Install Elasticsearch
apt-get install -y elasticsearch || display_error "Failed to install Elasticsearch."

# Configure Elasticsearch for external access
echo "network.host: 0.0.0.0" >> /etc/elasticsearch/elasticsearch.yml
echo "http.port: 9200" >> /etc/elasticsearch/elasticsearch.yml
echo "discovery.type: single-node" >> /etc/elasticsearch/elasticsearch.yml

# Start and enable Elasticsearch service
systemctl start elasticsearch || display_error "Failed to start Elasticsearch service."
systemctl enable elasticsearch || display_error "Failed to enable Elasticsearch service."

echo "Elasticsearch installed and configured for external access successfully."
Please execute the elasticsearch.sh from the root user using the below command.
bash elasticsearch.sh
Now add the below index in elasticsearch.
Indes: timestamp
curl -X PUT "http://localhost:9200/timestamp" -H 'Content-Type: application/json' -d '{
  "settings": {
    "number_of_shards": 1,
    "number_of_replicas": 0
  },
  "mappings": {
    "properties": {
      "@timestamp": {
        "type": "date"
      },
      "other_field": {
        "type": "text"
      },
      "another_field": {
        "type": "keyword"
      }
      // Add more fields as needed
    }
  }
}'
Index: mappings
curl -X PUT "http://localhost:9200/timestamp/_mappings" -H 'Content-Type: application/json' -d '{
  "properties": {
    "@timestamp": {
      "type": "date"
    },
    "other_field": {
      "type": "text"
    },
    "another_field": {
      "type": "keyword"
    }
    // Add more fields as needed
  }
Set up the Grafana Dashboard to Monitor the Logs.
Before setting up the elasticsearch logs dashboard we required the Elasticsearch data sources.
To configure the data source follow the below steps:
Login to the Grafana console.
On the Left side of the console click on “Add New Connection”
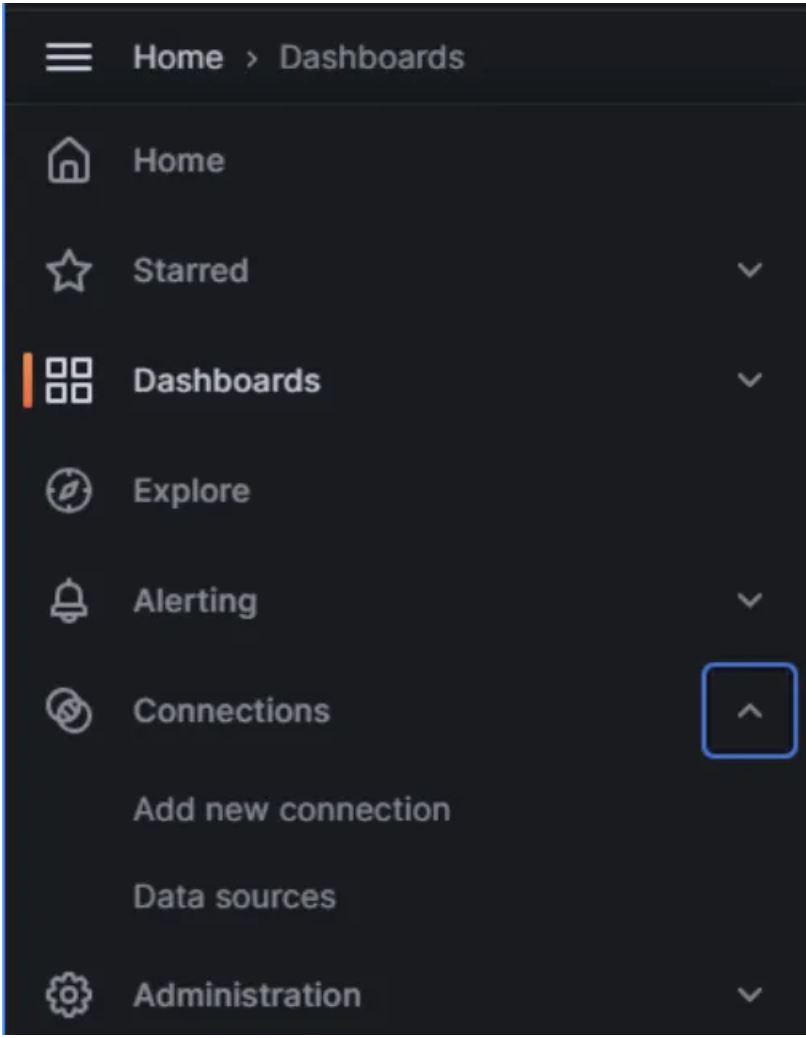
- Now search for the Elastic Search and add the data sources.


- Once the data source is added now configure the data sources.
In the Connection URL add “http://localhost:9200”

- Scroll down Save Test, and Exit.
Configure the Dashboard
- Go to the dashboard
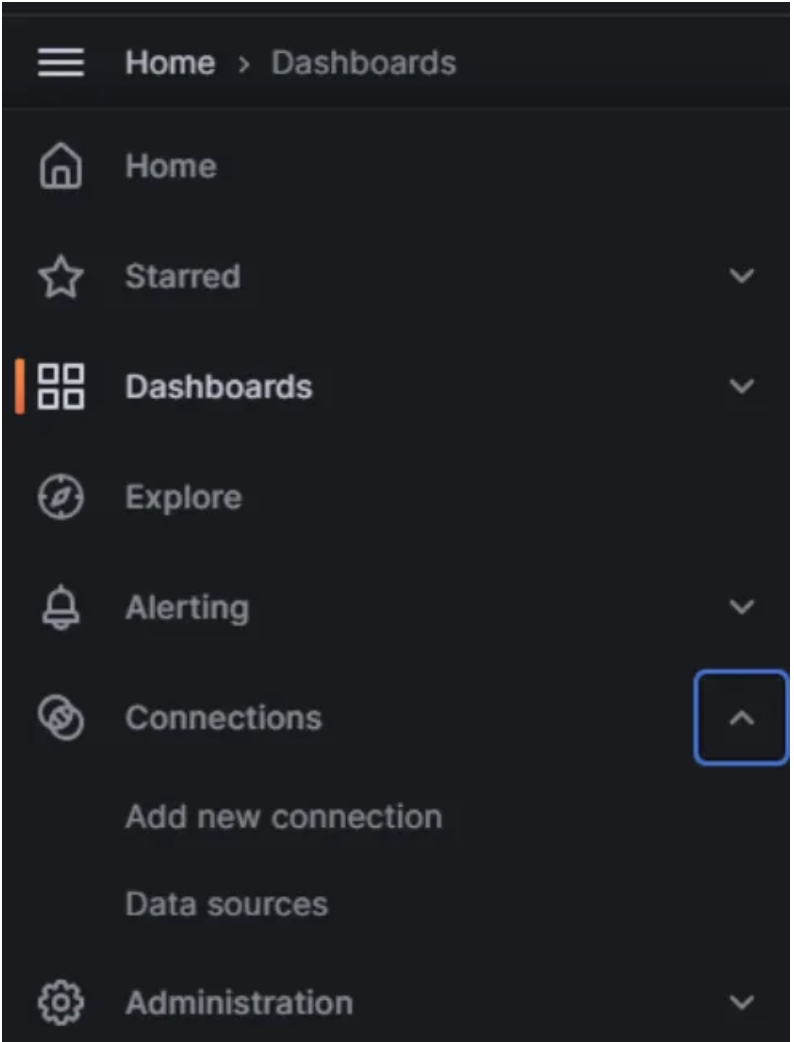
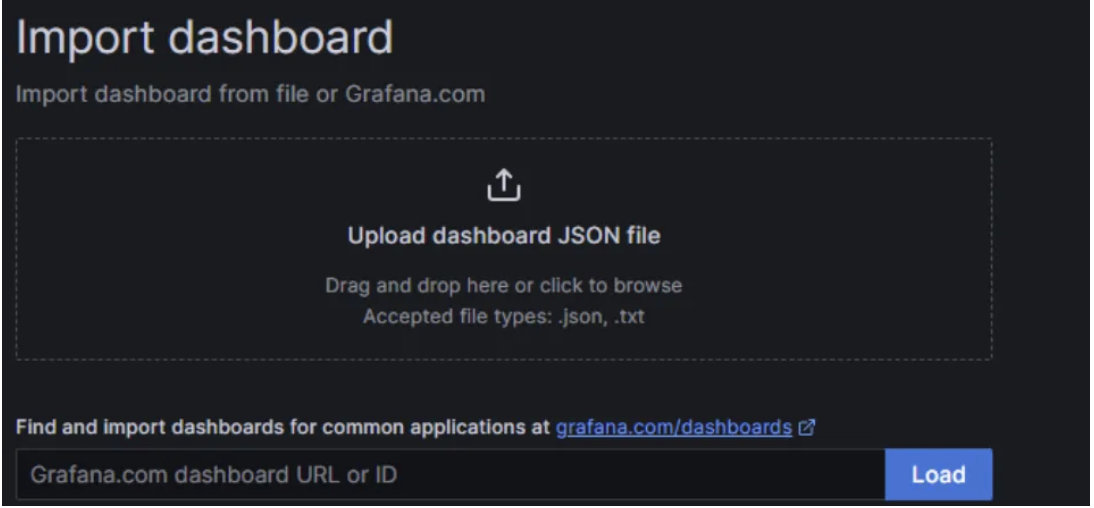
Click on New and import
In the import dashboard console you can add the below link of dashboard code(17361).
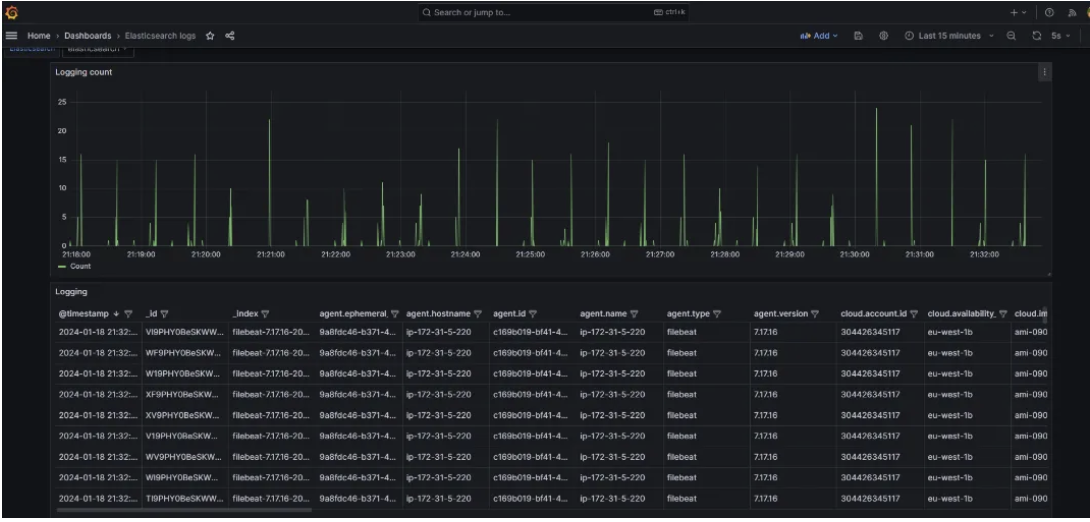
Final Output
Subscribe to my newsletter
Read articles from Satish Gogiya directly inside your inbox. Subscribe to the newsletter, and don't miss out.
Written by
