Phase 4a : Monitoring | Set up Prometheus and Grafana to monitor your application | Prometheus and Node Exporter Setup
 Aasifa Shaik
Launch Another server T2.Medium and attach elastic IP
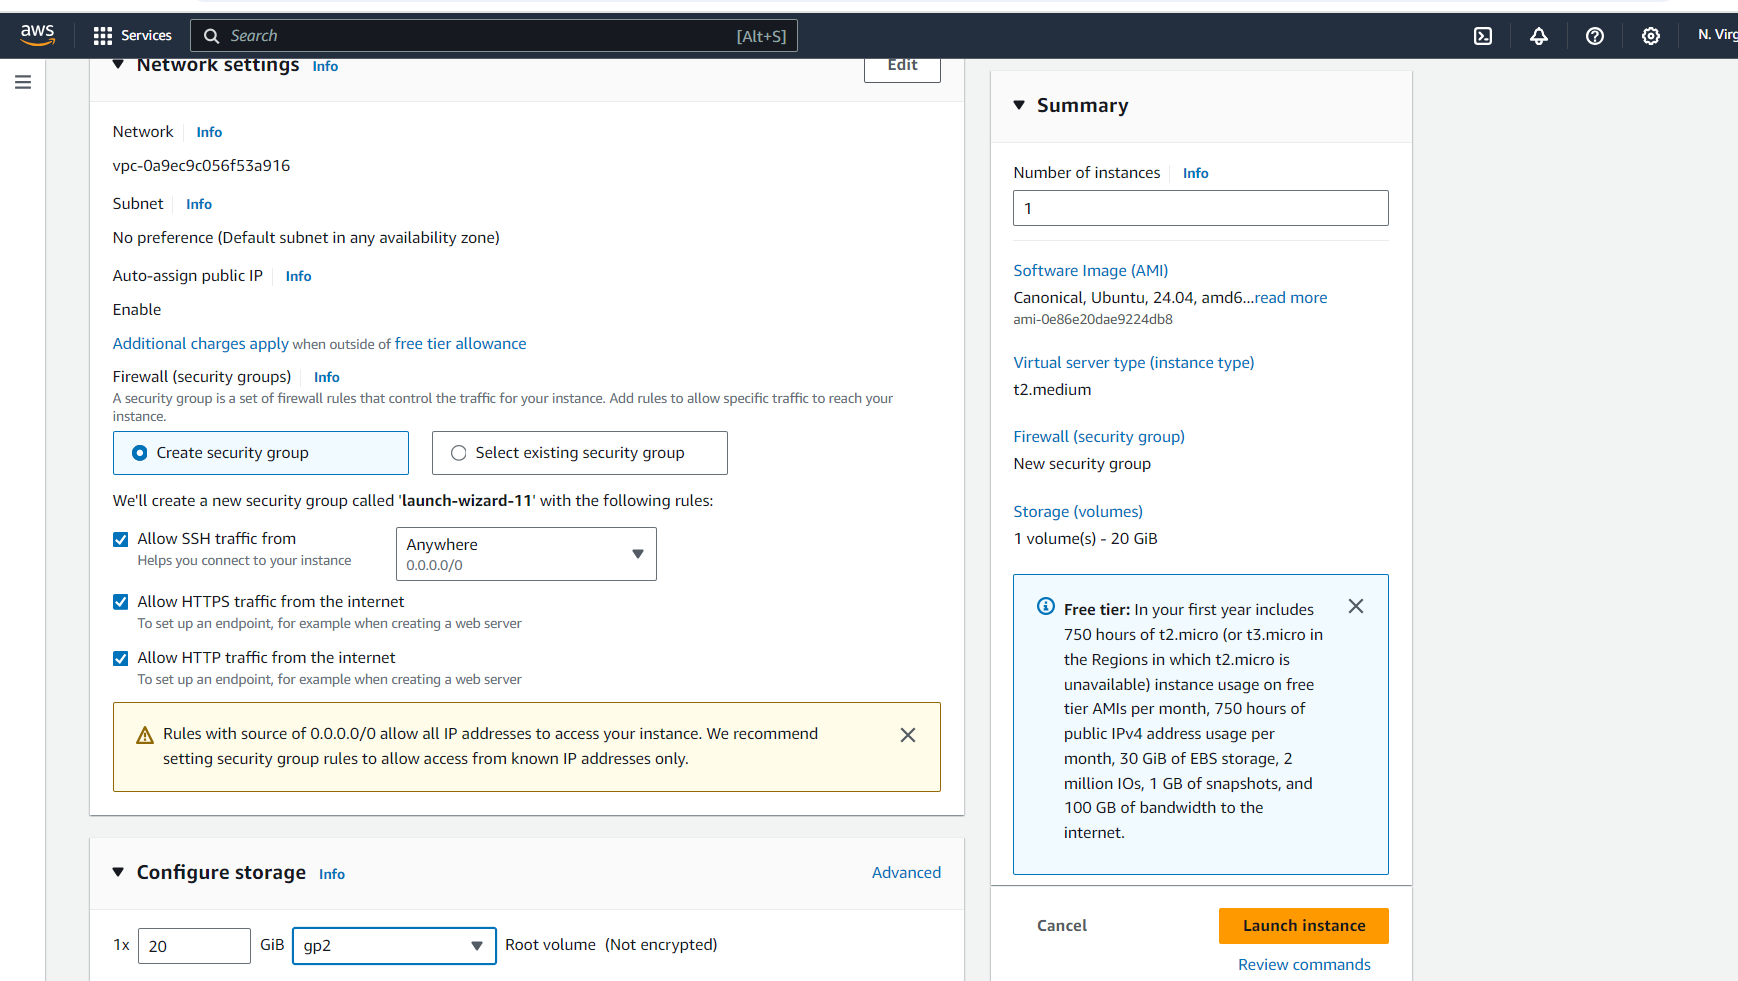
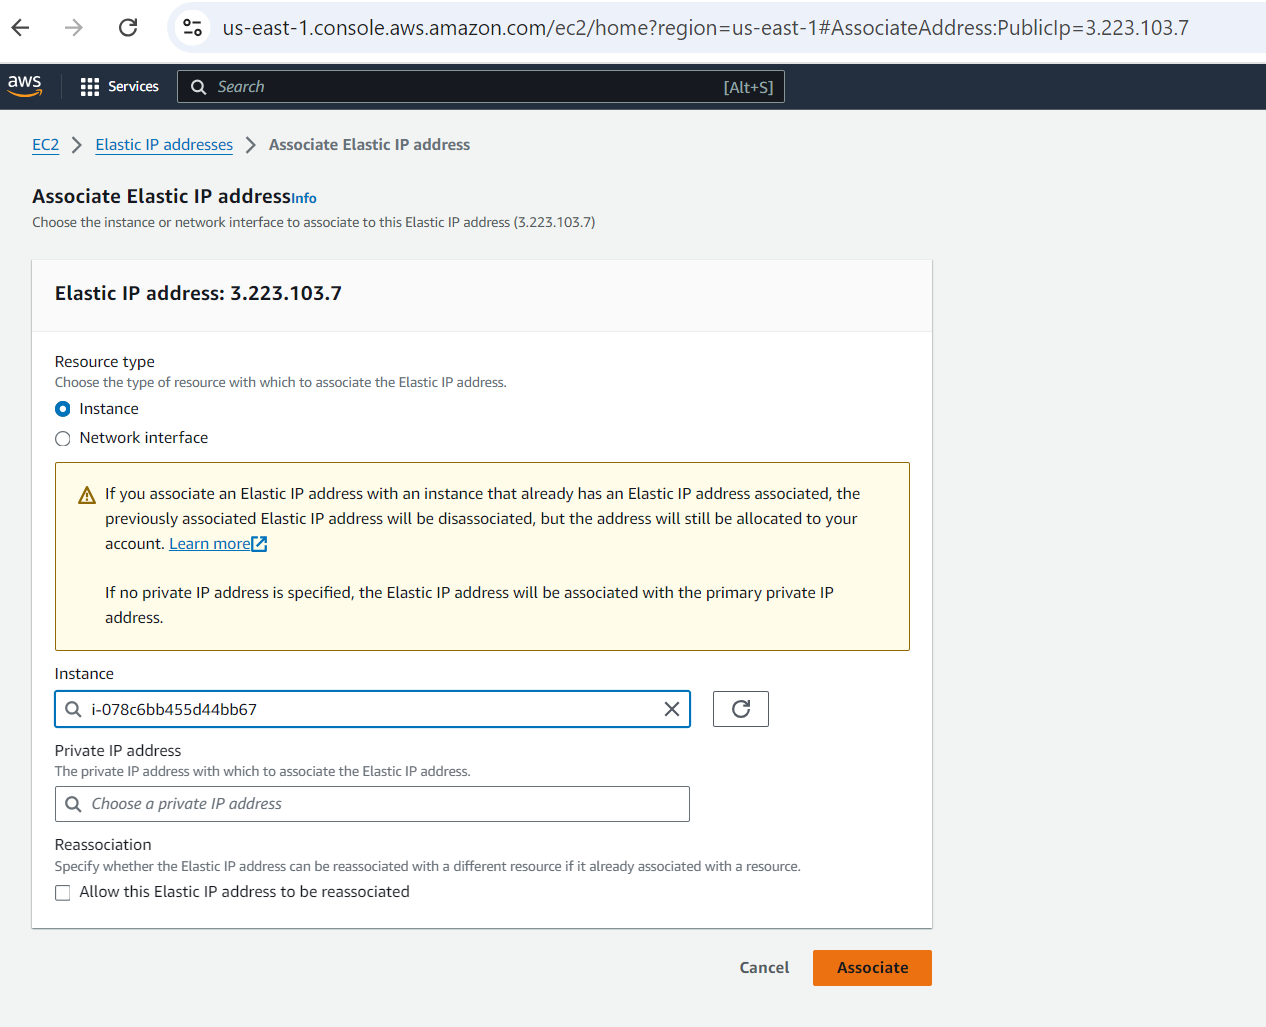

Ports Required
9090
Setting up prometheus and Node Exporter
Installing Prometheus
First, create a dedicated Linux user for Prometheus and download Prometheus:
sudo useradd --system --no-create-home --shell /bin/false prometheus
wget https://github.com/prometheus/prometheus/releases/download/v2.47.1/prometheus-2.47.1.linux-amd64.tar.gz
Extract Prometheus files, move them, and create directories:
tar -xvf prometheus-2.47.1.linux-amd64.tar.gz
cd prometheus-2.47.1.linux-amd64/
sudo mkdir -p /data /etc/prometheus
sudo mv prometheus promtool /usr/local/bin/
sudo mv consoles/ console_libraries/ /etc/prometheus/
sudo mv prometheus.yml /etc/prometheus/prometheus.yml
Set ownership for directories:
sudo chown -R prometheus:prometheus /etc/prometheus/ /data/
Create a systemd unit configuration file for Prometheus:
sudo nano /etc/systemd/system/prometheus.service
Add the following content to the prometheus.service file:
[Unit]
Description=Prometheus
Wants=network-online.target
After=network-online.target

StartLimitIntervalSec=500
StartLimitBurst=5

[Service]
User=prometheus
Group=prometheus
Type=simple
Restart=on-failure
RestartSec=5s
ExecStart=/usr/local/bin/prometheus \
  --config.file=/etc/prometheus/prometheus.yml \
  --storage.tsdb.path=/data \
  --web.console.templates=/etc/prometheus/consoles \
  --web.console.libraries=/etc/prometheus/console_libraries \
  --web.listen-address=0.0.0.0:9090 \
  --web.enable-lifecycle

[Install]
WantedBy=multi-user.target
Here's a brief explanation of the key parts in this prometheus.service file:
UserandGroupspecify the Linux user and group under which Prometheus will run.ExecStartis where you specify the Prometheus binary path, the location of the configuration file (prometheus.yml), the storage directory, and other settings.web.listen-addressconfigures Prometheus to listen on all network interfaces on port 9090.web.enable-lifecycleallows for management of Prometheus through API calls.
Enable and start Prometheus:
sudo systemctl enable prometheus
sudo systemctl start prometheus
Verify Prometheus's status:
sudo systemctl status prometheus
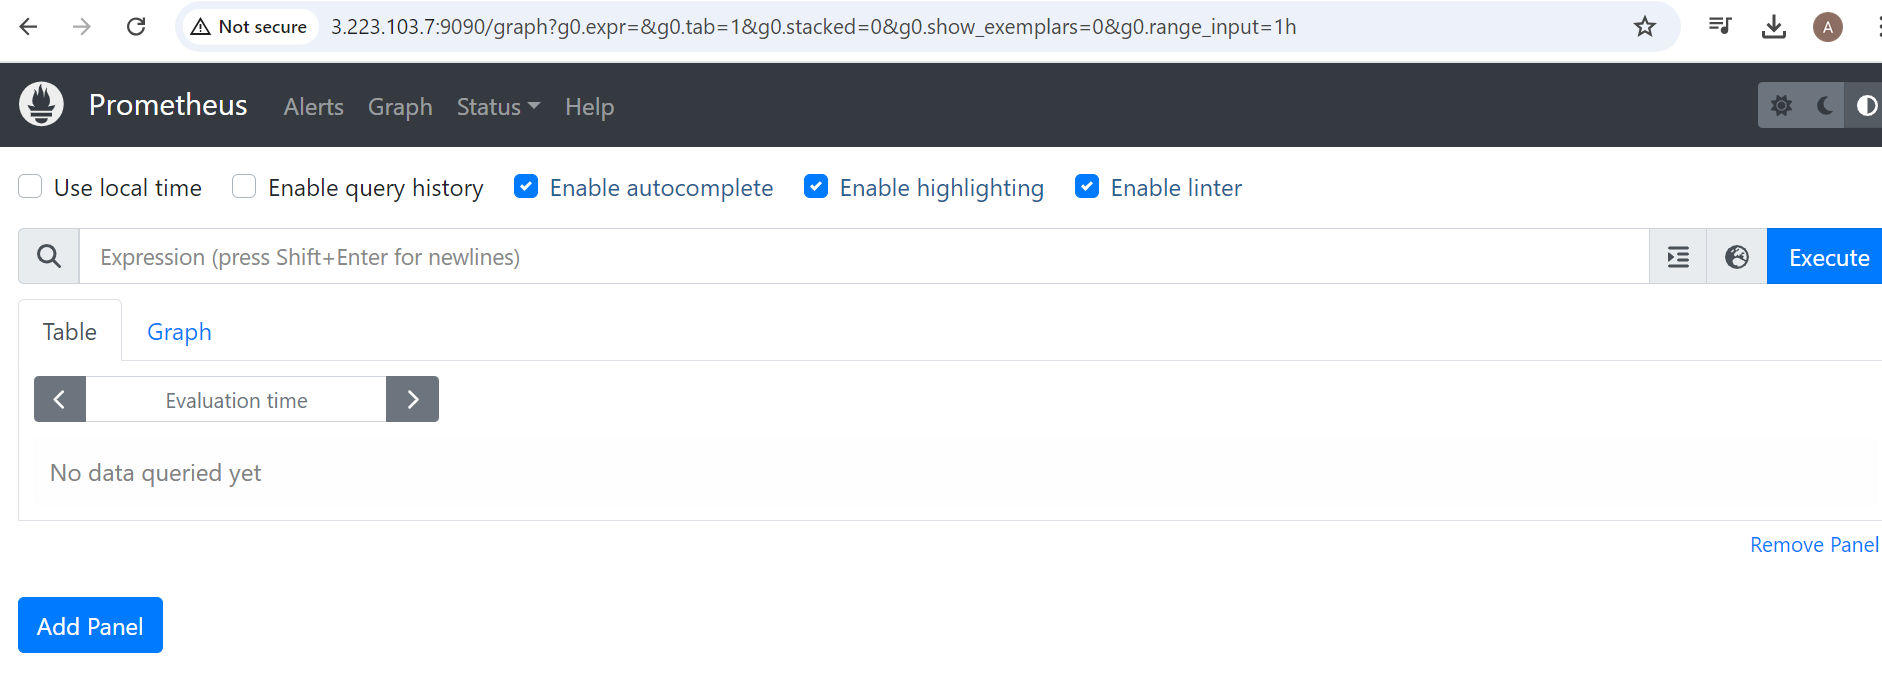
You can access Prometheus in a web browser using your server's IP and port 9090:
http://<your-server-ip>:9090
Our prometheus is now running.

Setting up Node Exporter
Installing Node Exporter
sudo useradd --system --no-create-home --shell /bin/false node_exporter
Extract Node Exporter files, move the binary, and clean up:
tar -xvf node_exporter-1.6.1.linux-amd64.tar.gz
sudo mv node_exporter-1.6.1.linux-amd64/node_exporter /usr/local/bin/
rm -rf node_exporter*
Create a systemd unit configuration file for Node Exporter:
sudo nano /etc/systemd/system/node_exporter.service
Add the following content to the node_exporter.service file:
[Unit]
Description=Node Exporter
Wants=network-online.target
After=network-online.target

StartLimitIntervalSec=500
StartLimitBurst=5

[Service]
User=node_exporter
Group=node_exporter
Type=simple
Restart=on-failure
RestartSec=5s
ExecStart=/usr/local/bin/node_exporter --collector.logind

[Install]
WantedBy=multi-user.target
Replace --collector.logind with any additional flags as needed.
Enable and start Node Exporter:
sudo systemctl enable node_exporter
sudo systemctl start node_exporter
Verify the Node Exporter's status:
sudo systemctl status node_exporter
You can access Node Exporter metrics in Prometheus.
Configure Prometheus Plugin Integration
Integrate Jenkins with Prometheus to monitor the CI/CD pipeline.
Prometheus Configuration
To configure Prometheus to scrape metrics from Node Exporter and Jenkins, you need to modify the prometheus.yml file. Here is an example prometheus.yml configuration for your setup:
# my global config
global:
  scrape_interval: 15s # Set the scrape interval to every 15 seconds. Default is every 1 minute.
  evaluation_interval: 15s # Evaluate rules every 15 seconds. The default is every 1 minute.
  # scrape_timeout is set to the global default (10s).

# Alertmanager configuration
alerting:
  alertmanagers:
    - static_configs:
        - targets:
          # - alertmanager:9093

# Load rules once and periodically evaluate them according to the global 'evaluation_interval'.
rule_files:
  # - "first_rules.yml"
  # - "second_rules.yml"

# A scrape configuration containing exactly one endpoint to scrape:
# Here it's Prometheus itself.
scrape_configs:
  # The job name is added as a label `job=<job_name>` to any timeseries scraped from this config.
  - job_name: "prometheus"

    # metrics_path defaults to '/metrics'
    # scheme defaults to 'http'.

    static_configs:
      - targets: ["localhost:9090"]

  - job_name: "node_exporter"
    static_configs:
      - targets: ["3.223.103.7:9100"]
Replace 3.223.103.7:9100 with your monitoring server IP address.
Check the validity of the configuration file:
promtool check config /etc/prometheus/prometheus.yml
Reload the Prometheus configuration without restarting:
curl -X POST http://localhost:9090/-/reload
You can access Prometheus targets at:
http://<your-prometheus-ip>:9090/targets
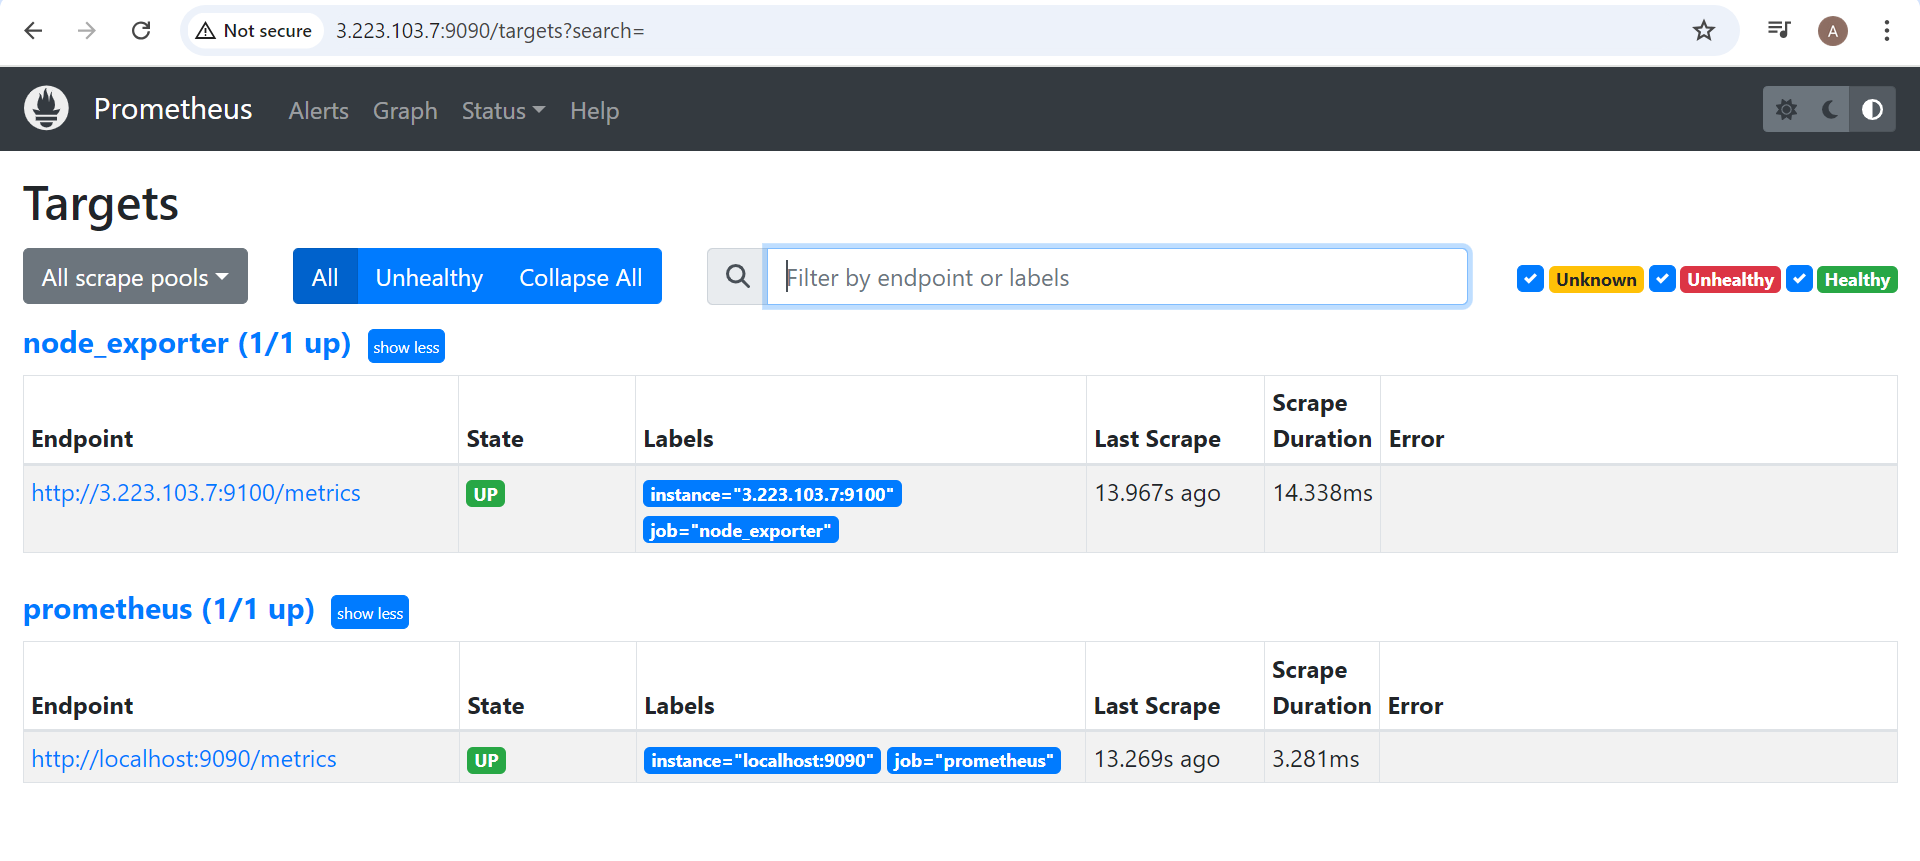
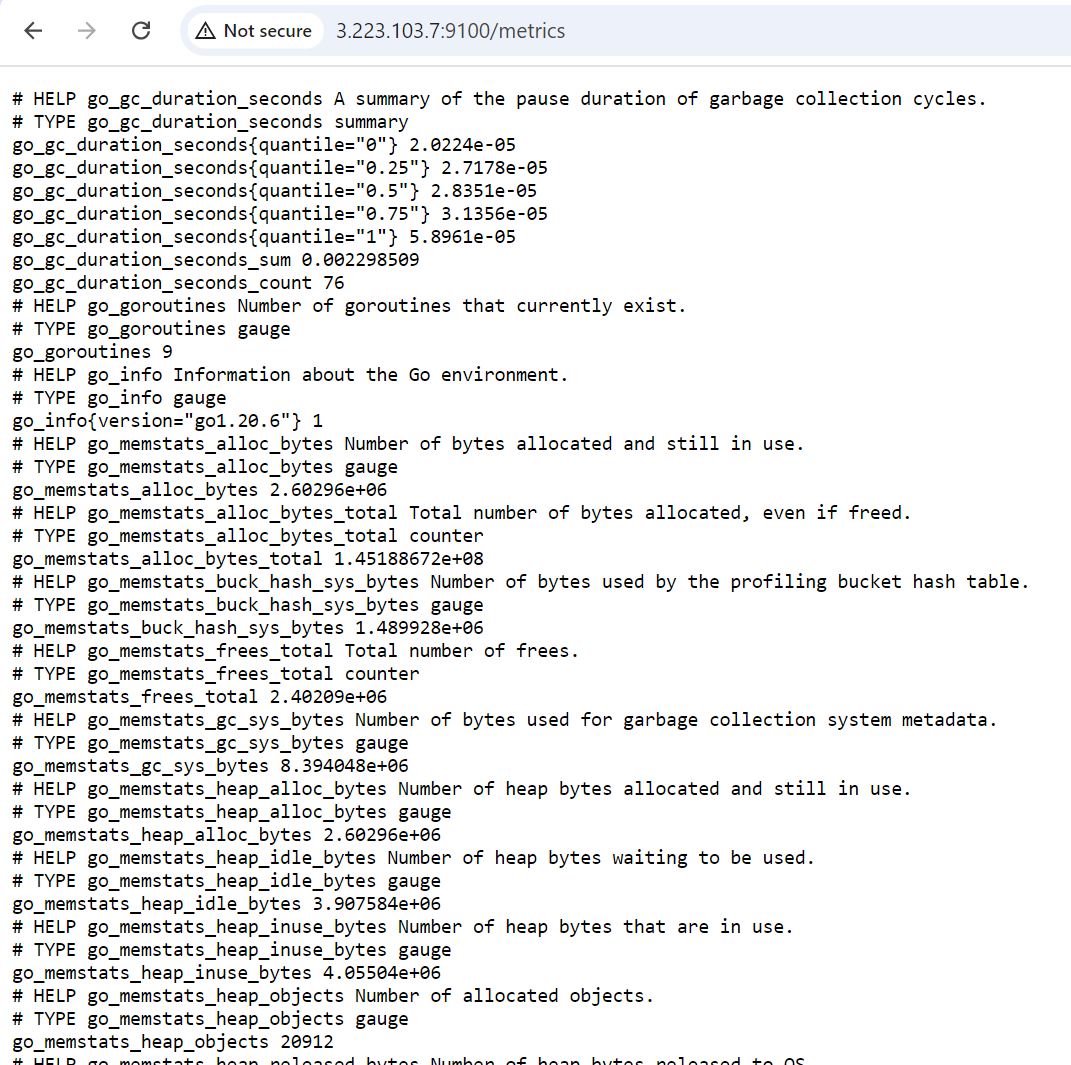
When you access on 9100 port you can see the metrics
http://3.223.103.7:9100/metrics
Subscribe to my newsletter
Read articles from Aasifa Shaik directly inside your inbox. Subscribe to the newsletter, and don't miss out.
Written by

Aasifa Shaik
Aasifa Shaik
I am a DevSecOps Engineer at Renesas, where I specialize in integrating security practices within the DevOps pipeline. My work focuses on automating security, ensuring compliance, and securing applications throughout their lifecycle.