Phase 4b : Monitoring | Set up Prometheus and Grafana to monitor your application | Setup | Setup Grafana | Monitor Node Exporter
 Aasifa Shaik
Table of contents
- Step 1: Install Dependencies:
- Step 2: Add the GPG Key:
- Step 3: Add Grafana Repository:
- Step 4: Update and Install Grafana:
- Step 5: Enable and Start Grafana Service:
- Step 6: Check Grafana Status:
- Step 7: Access Grafana Web Interface:
- Step 8: Change the Default Password:
- Step 9: Add Prometheus Data Source:
- Step 10: Import a Node Exporter Dashboard:
Install Grafana on Ubuntu 22.04 and Set it up to Work with Prometheus
Step 1: Install Dependencies:
First, ensure that all necessary dependencies are installed:
sudo apt-get update
sudo apt-get install -y apt-transport-https software-properties-common
Step 2: Add the GPG Key:
Add the GPG key for Grafana:
wget -q -O - https://packages.grafana.com/gpg.key | sudo apt-key add -
Step 3: Add Grafana Repository:
Add the repository for Grafana stable releases:
echo "deb https://packages.grafana.com/oss/deb stable main" | sudo tee -a /etc/apt/sources.list.d/grafana.list
Step 4: Update and Install Grafana:
Update the package list and install Grafana:
sudo apt-get update
sudo apt-get -y install grafana
Step 5: Enable and Start Grafana Service:
To automatically start Grafana after a reboot, enable the service:
sudo systemctl enable grafana-server
Then, start Grafana:
sudo systemctl start grafana-server
Step 6: Check Grafana Status:
Verify the status of the Grafana service to ensure it's running correctly:
sudo systemctl status grafana-server
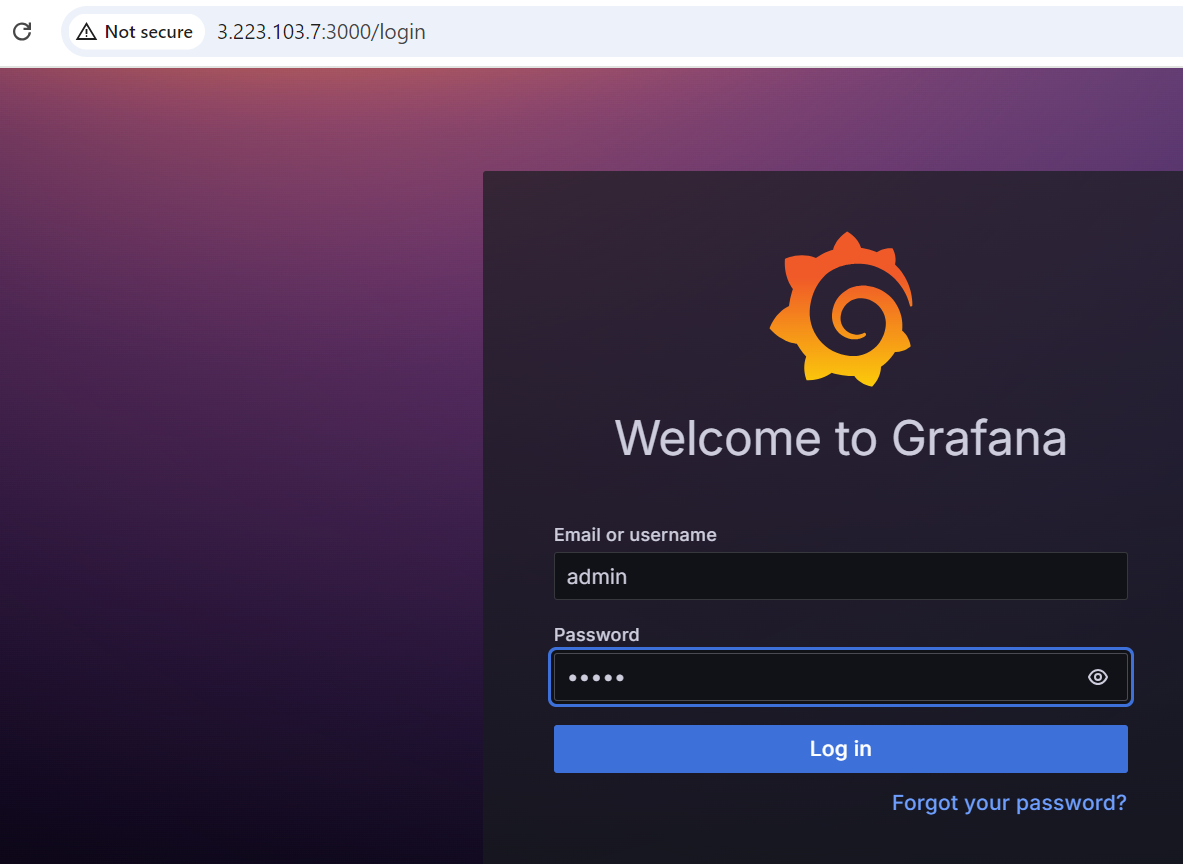
Step 7: Access Grafana Web Interface:
Open a web browser and navigate to Grafana using your server's IP address. The default port for Grafana is 3000. For example:
http://<your-server-ip>:3000
You'll be prompted to log in to Grafana. The default username is "admin," and the default password is also "admin."

Step 8: Change the Default Password:
When you log in for the first time, Grafana will prompt you to change the default password for security reasons. Follow the prompts to set a new password.
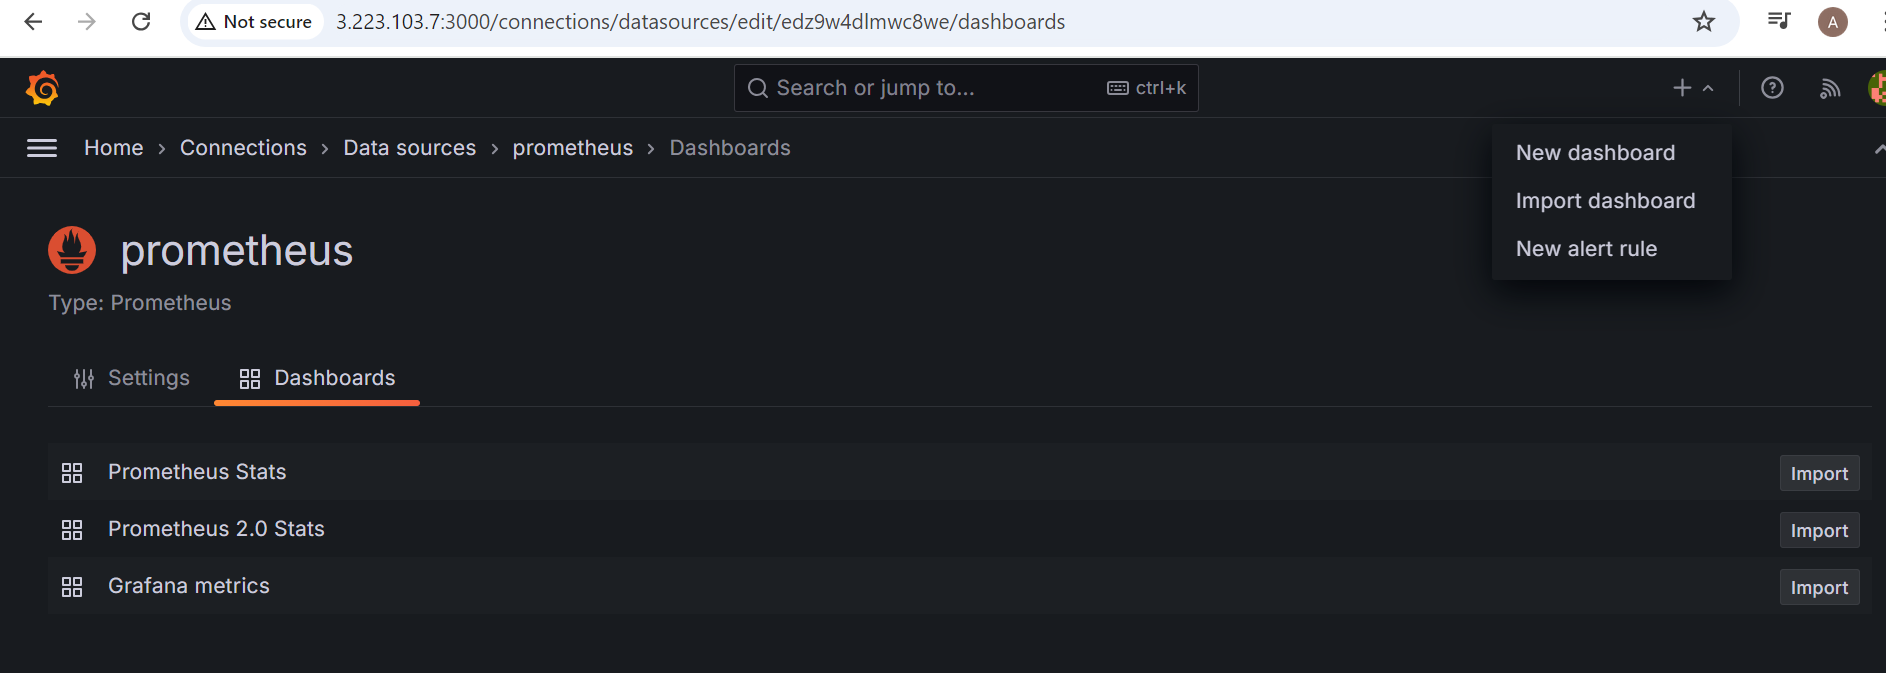
Step 9: Add Prometheus Data Source:
To visualize metrics, you need to add a data source. Follow these steps:
Click on the gear icon (⚙️) in the left sidebar to open the "Configuration" menu.
Select "Data Sources."
Click on the "Add data source" button.
Choose "Prometheus" as the data source type.
In the "HTTP" section:
Set the "URL" to
http://ipaddress:9090(assuming Prometheus is running on the same server).Click the "Save & Test" button to ensure the data source is working.
Step 10: Import a Node Exporter Dashboard:
o make it easier to view metrics, you can import a pre-configured dashboard. Follow these steps:
Click on the "+" (plus) icon in the left sidebar to open the "Create" menu.
Select "Dashboard."
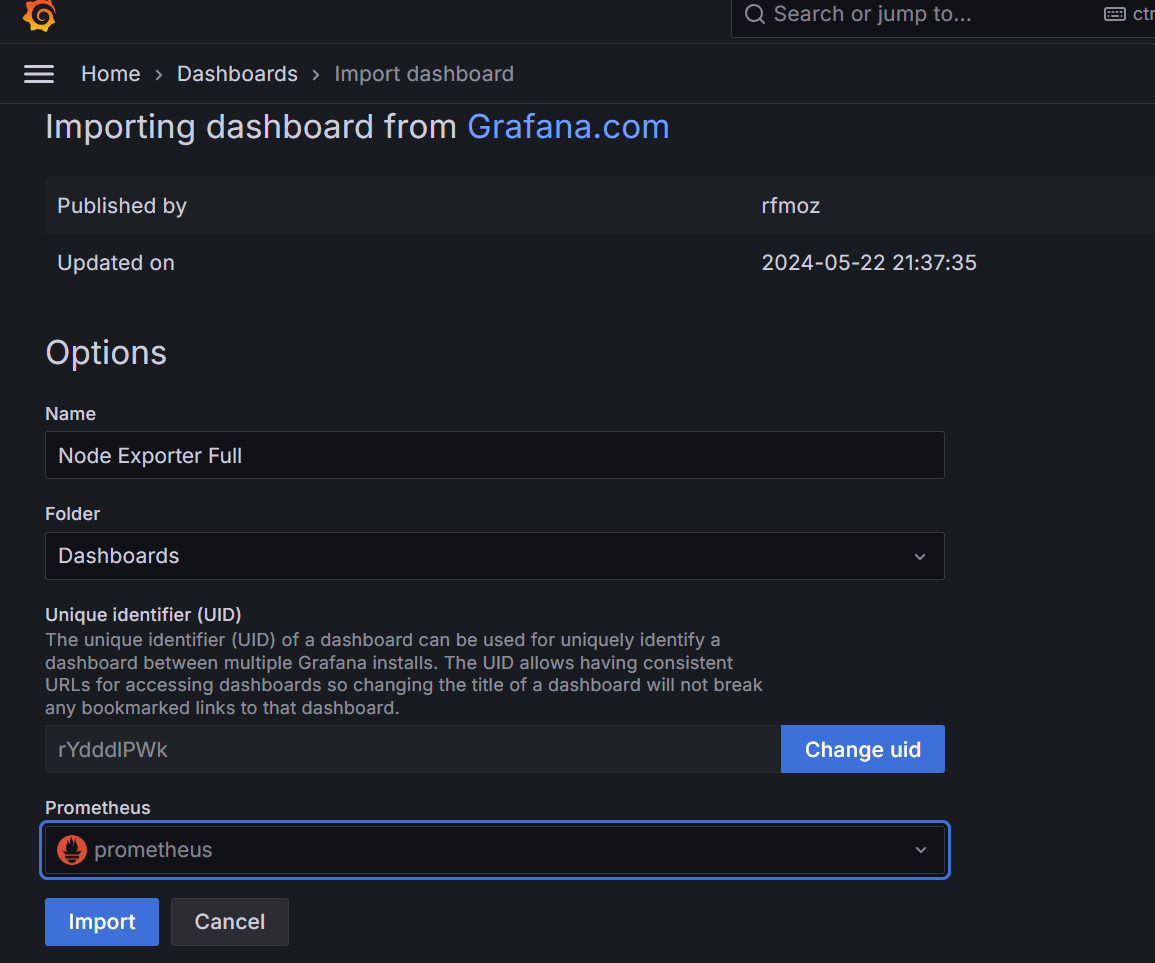
Click on the "Import" dashboard option.

Enter the dashboard code you want to import (e.g., code 1860).
Click the "Load" button.
Select the data source you added (Prometheus) from the dropdown.

- Click on the "Import" button.
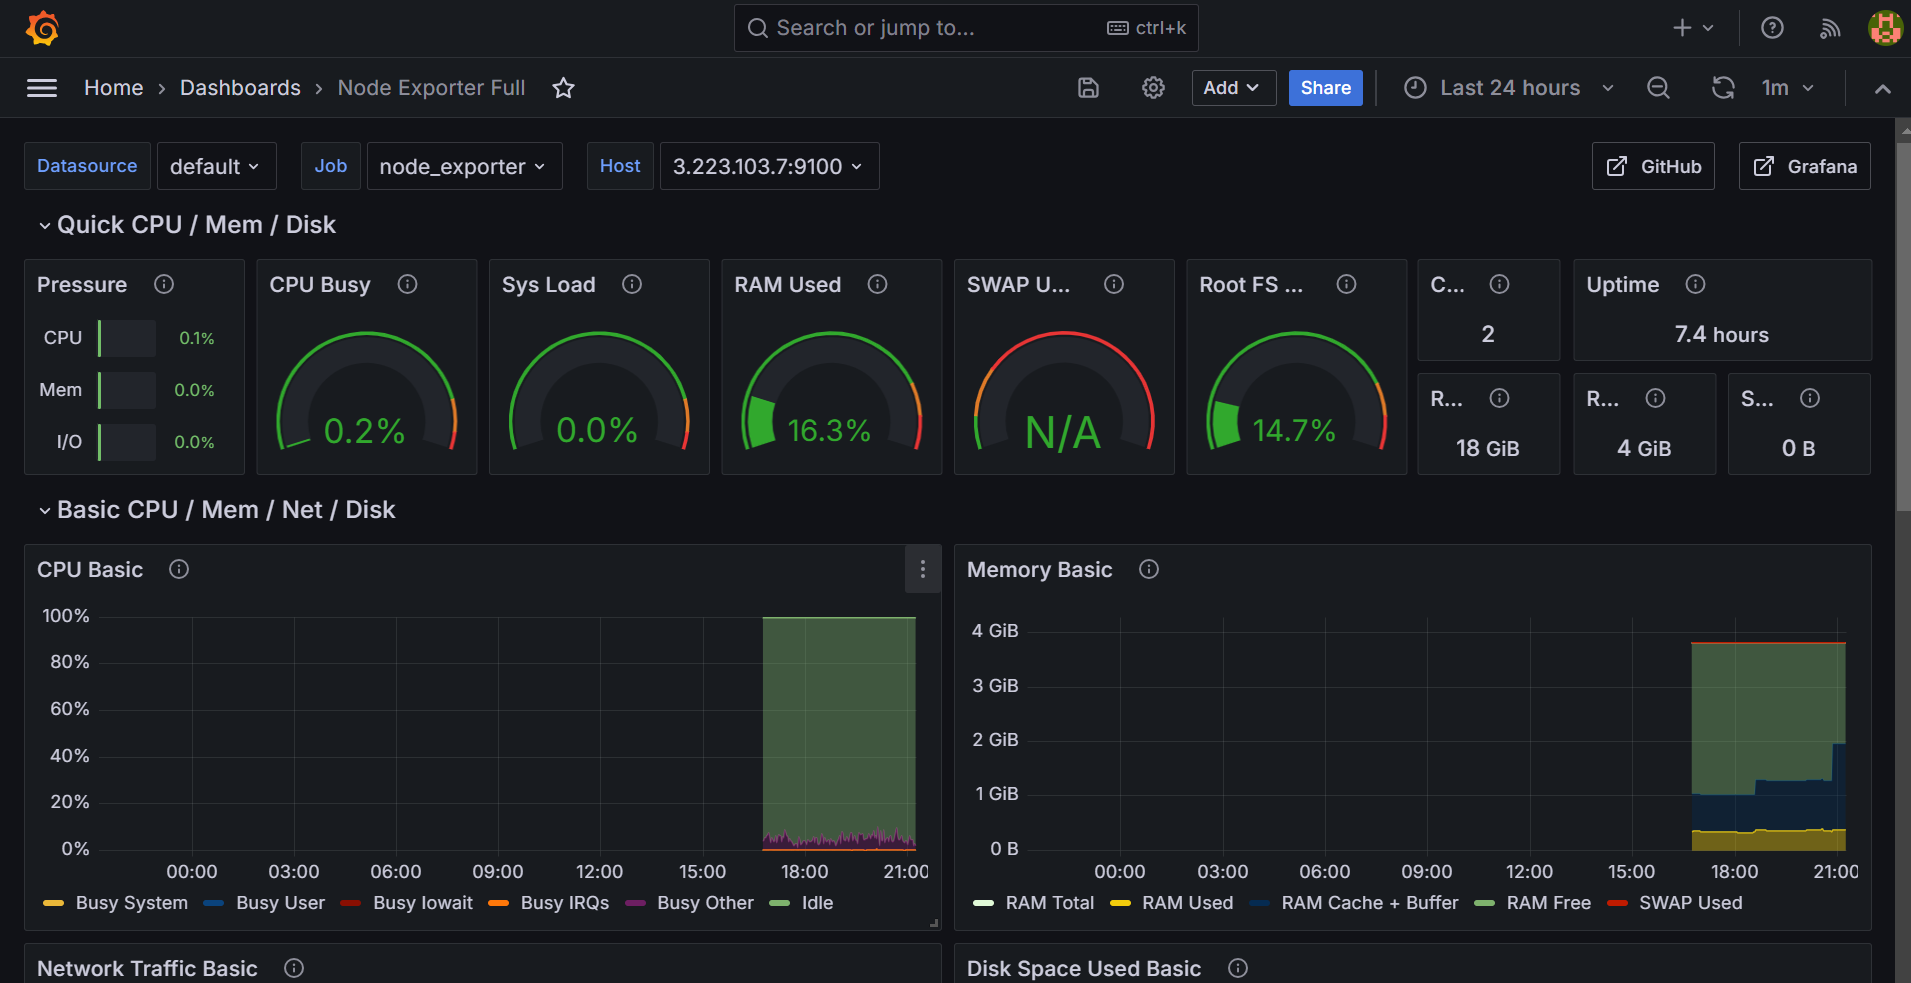
You should now have a Grafana dashboard set up to visualize metrics from Prometheus. 💁🏻💁🏻💁🏻💁🏻

We also need to monitor jenkins. We can continue in next blog ( 4c ).
Subscribe to my newsletter
Read articles from Aasifa Shaik directly inside your inbox. Subscribe to the newsletter, and don't miss out.
Written by

Aasifa Shaik
Aasifa Shaik
I am a DevSecOps Engineer at Renesas, where I specialize in integrating security practices within the DevOps pipeline. My work focuses on automating security, ensuring compliance, and securing applications throughout their lifecycle.