Phase 4c : Monitoring | Monitor Jenkins Dashboard
 Aasifa Shaik
1 min read
Add prometheus metric plugin in jenkins
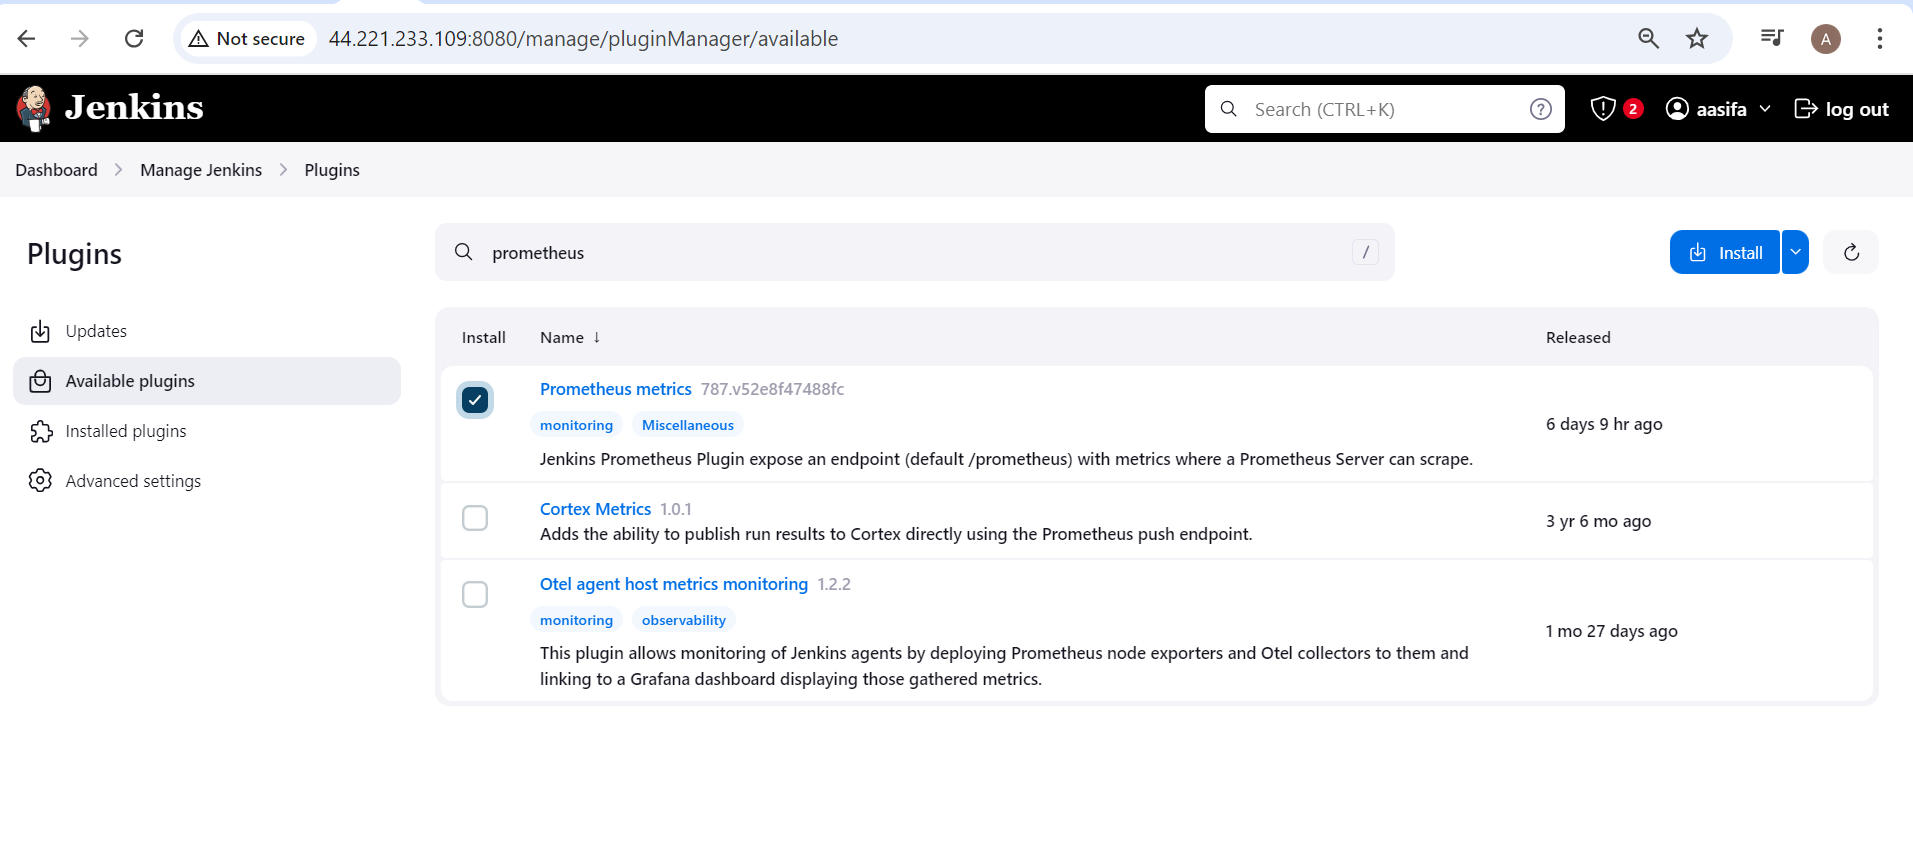
Apply below changes
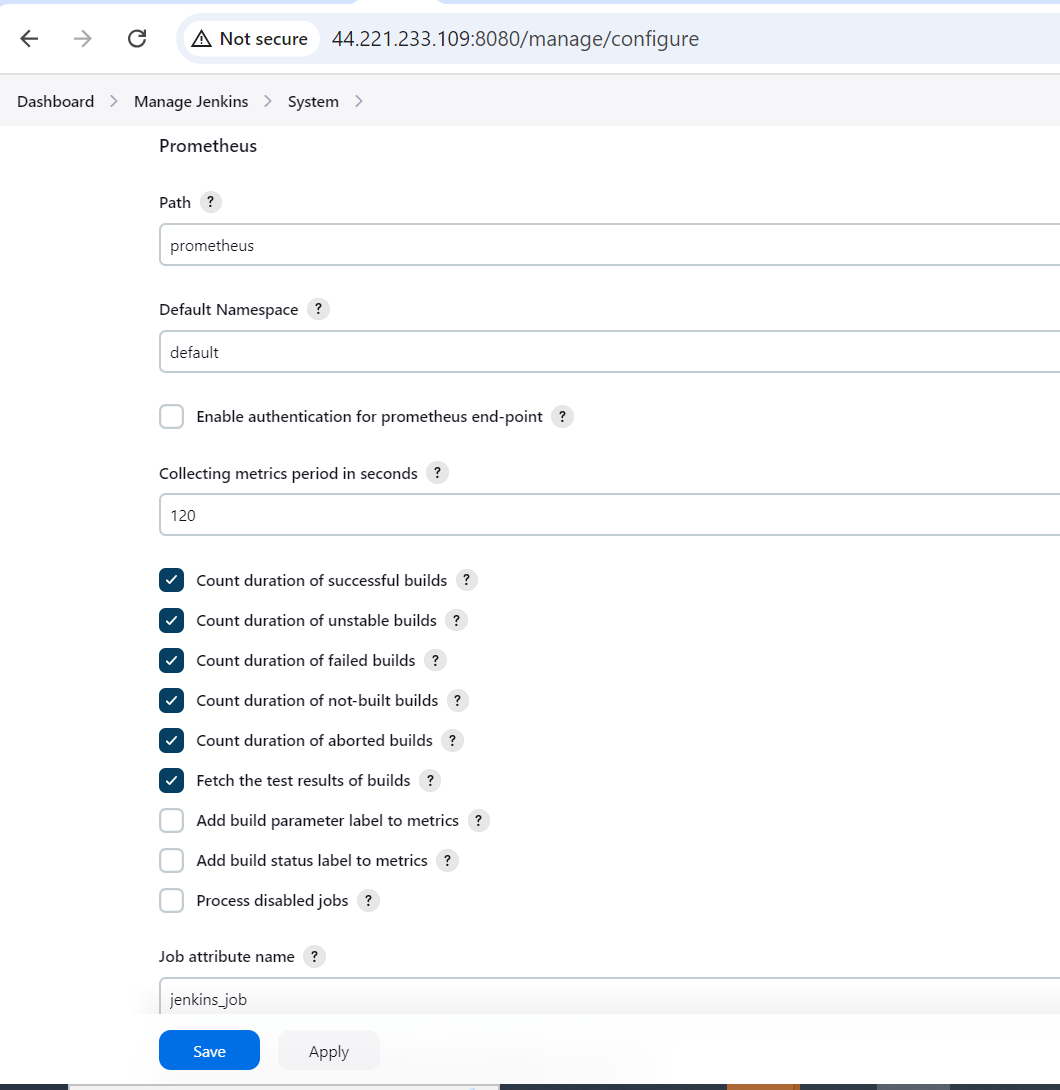
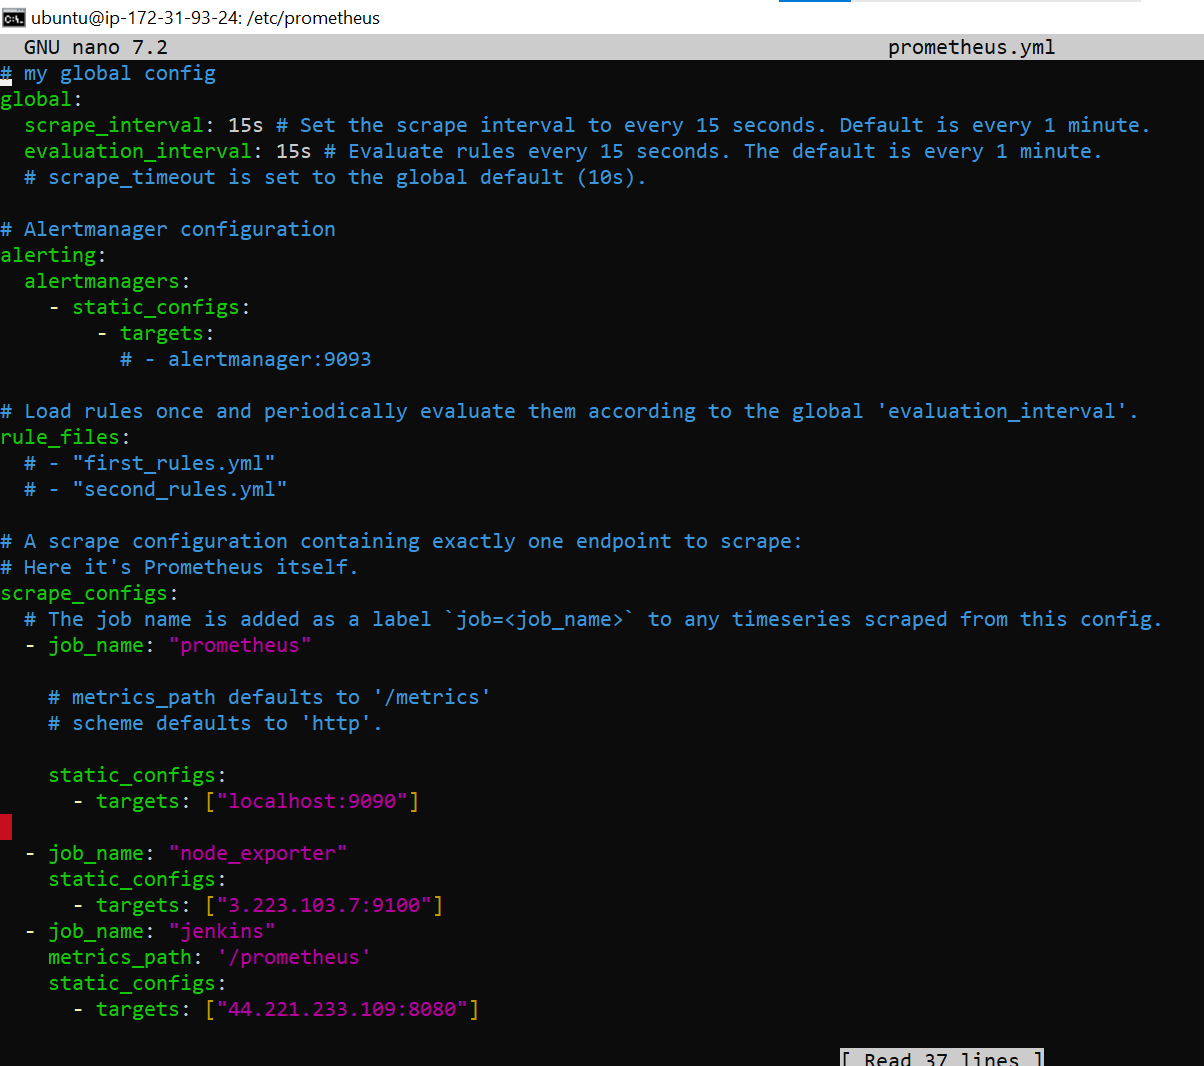
We need to add jenkins prometheus path and port in prometheus.yml file.
In the monitoring server, do
cd /etc/prometheus
sudo nano prometheus.yml
Add below configurations in this file
 - job_name: "jenkins"
    metrics_path: '/prometheus'
    static_configs:
      - targets: ["jenkinsserver:8080"]
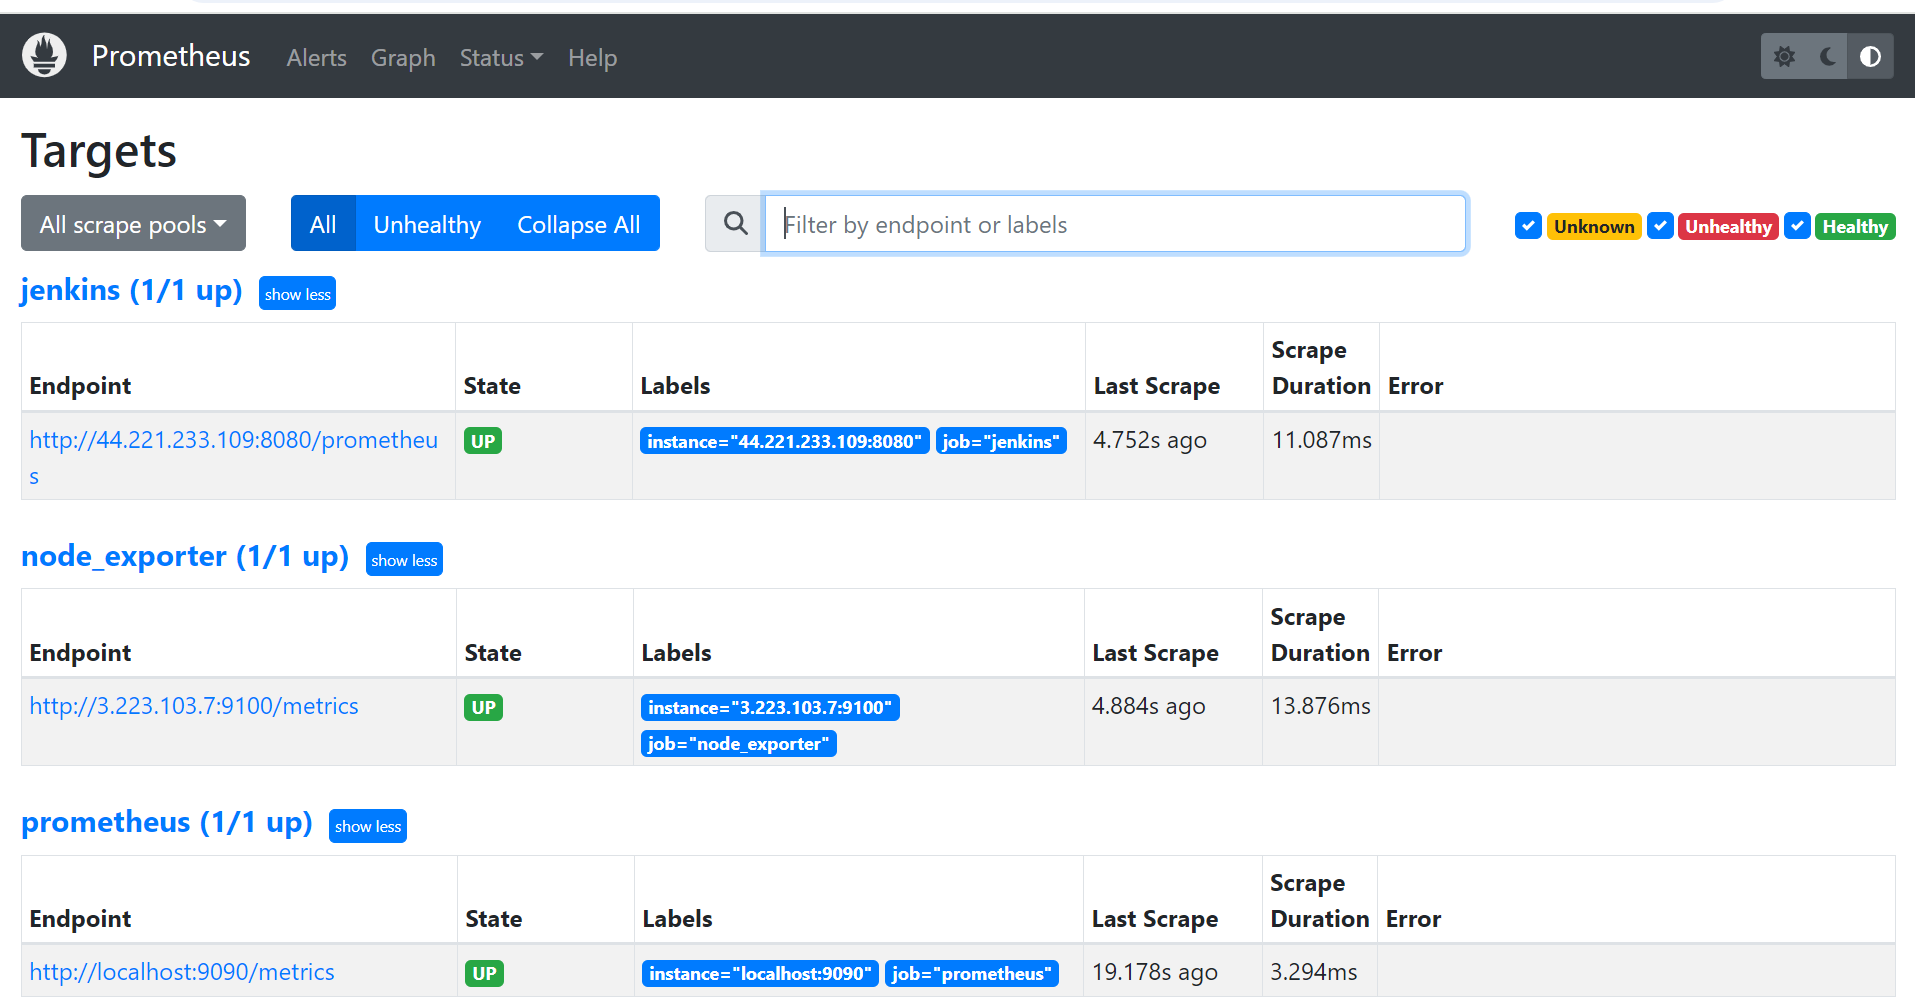
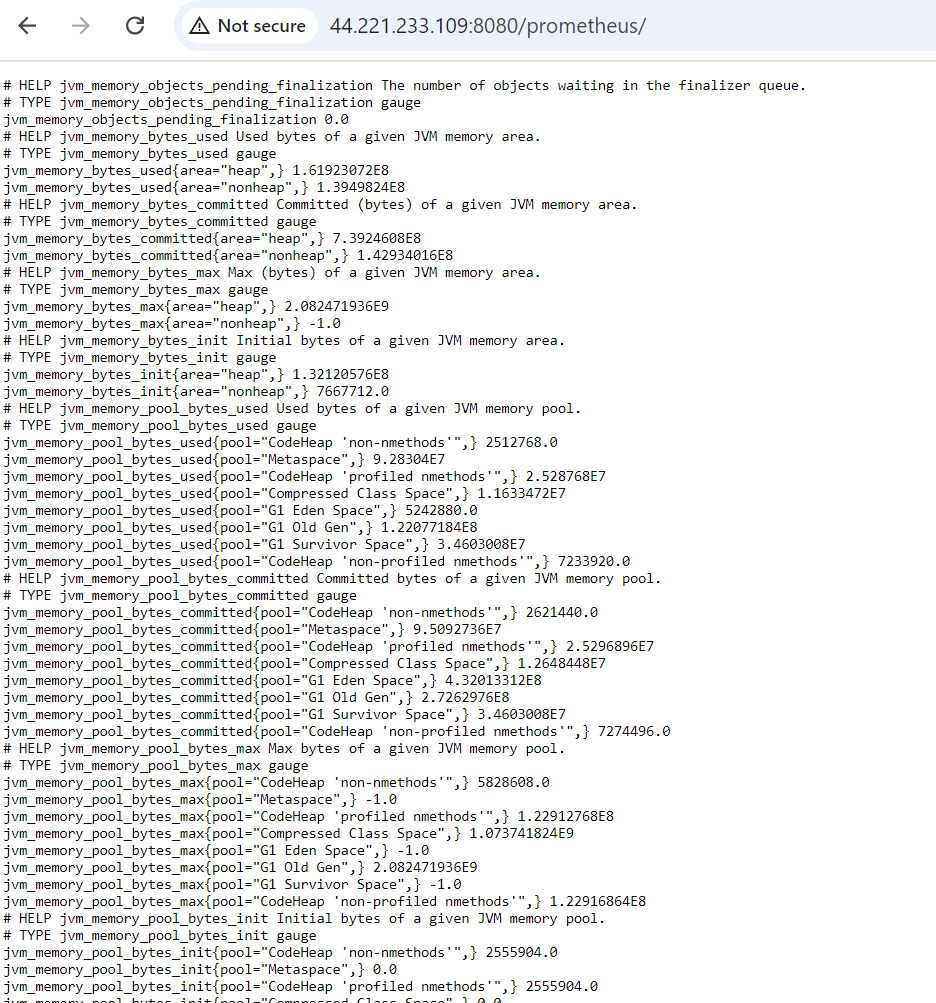
Access metrics thru jenkinsserveipaddress:8080/prometheus
Import Jenkins grafana dashboard
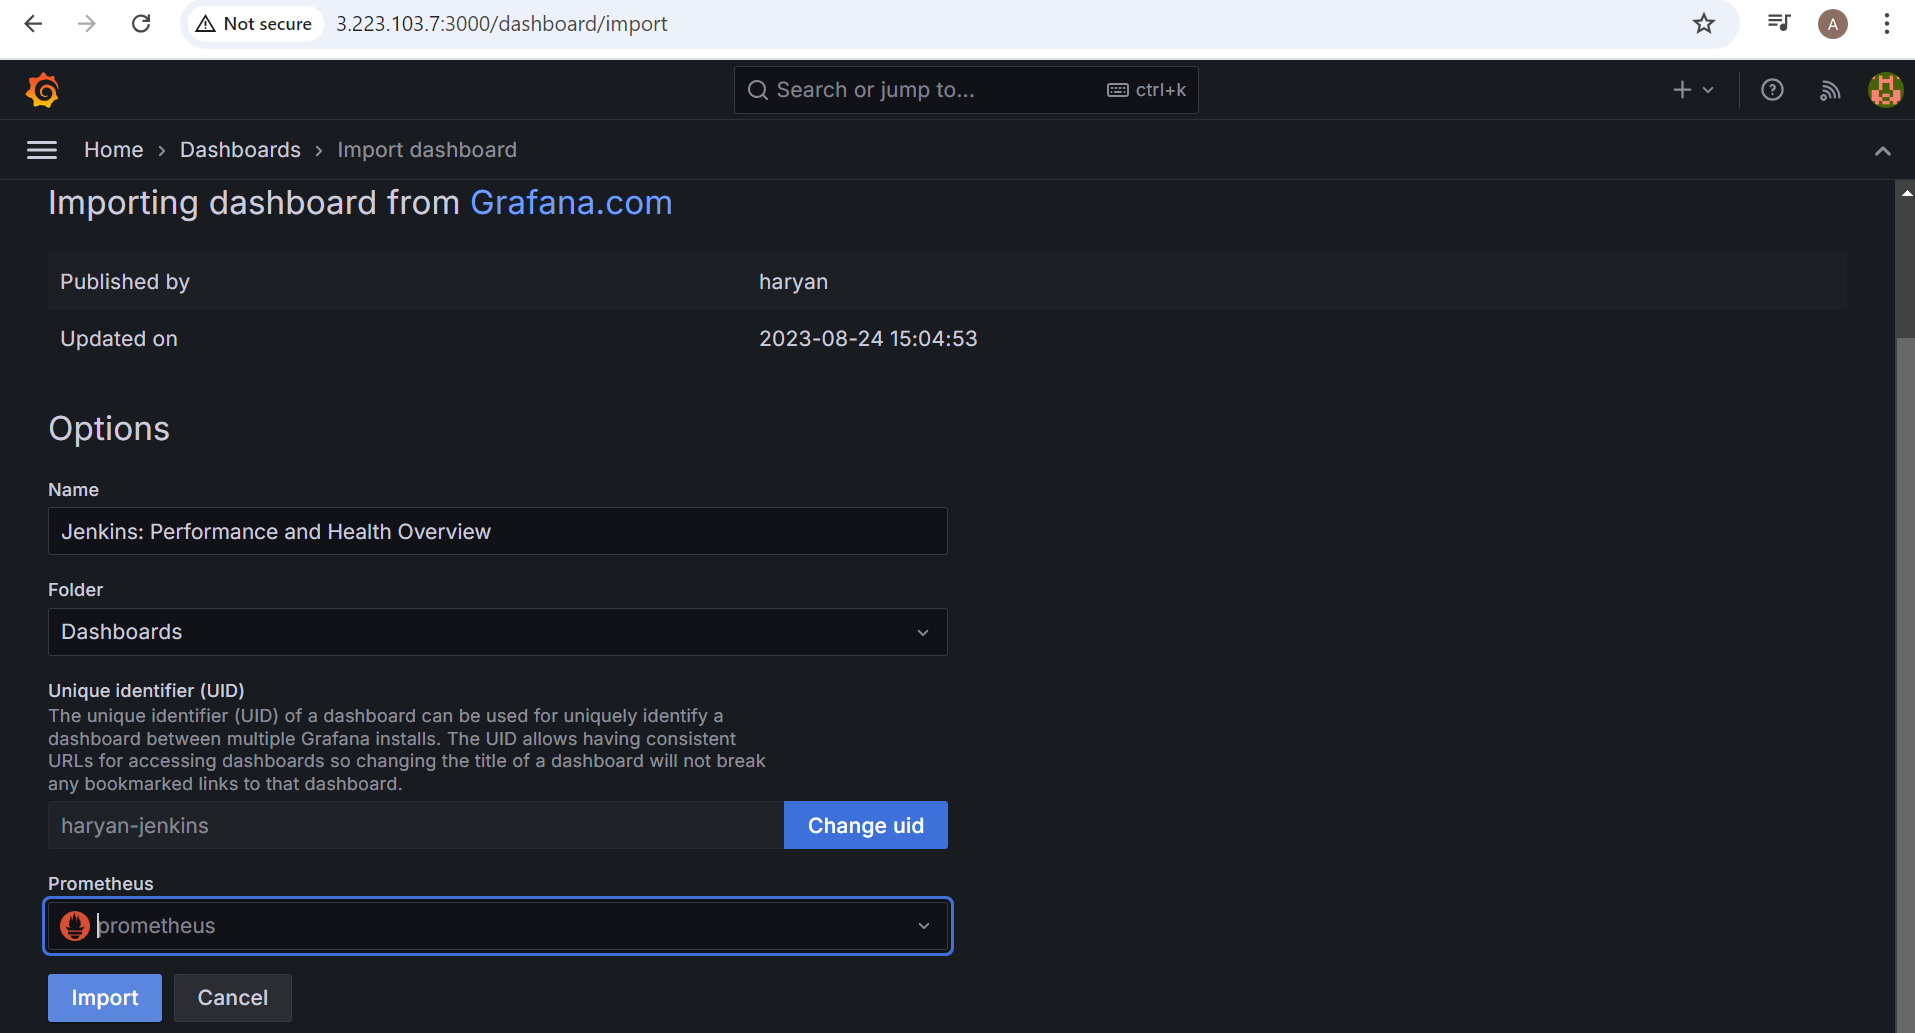
id:9964
This is the jenkins dahsboard looks like
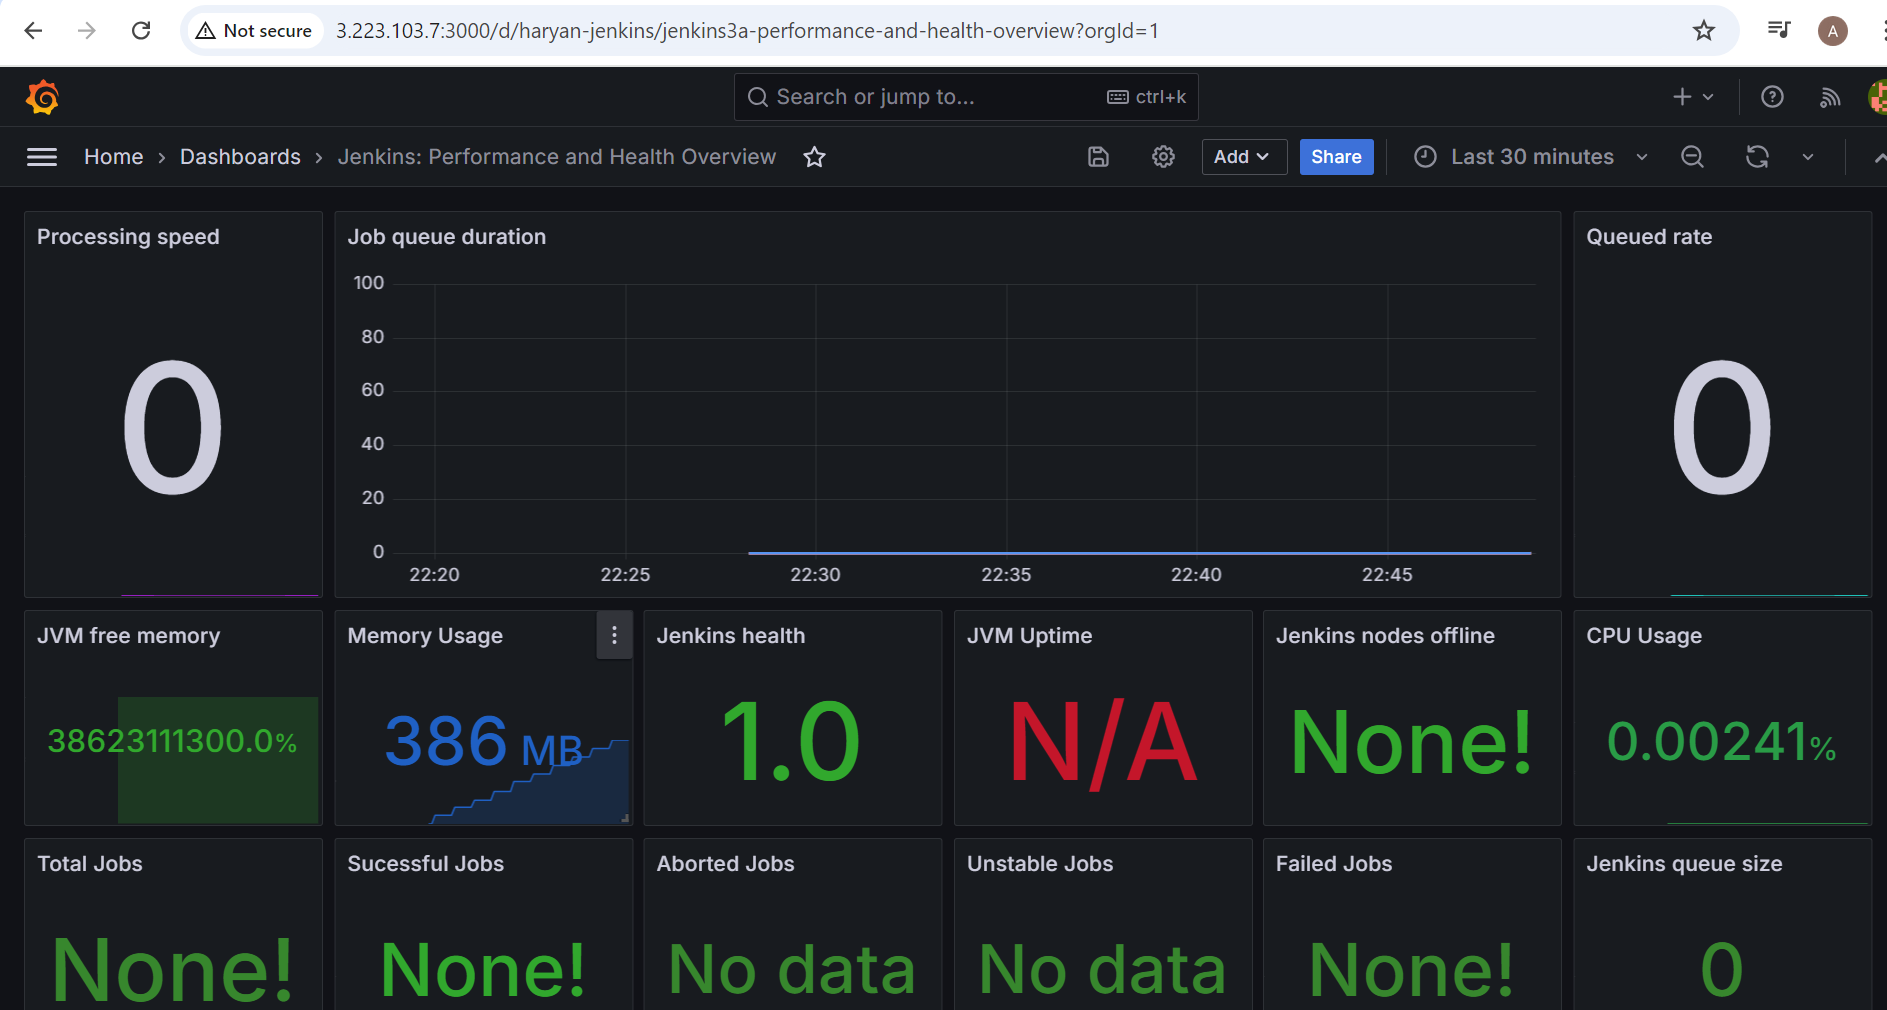
run the build again and check the dashboard.
0
Subscribe to my newsletter
Read articles from Aasifa Shaik directly inside your inbox. Subscribe to the newsletter, and don't miss out.
Written by

Aasifa Shaik
Aasifa Shaik
I am a DevSecOps Engineer at Renesas, where I specialize in integrating security practices within the DevOps pipeline. My work focuses on automating security, ensuring compliance, and securing applications throughout their lifecycle.