Instacart Market Basket Analysis
 Precious Hezekiah
Overview
The Instacart Market Basket Analysis project aims to explore and analyze customer shopping behavior using transactional data from the Instacart platform. The dataset provided a rich source of information that can be used to derive valuable insights for optimizing operations and enhancing customer experiences.
This SQL project was posted on X by Splendor @iam_uchenna.
Tools Used
SQL
Power Bi
Data Description
Aisles.csv - Contains information about different product categories (aisles).
Departments.csv - Provides details about various departments within the store.
Order_products__prior.csv - Includes information about products included in prior customer orders.
Order_products__train.csv - Contains details about products in the training set of customer.
Orders. orders.csv - Provides information about individual orders and customers.
Products.csv - Contains details about products, including aisle and department IDs.
Data Cleaning
The dataset was cleaned and processed using SQL to ensure consistency and accuracy.
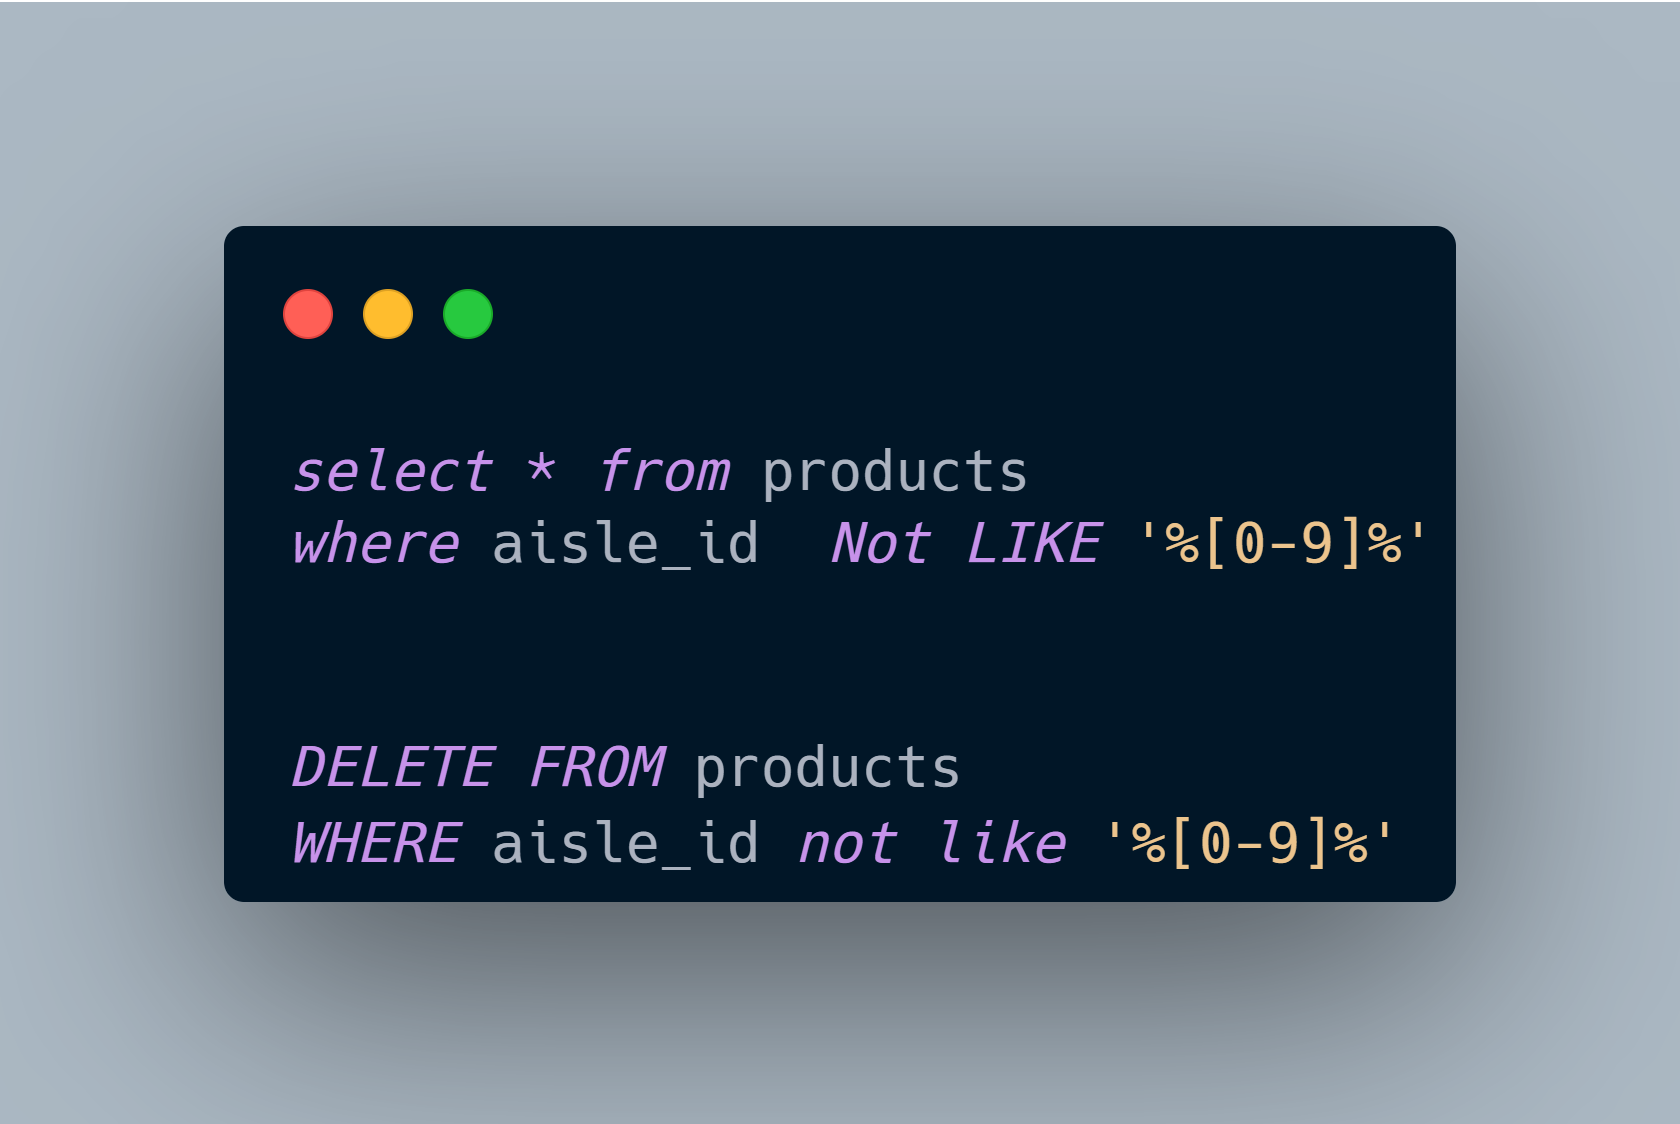
In particular, the aisles table initially contained some aisle_id values that included letters, despite the aisle_id column being defined as an integer. These invalid entries were identified and removed during the cleaning process. After cleaning, the table retained 134 valid aisle_id values, all of which were now properly formatted as integers. Using this query,
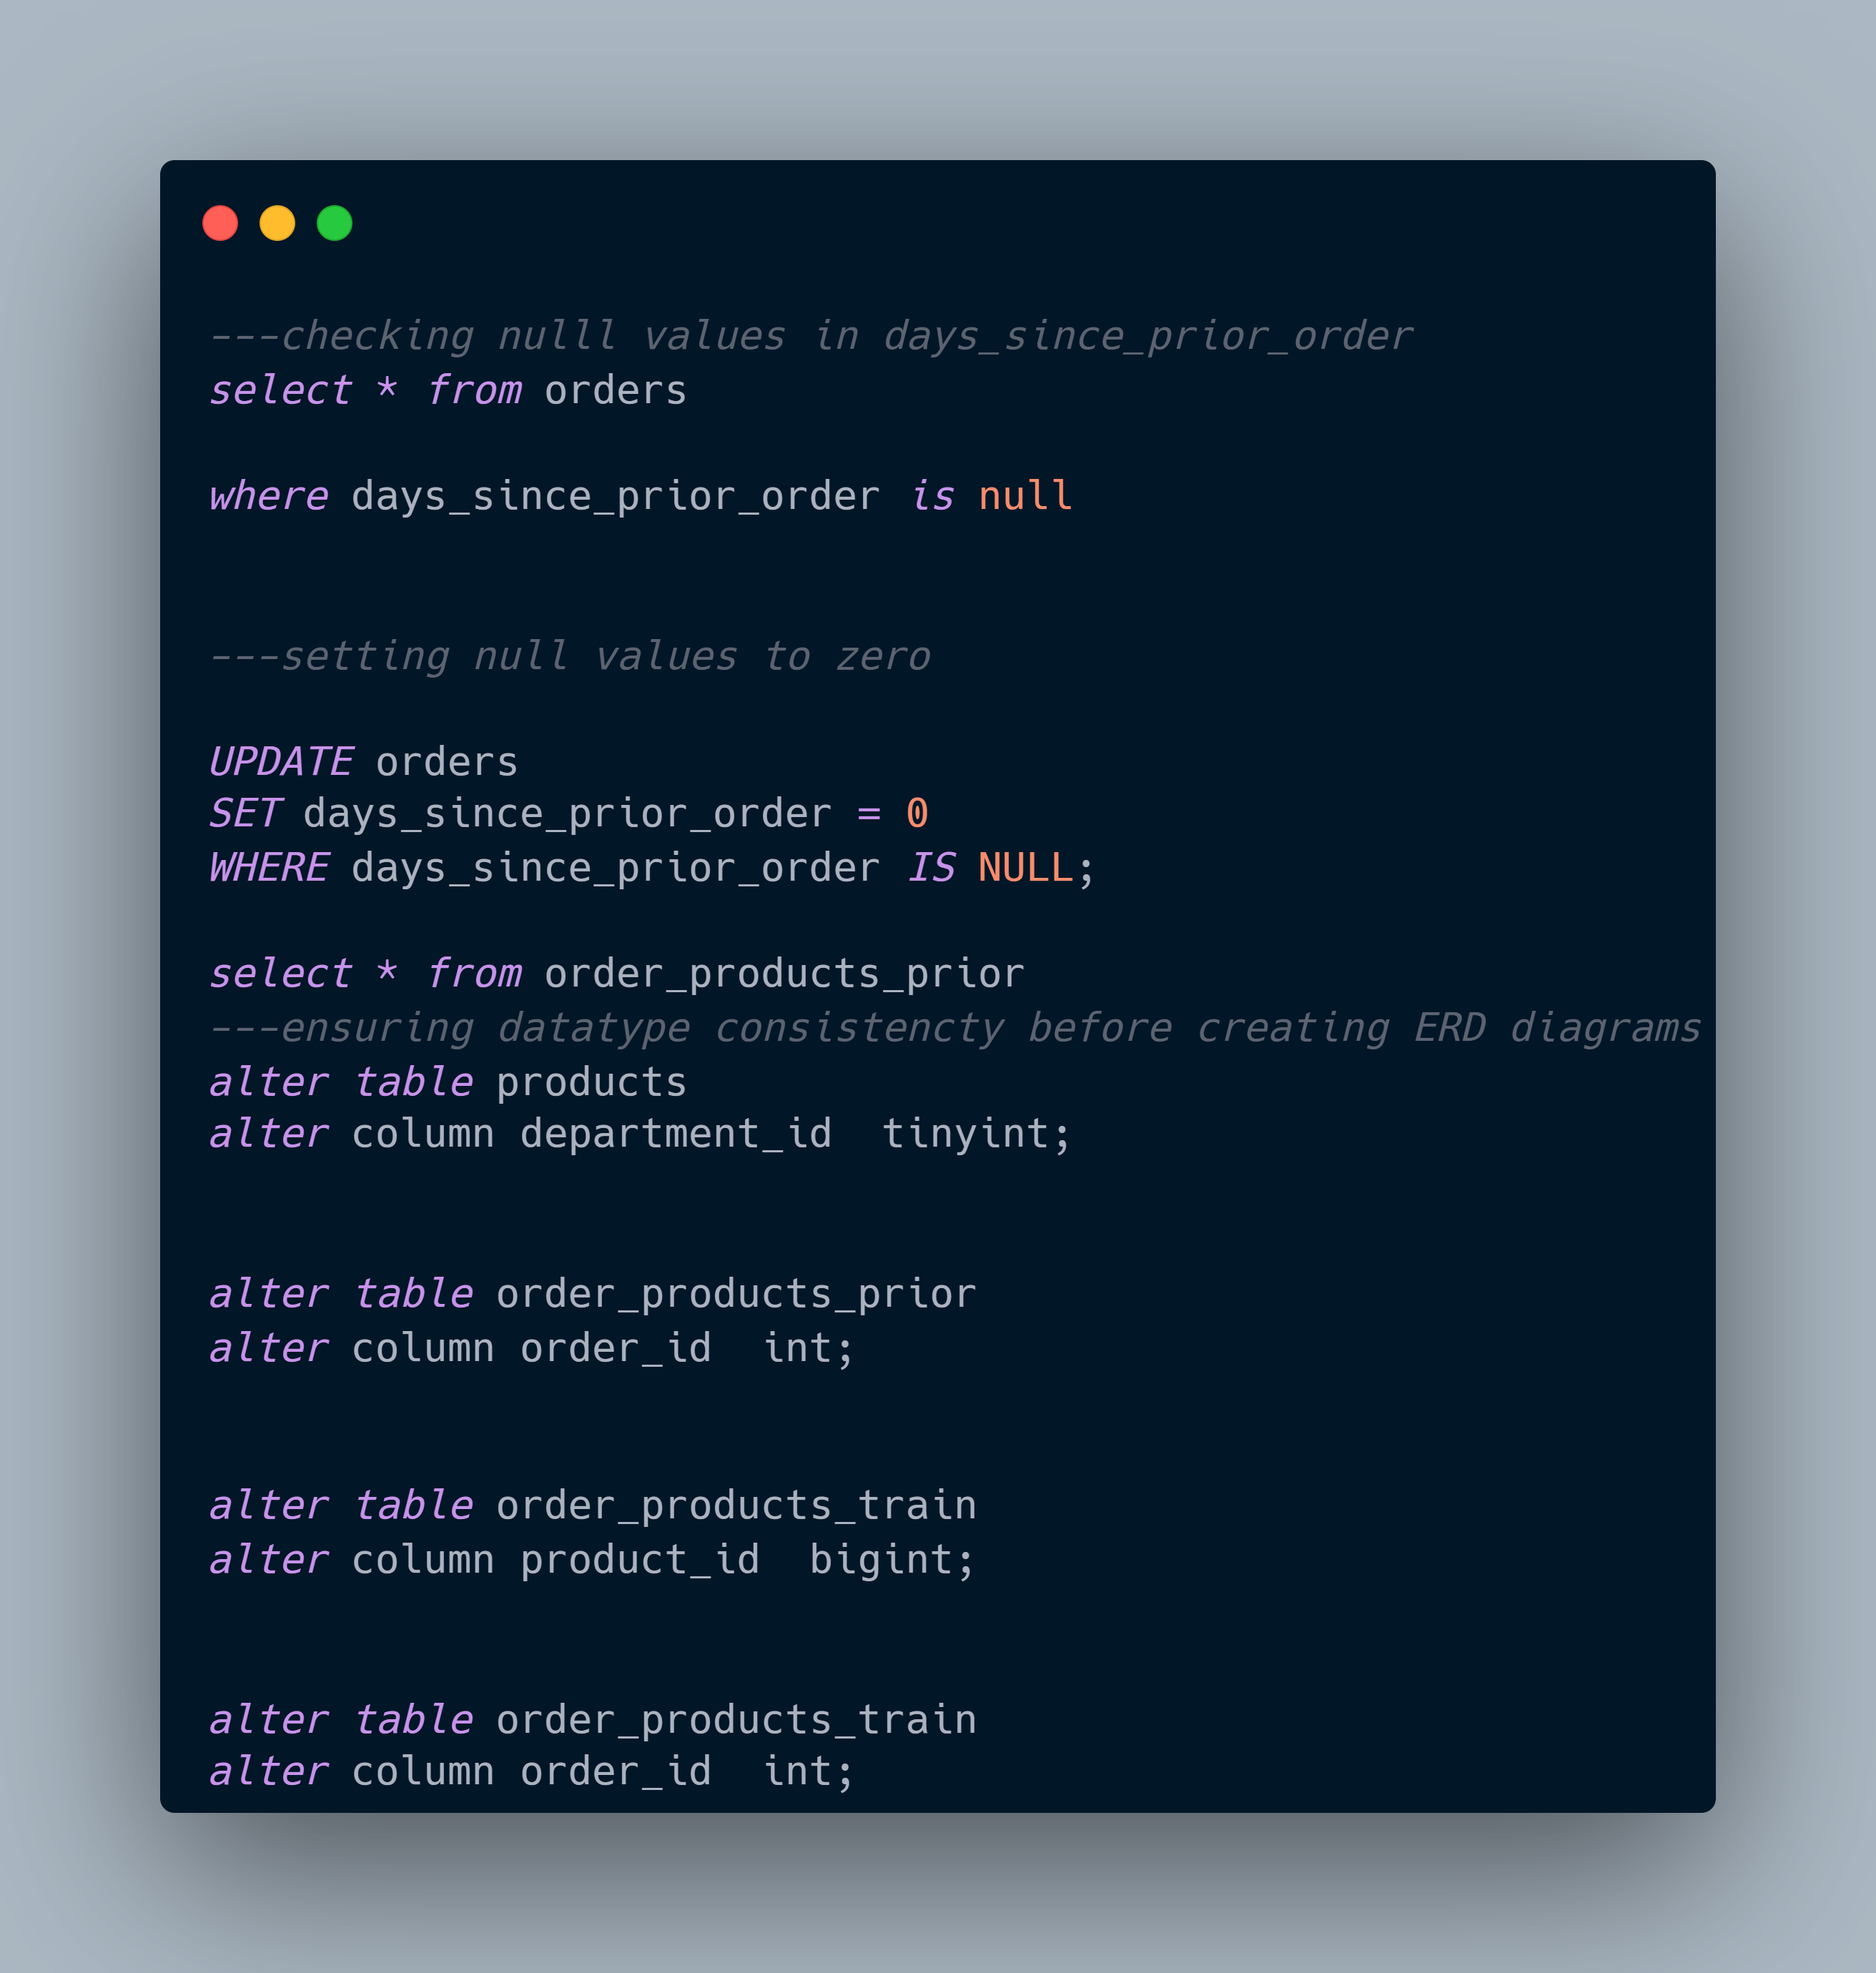
The Orders table contained null values in the days_since_prior_order column. These null values were replaced with zero to maintain data consistency.
An Entity Relationship Diagram (ERD) was created after ensuring that primary keys were assigned to each table. Additionally, the data types of both primary keys and foreign keys were verified to ensure consistency across related tables.
Data Analysis and Insights
Market Basket Analysis:
Analysis: Identify frequently co-occurring products in orders to improve store layout and marketing strategies.
Questions:
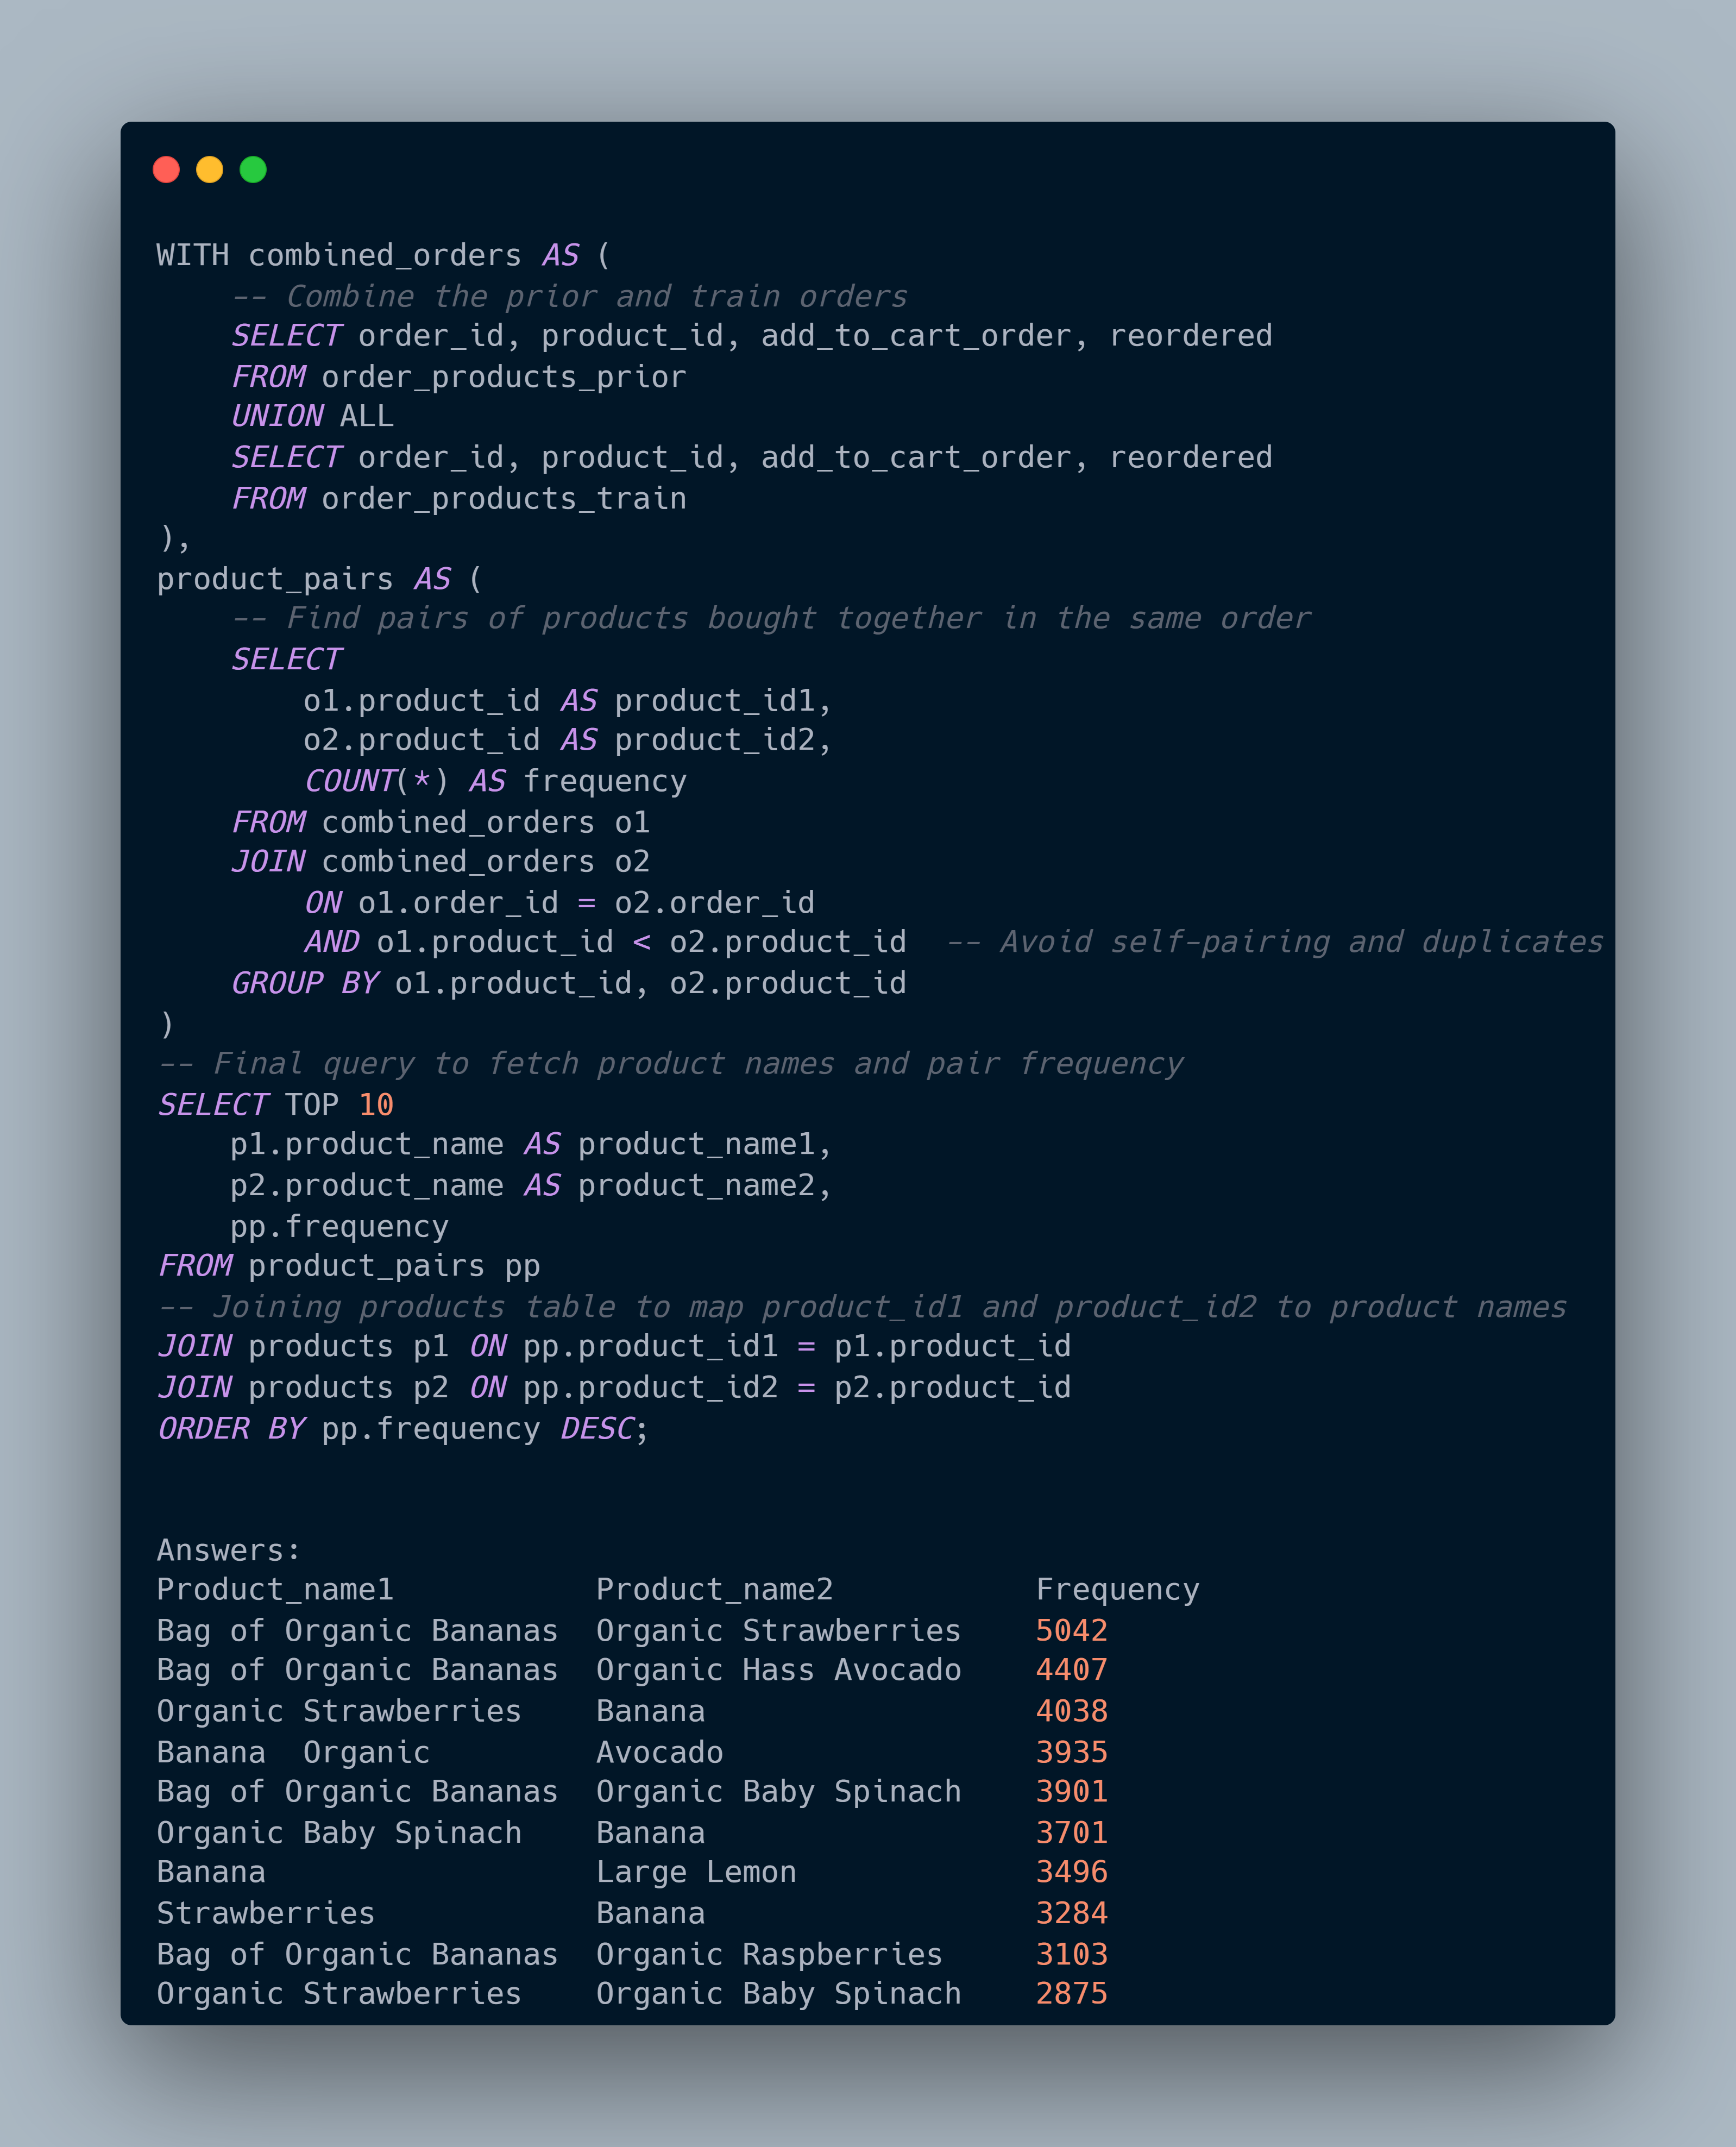
What are the top 10 product pairs that are most frequently purchased together?
What are the top 5 products that are most commonly added to the cart first?
How many unique products are typically included in a single order?
Queries:
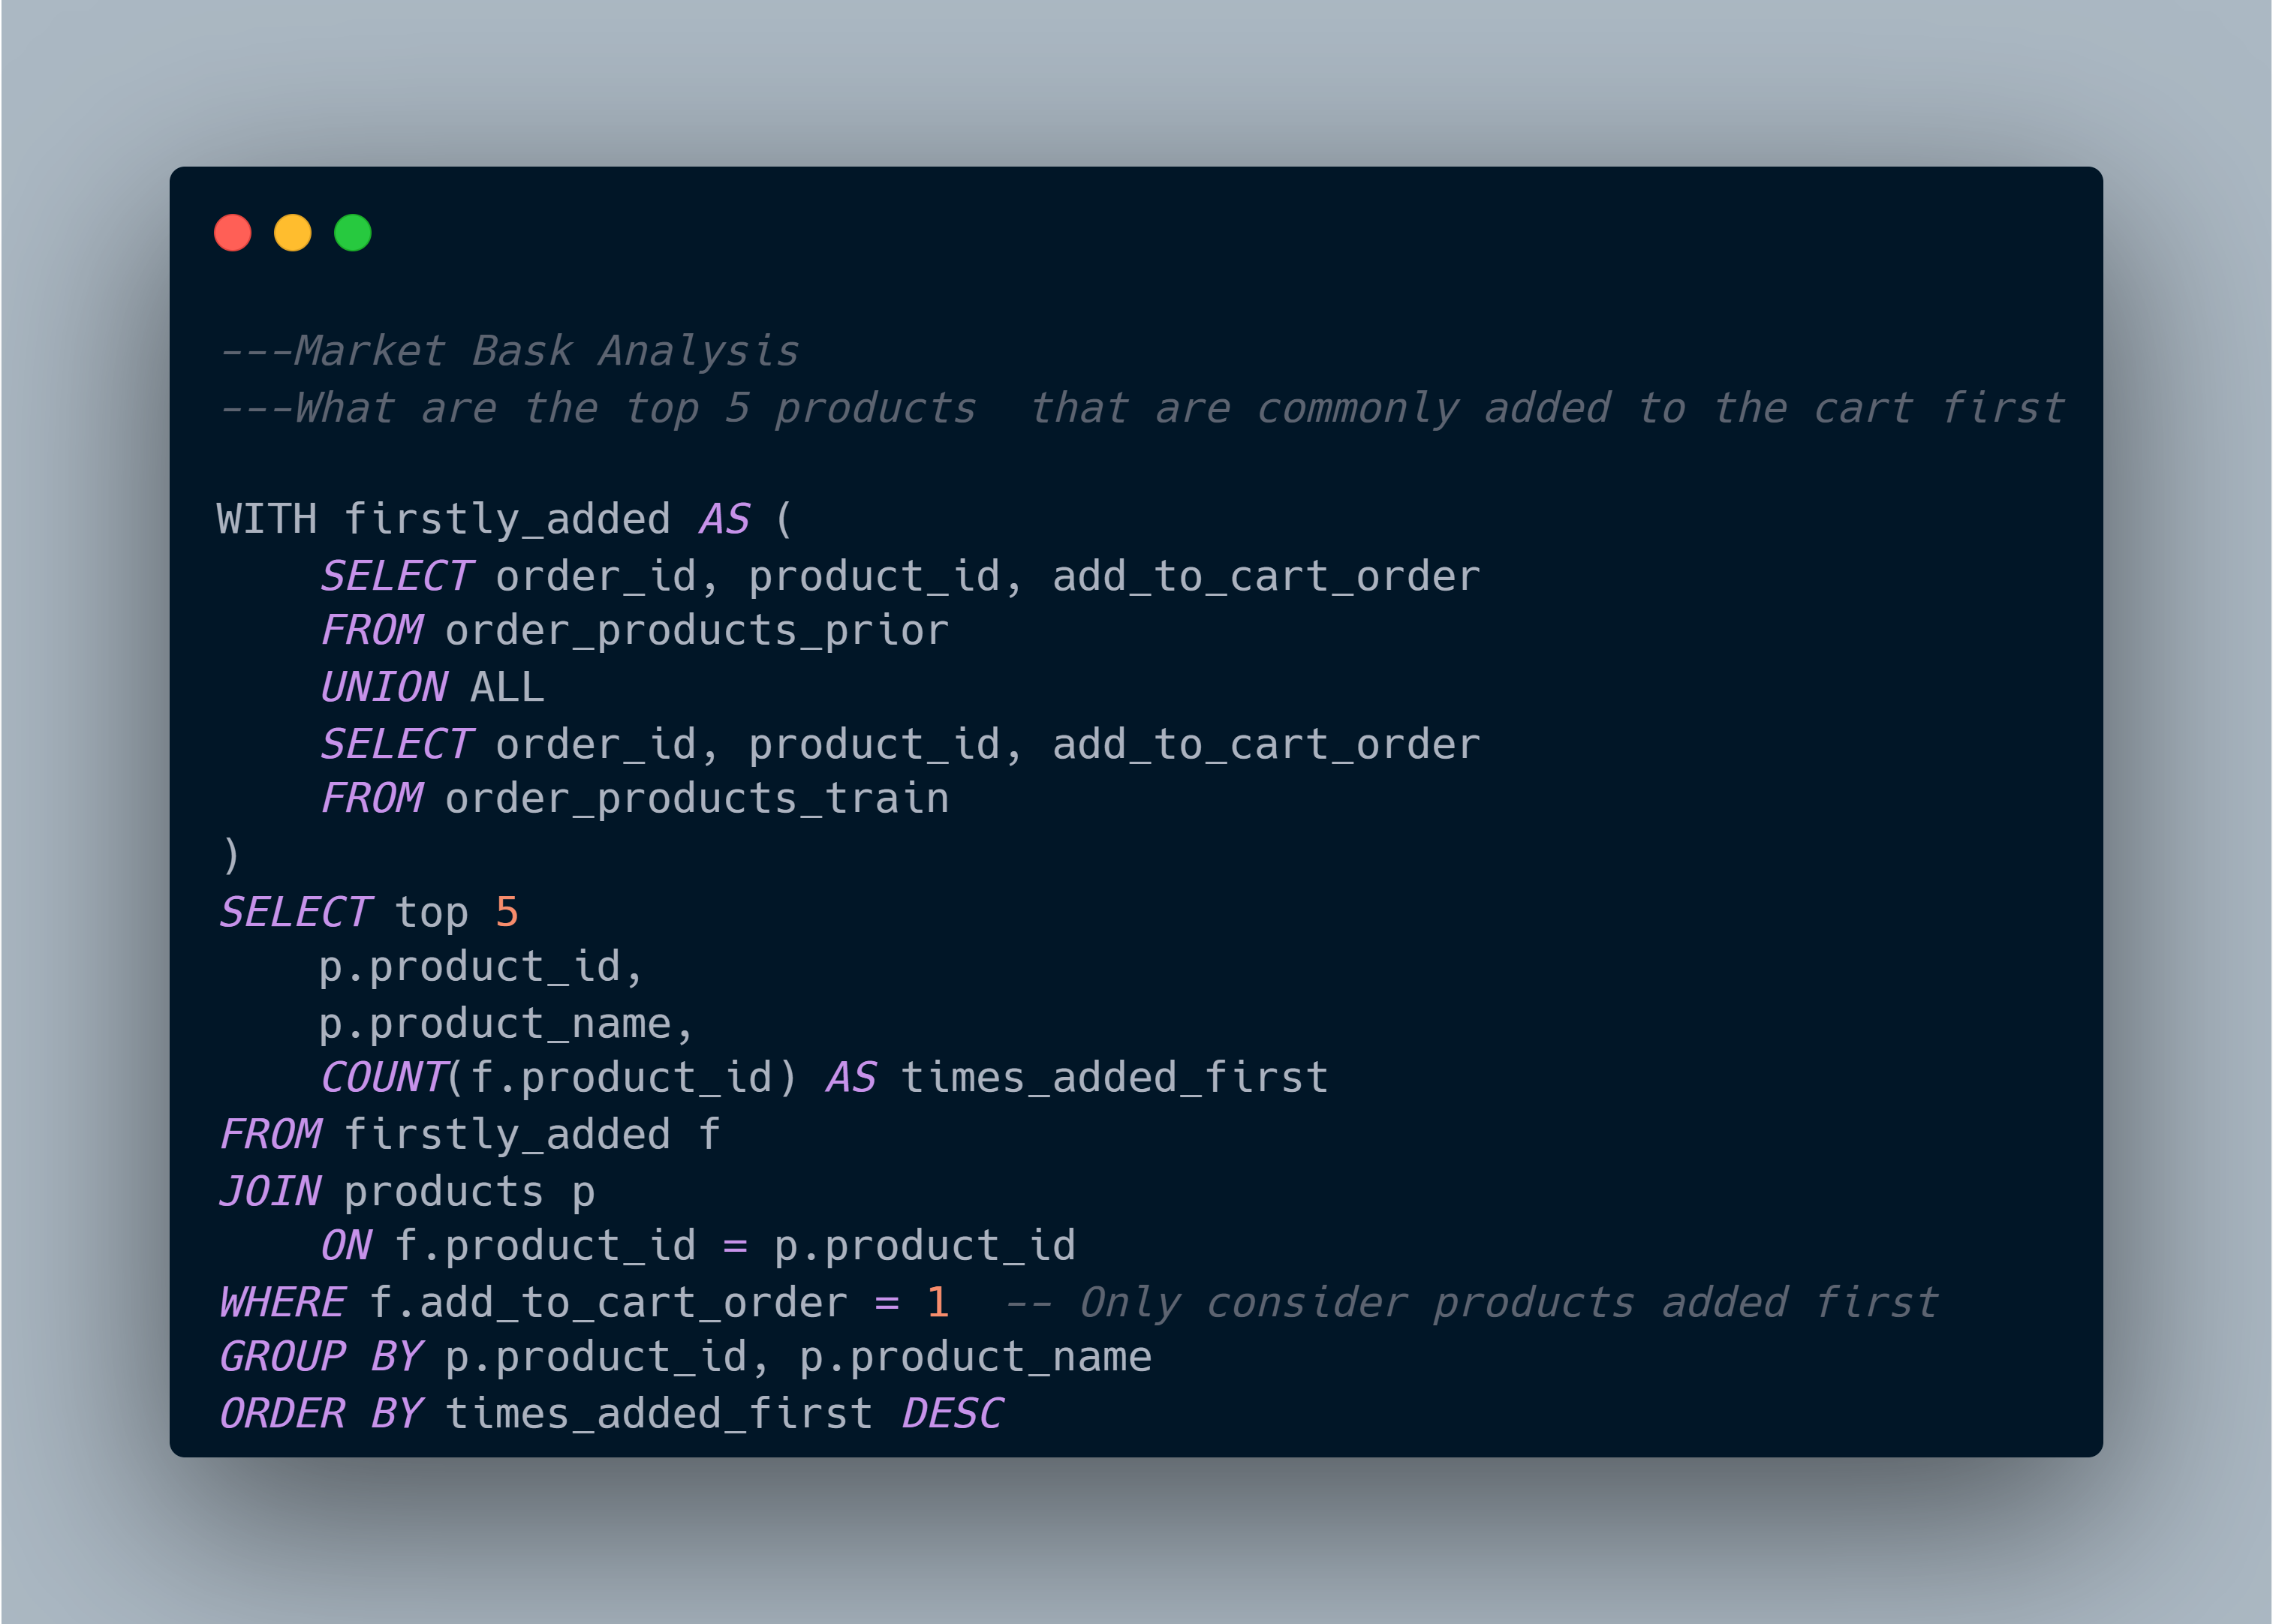
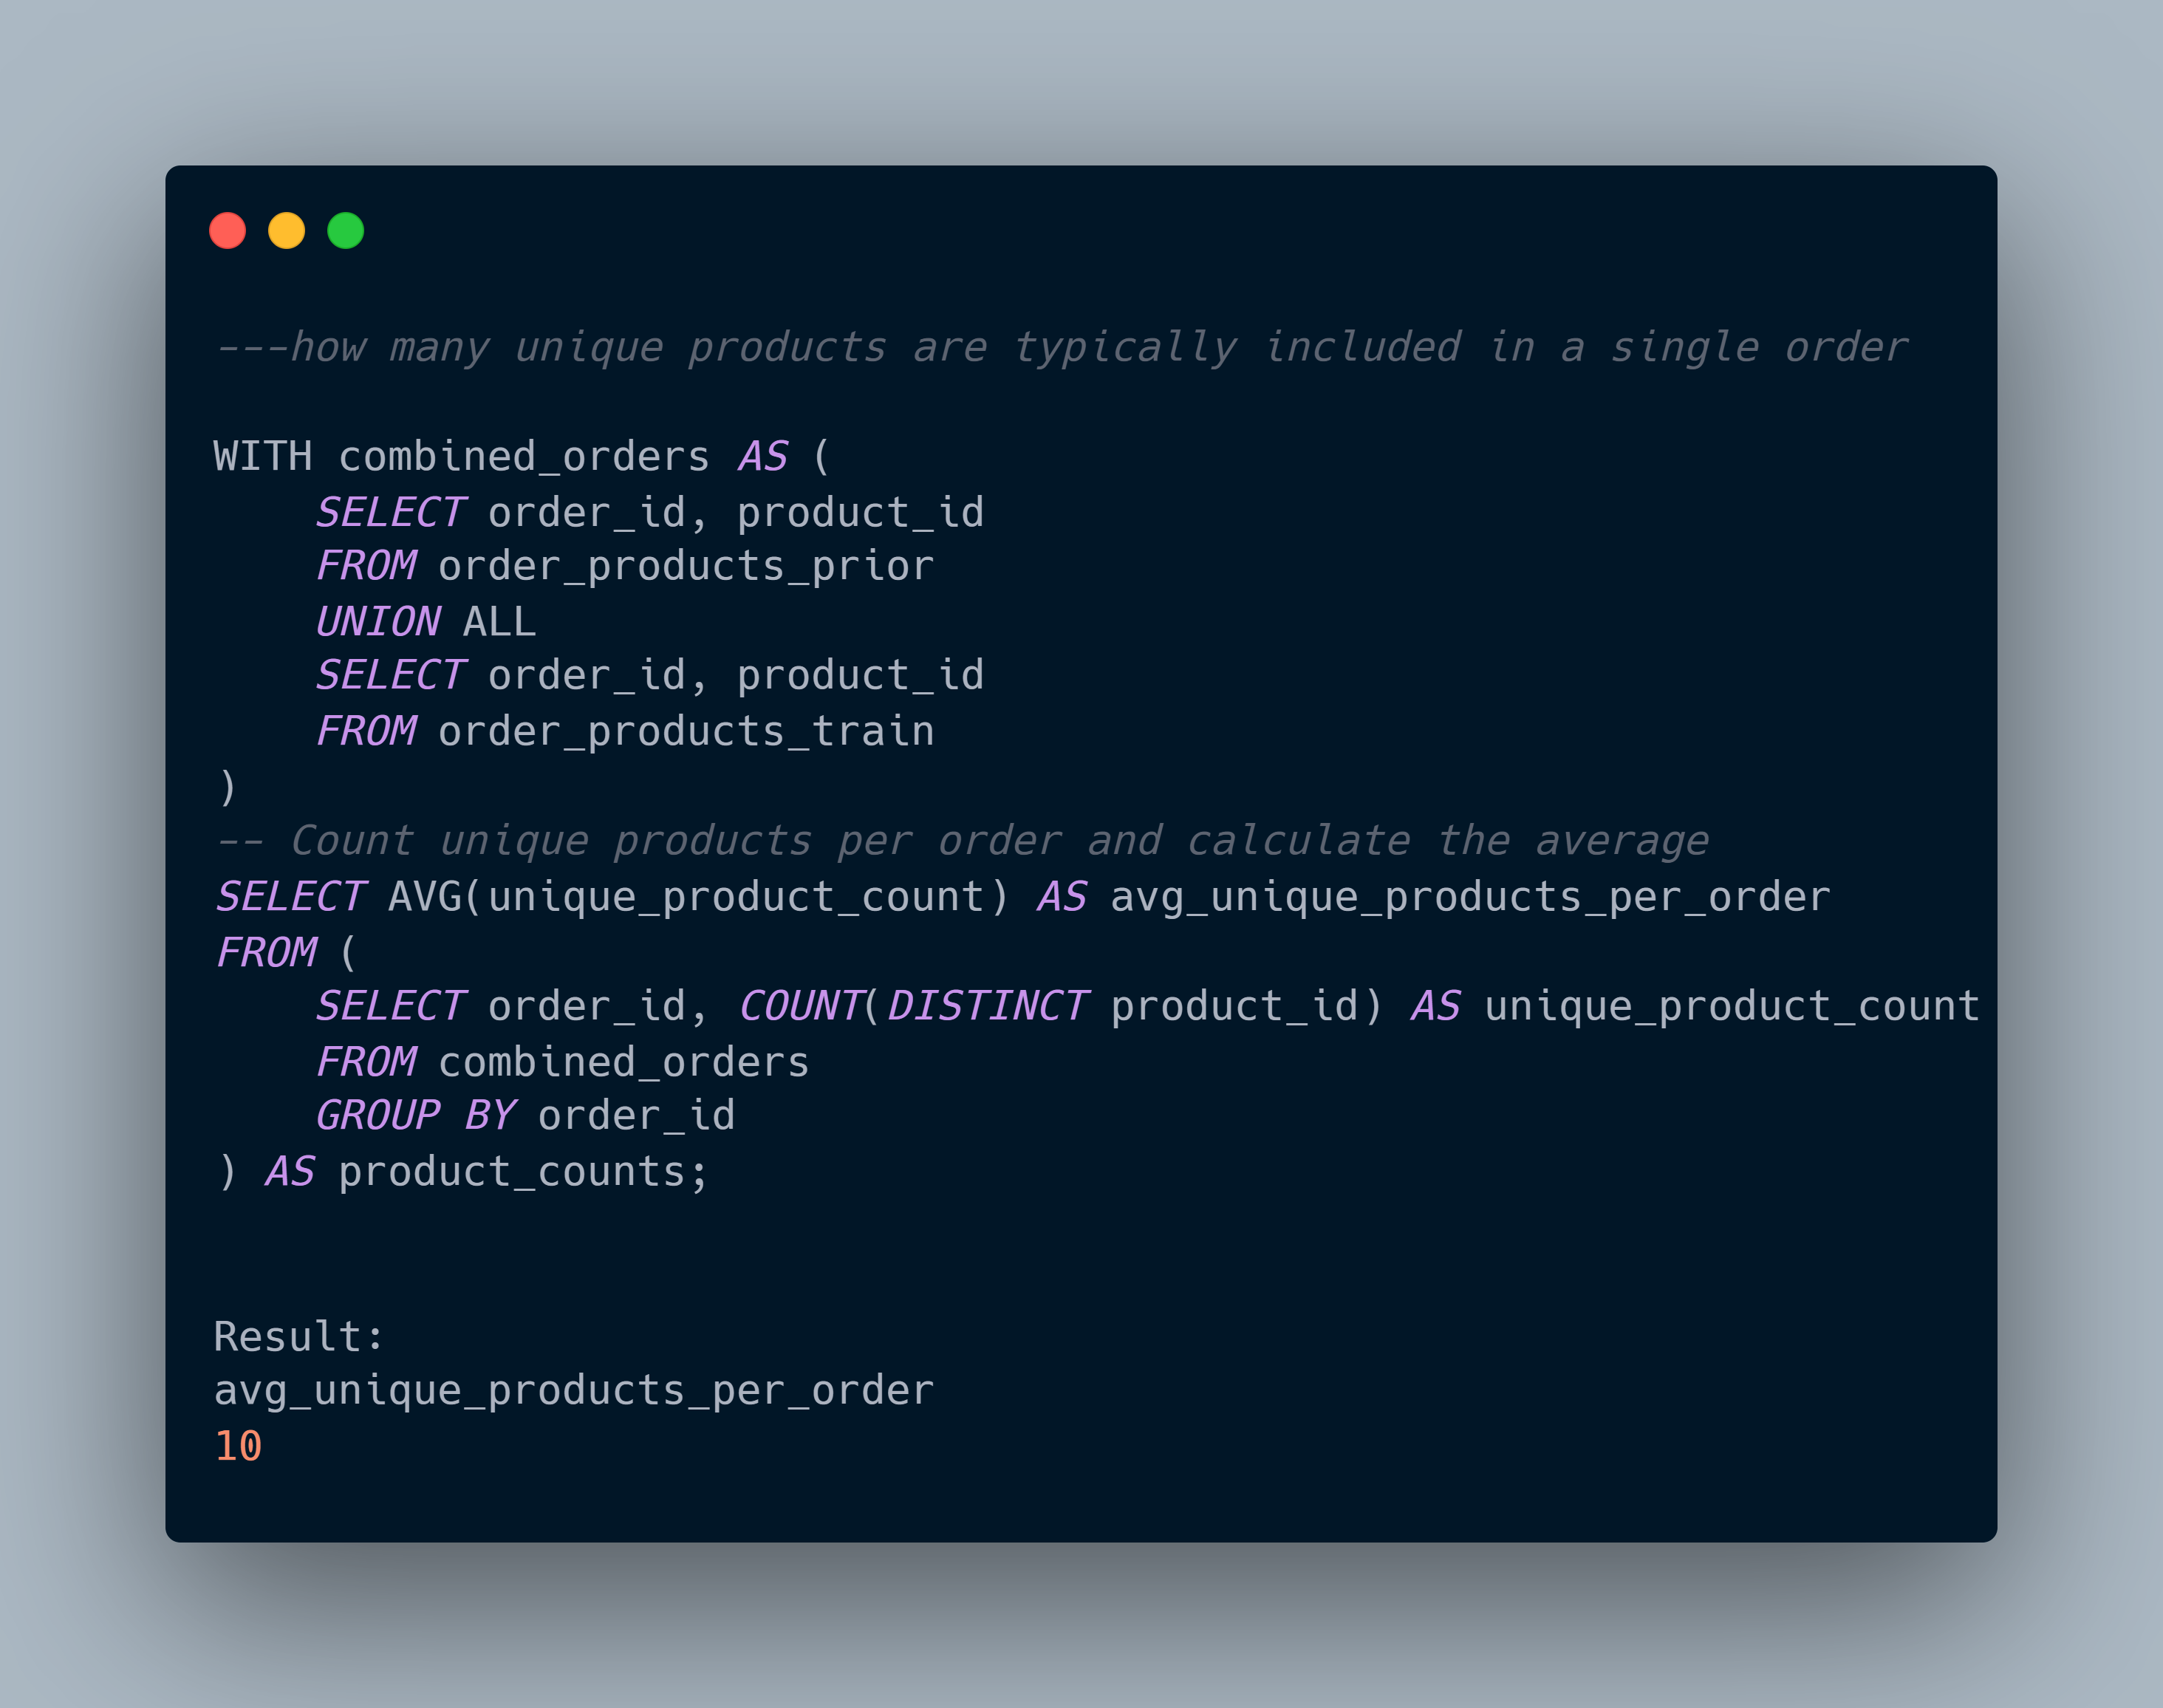
Insights:
Organic Trend:
- Given that many of the most frequently purchased products are organic, there's a clear trend toward organic and healthier options.
Customer Segmentation:
- Customers purchasing organic products may belong to a specific demographic (health-conscious, higher income).
Price Sensitivity:
- Given the high purchase frequency of organic products, this suggests that customers may not be as price-sensitive with organic items as they are with conventional products.
Customer Segmentation:
Analysis: Group customers based on their purchasing behavior for targeted marketing efforts.
Questions:
Can we categorize customers based on the total amount they've spent on orders?
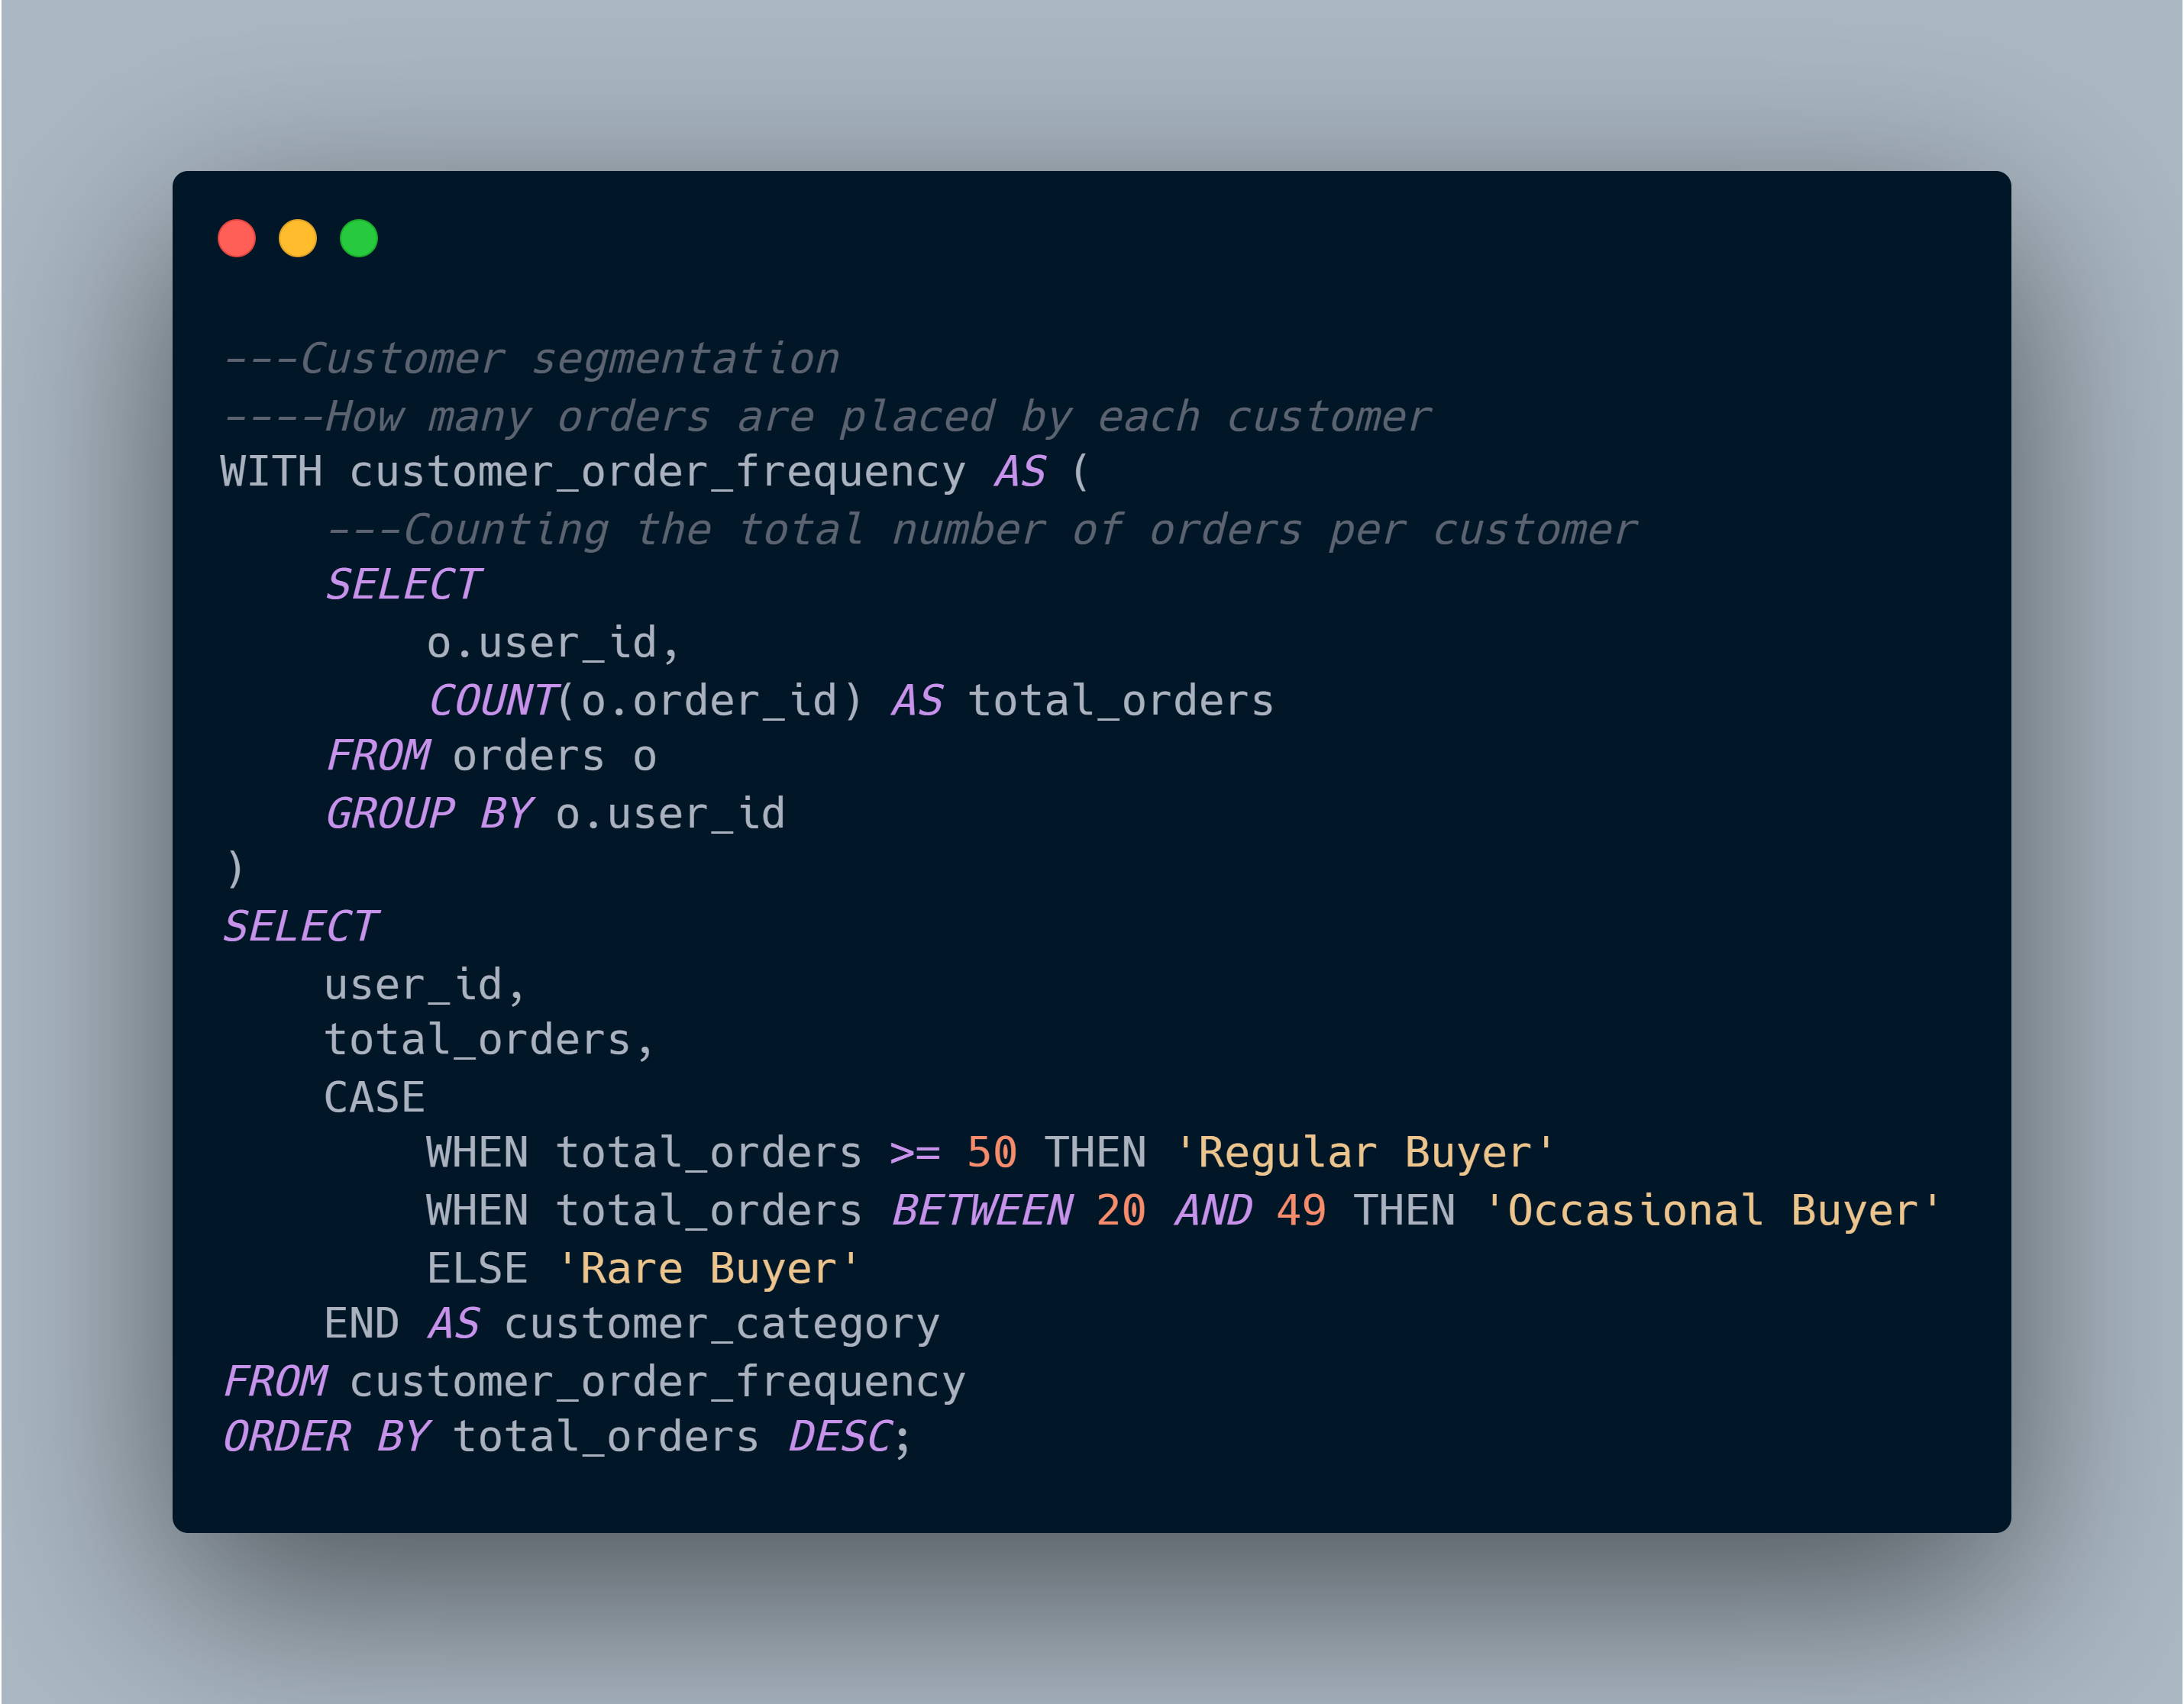
What are the different customer segments based on purchase frequency?
How many orders have been placed by each customer?
Queries:
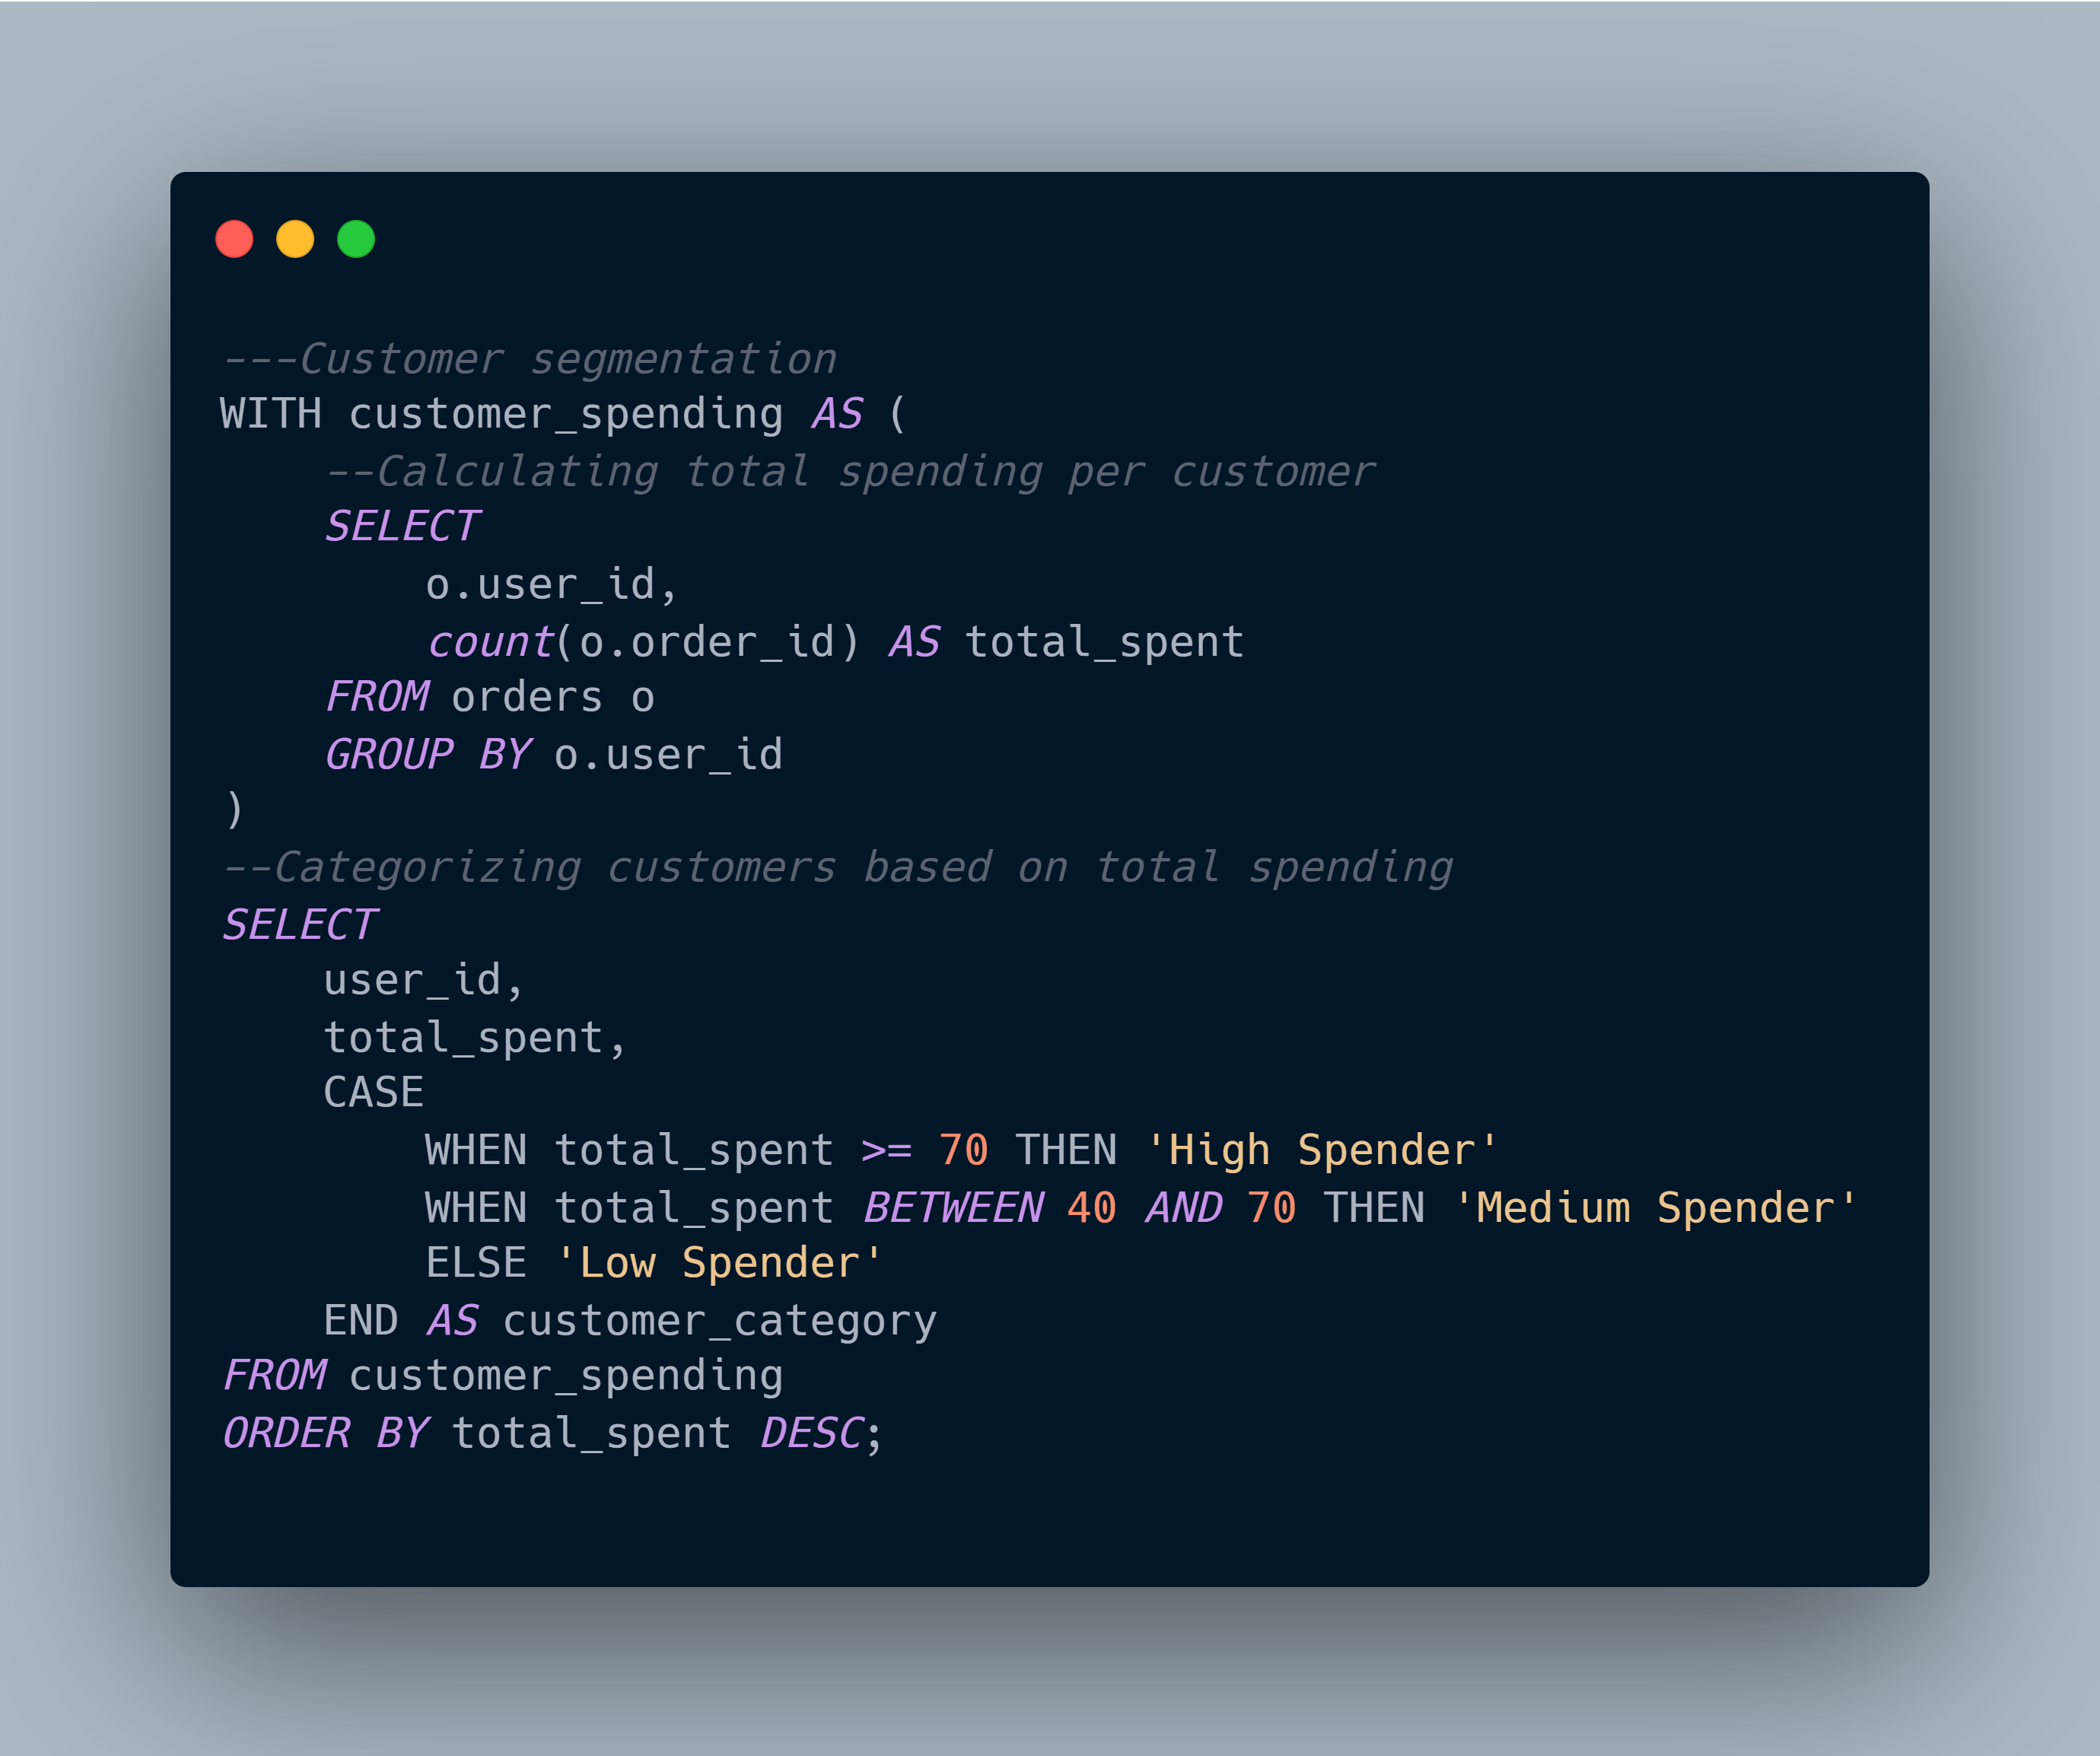
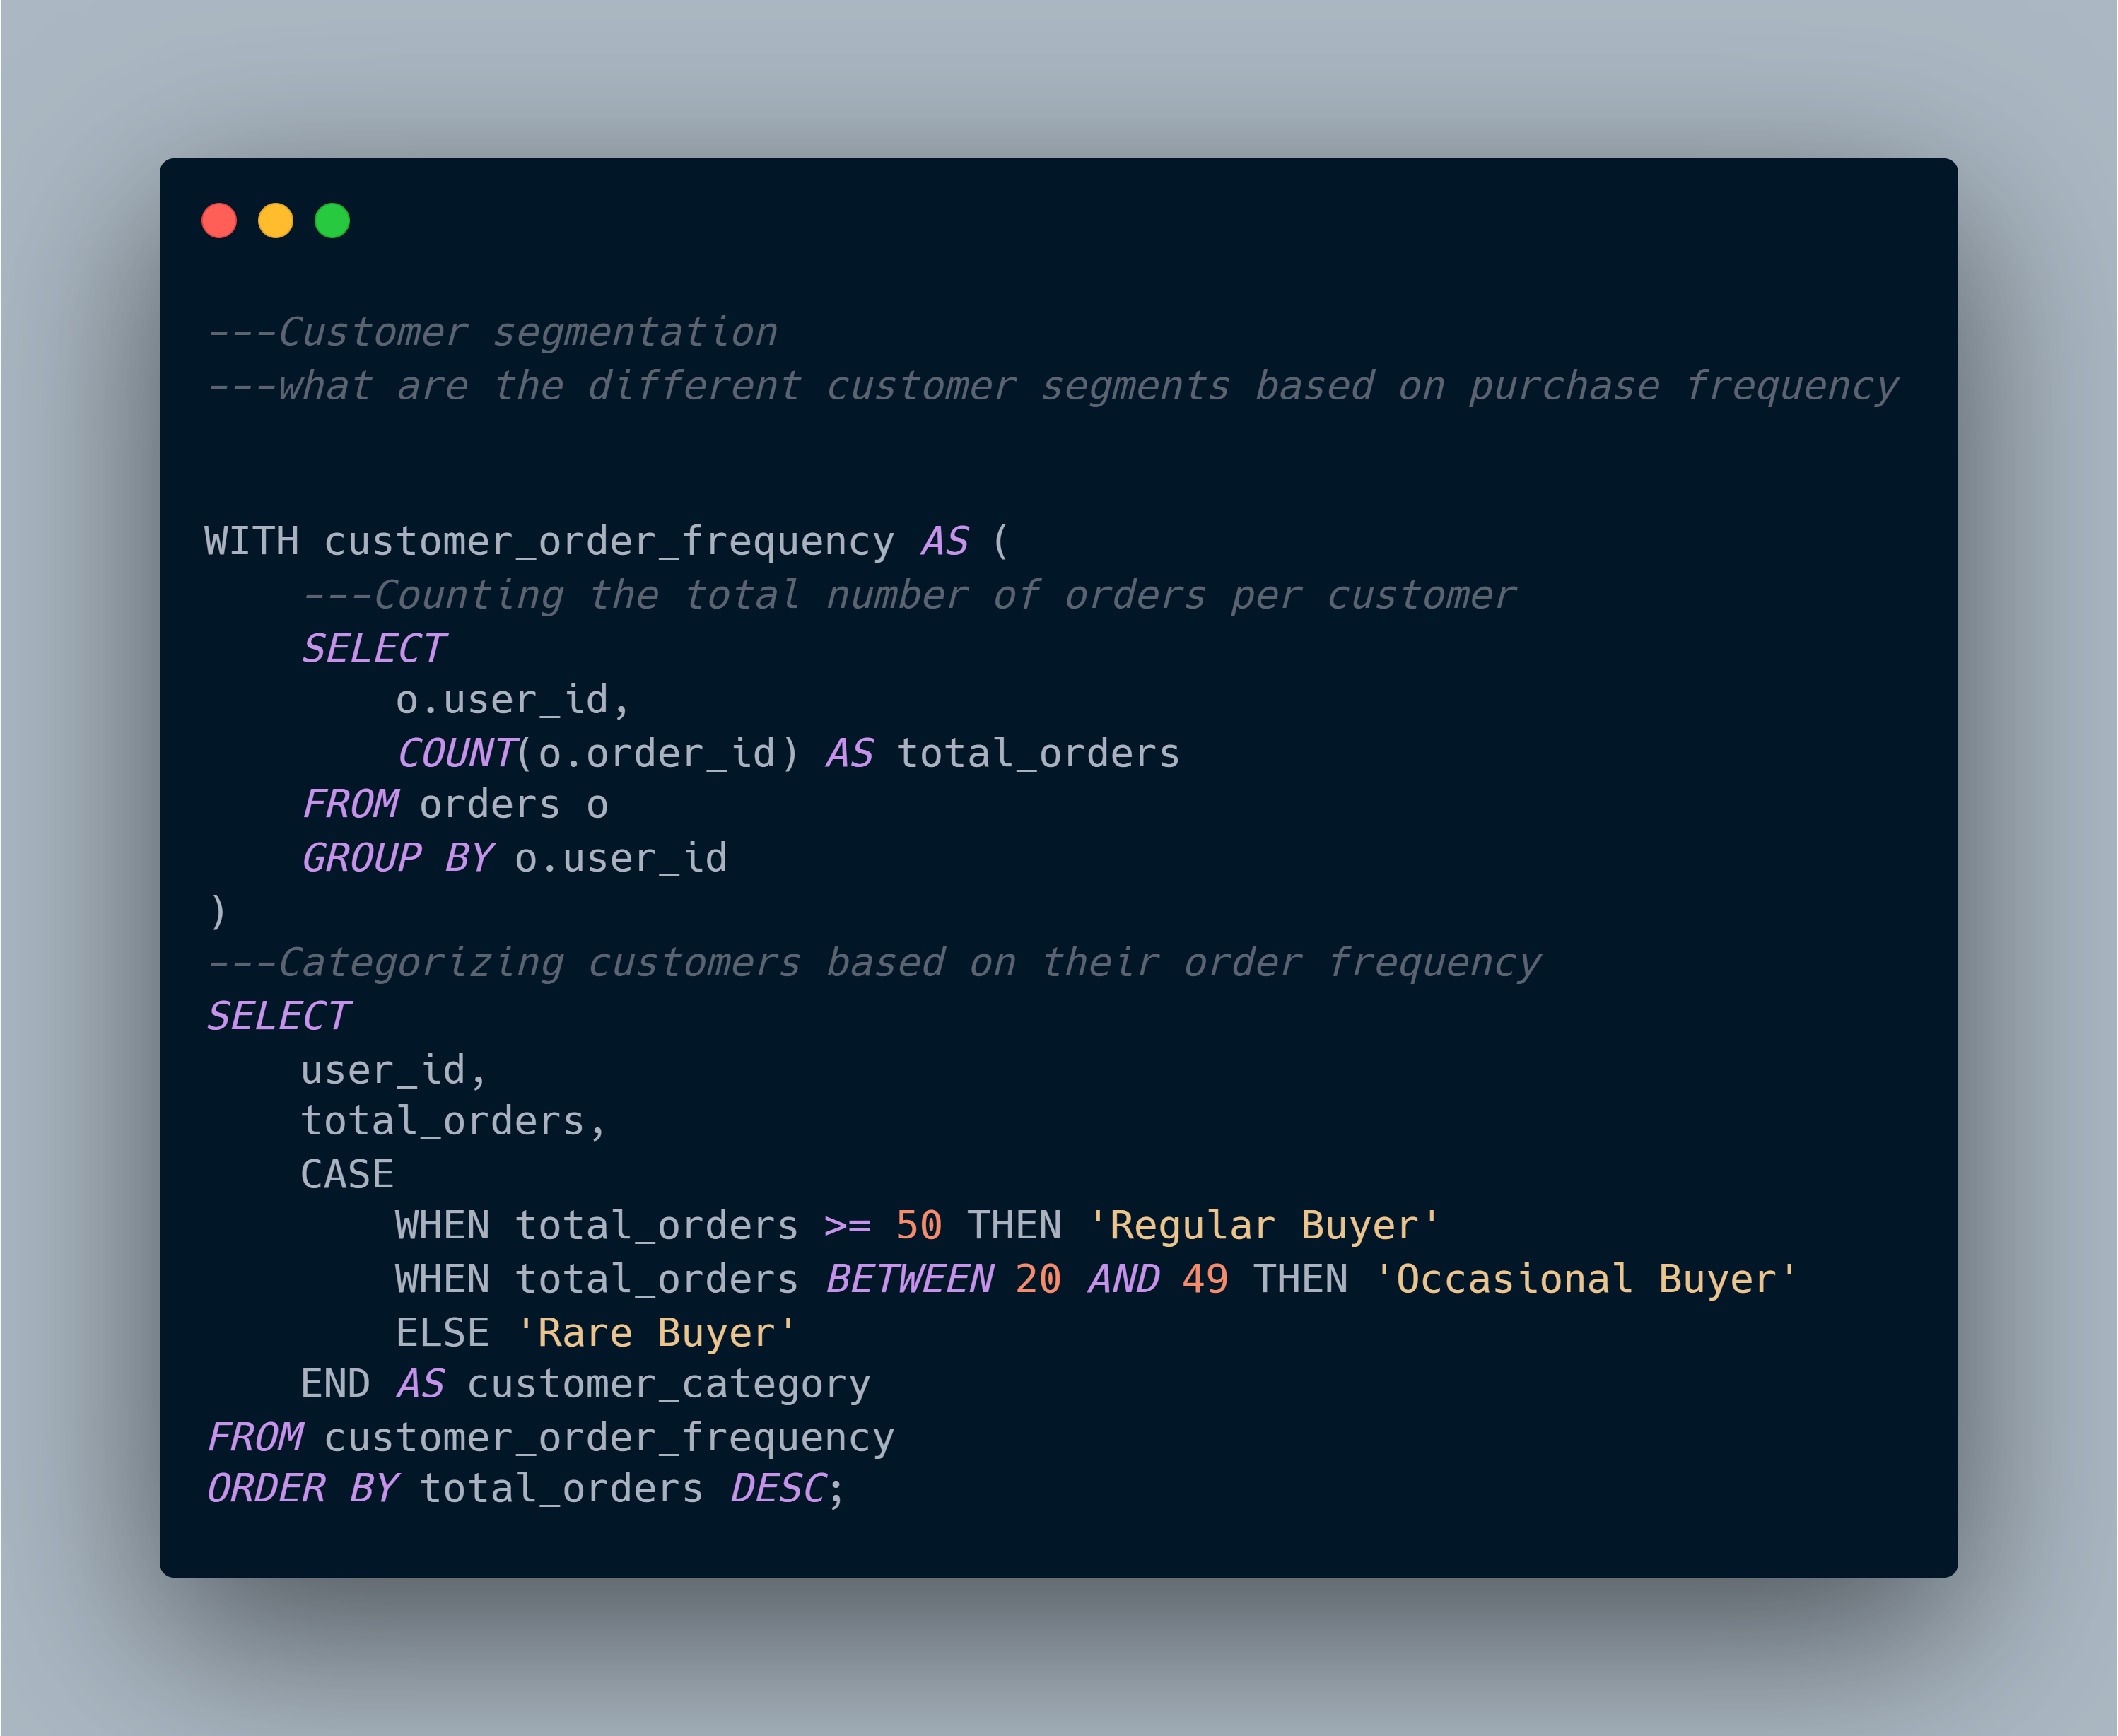
Insights
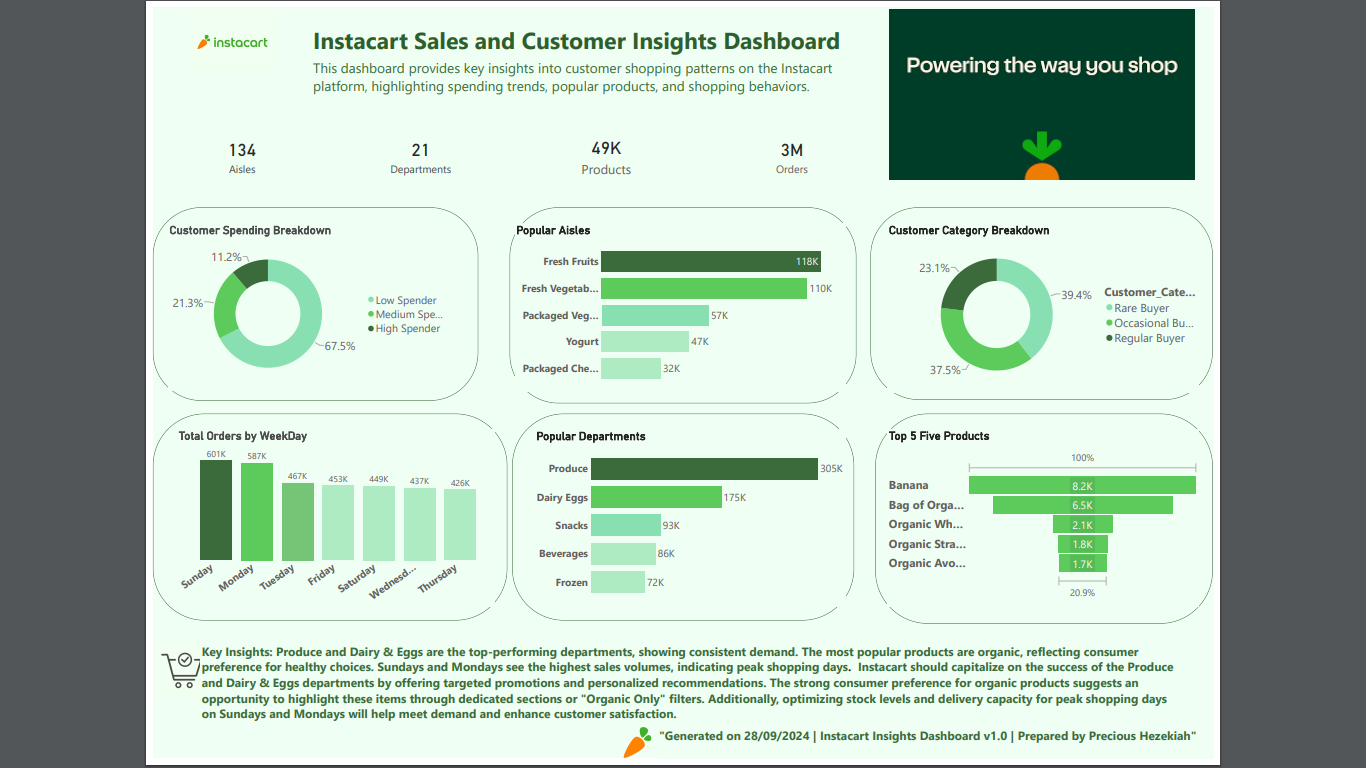
The customer base consists mostly of low spenders and rare buyers, Instacart needs to highlight an opportunity to convert them into higher spenders and more frequent purchasers. Medium spenders and occasional buyers represent a growth opportunity, while regular buyers and high spenders are key for retention and long-term loyalty.
Seasonal Trends Analysis:
Analysis: Identify seasonal patterns in customer behavior and product sales.
Questions:
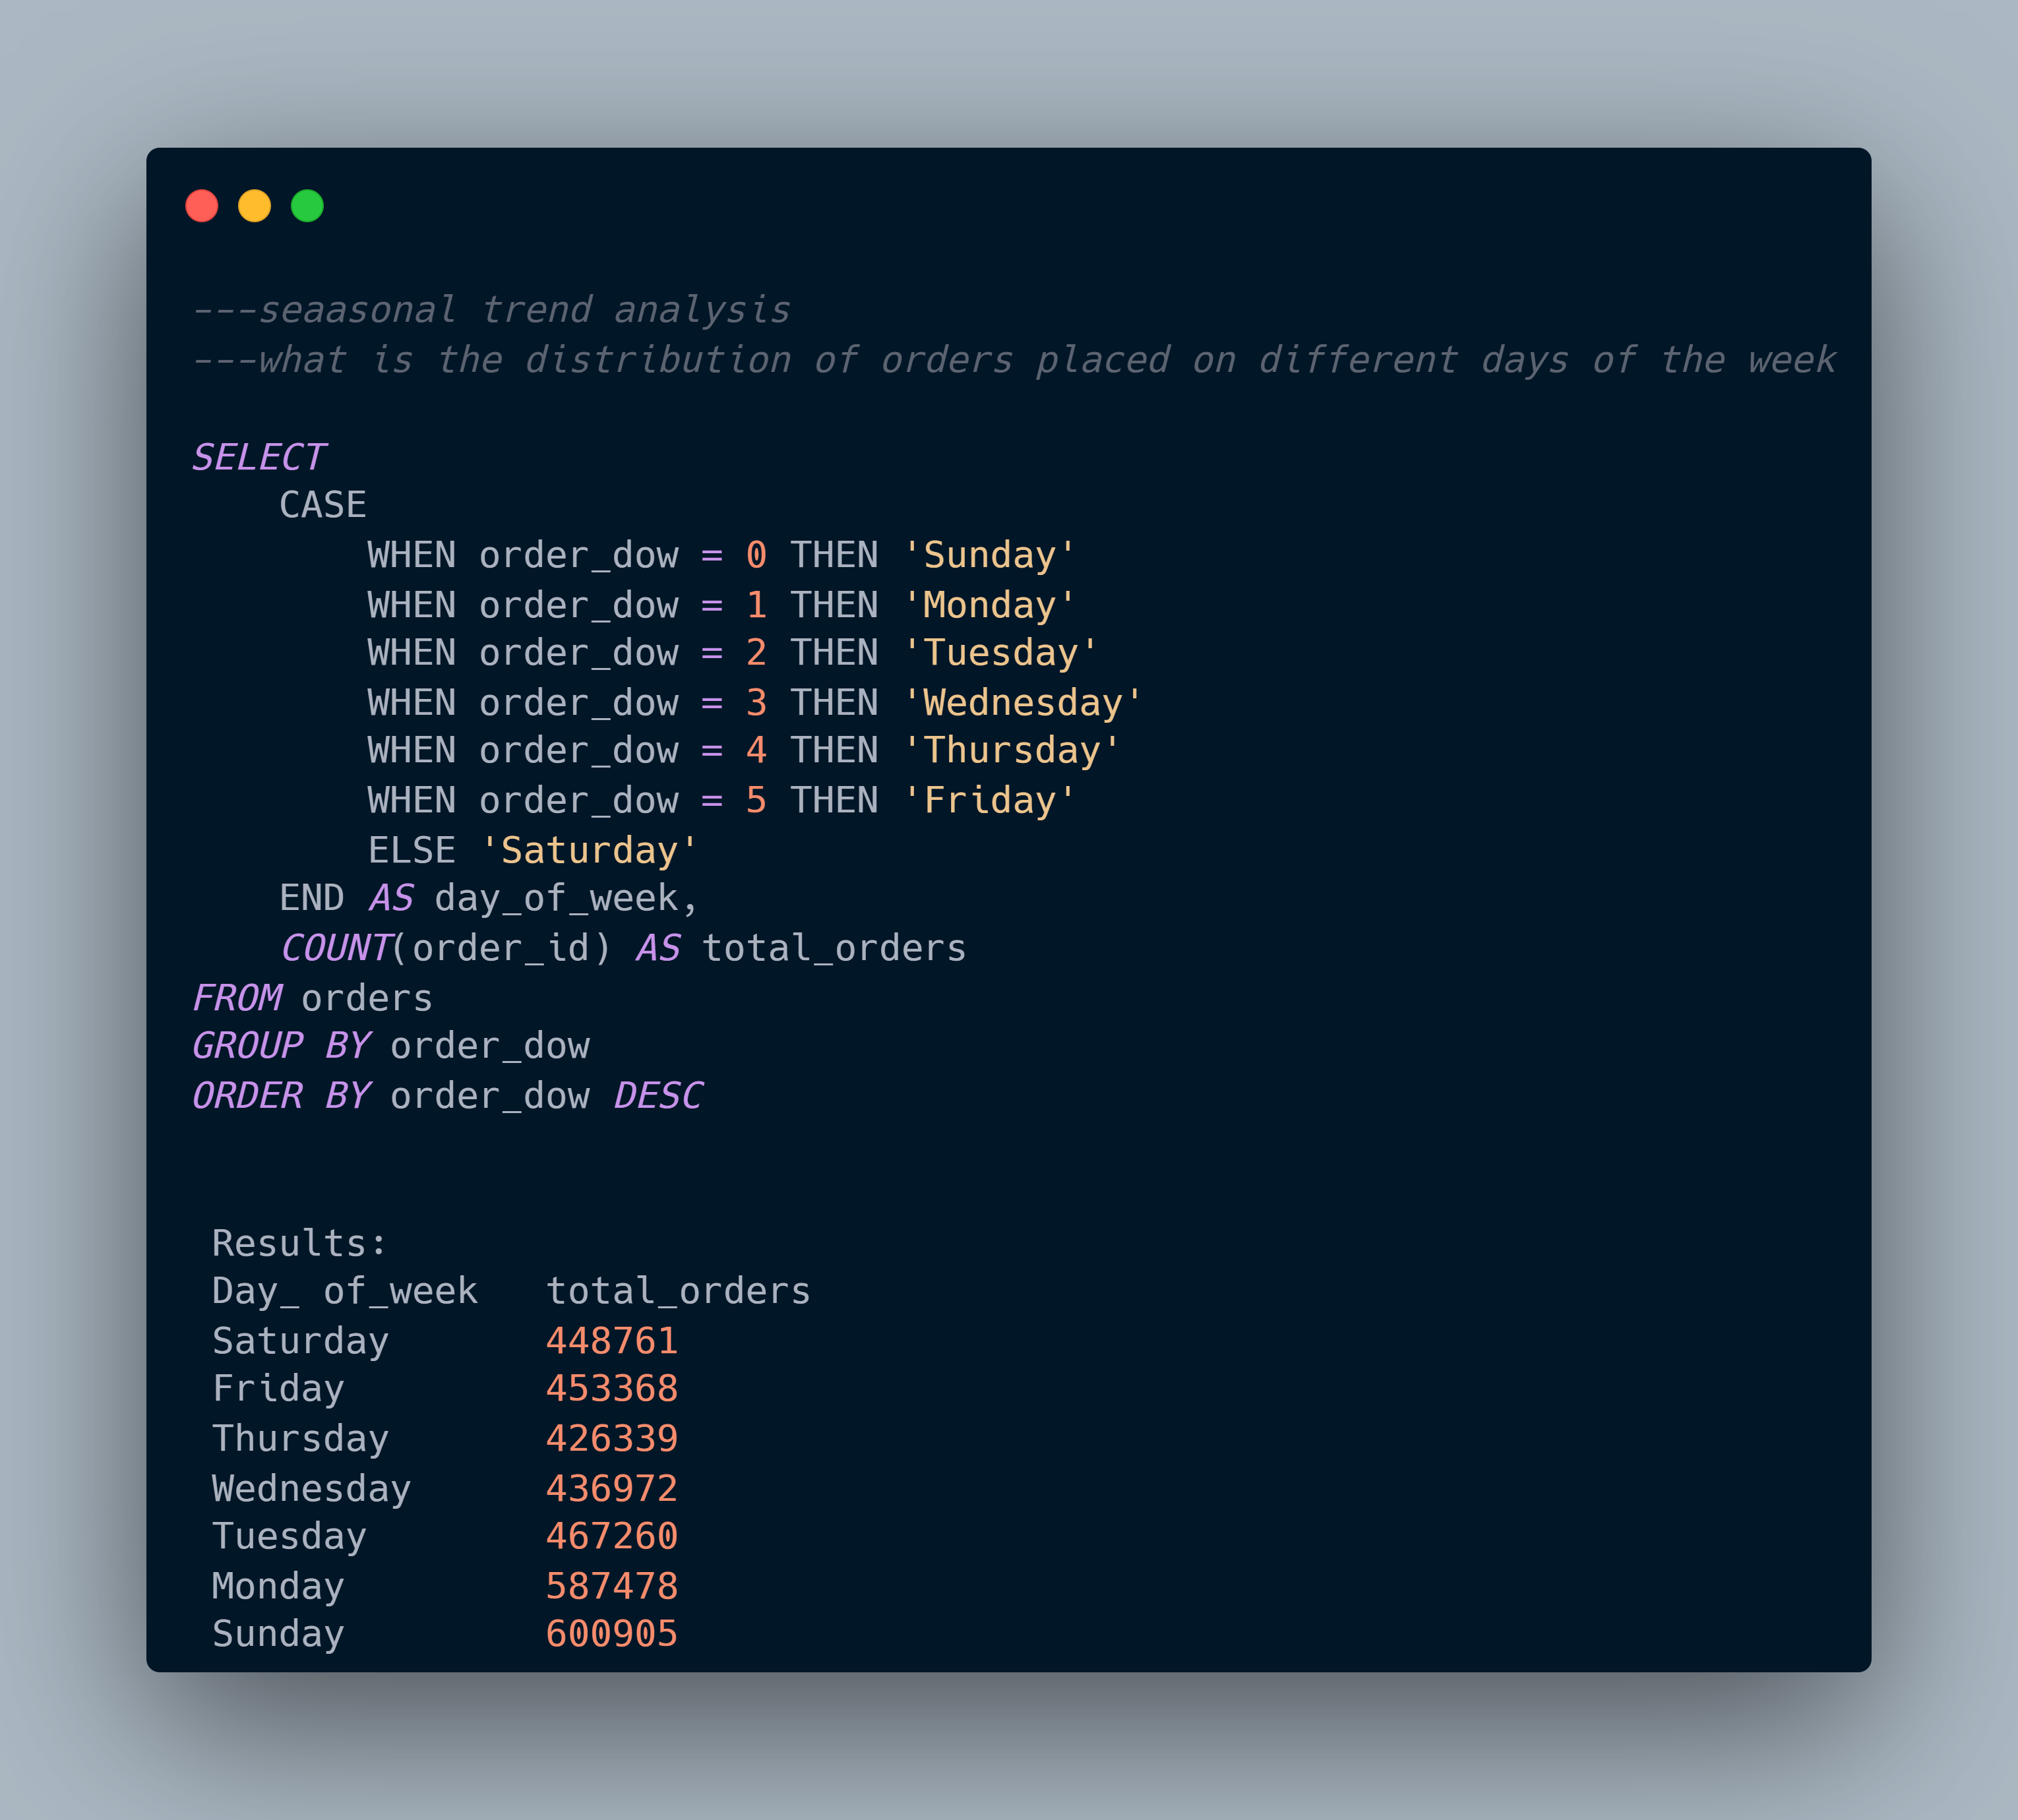
What is the distribution of orders placed on different days of the week?
Query:
Customer Churn Prediction:
Analysis: Predict which customers are most likely to stop using the service in the near future.
Questions:
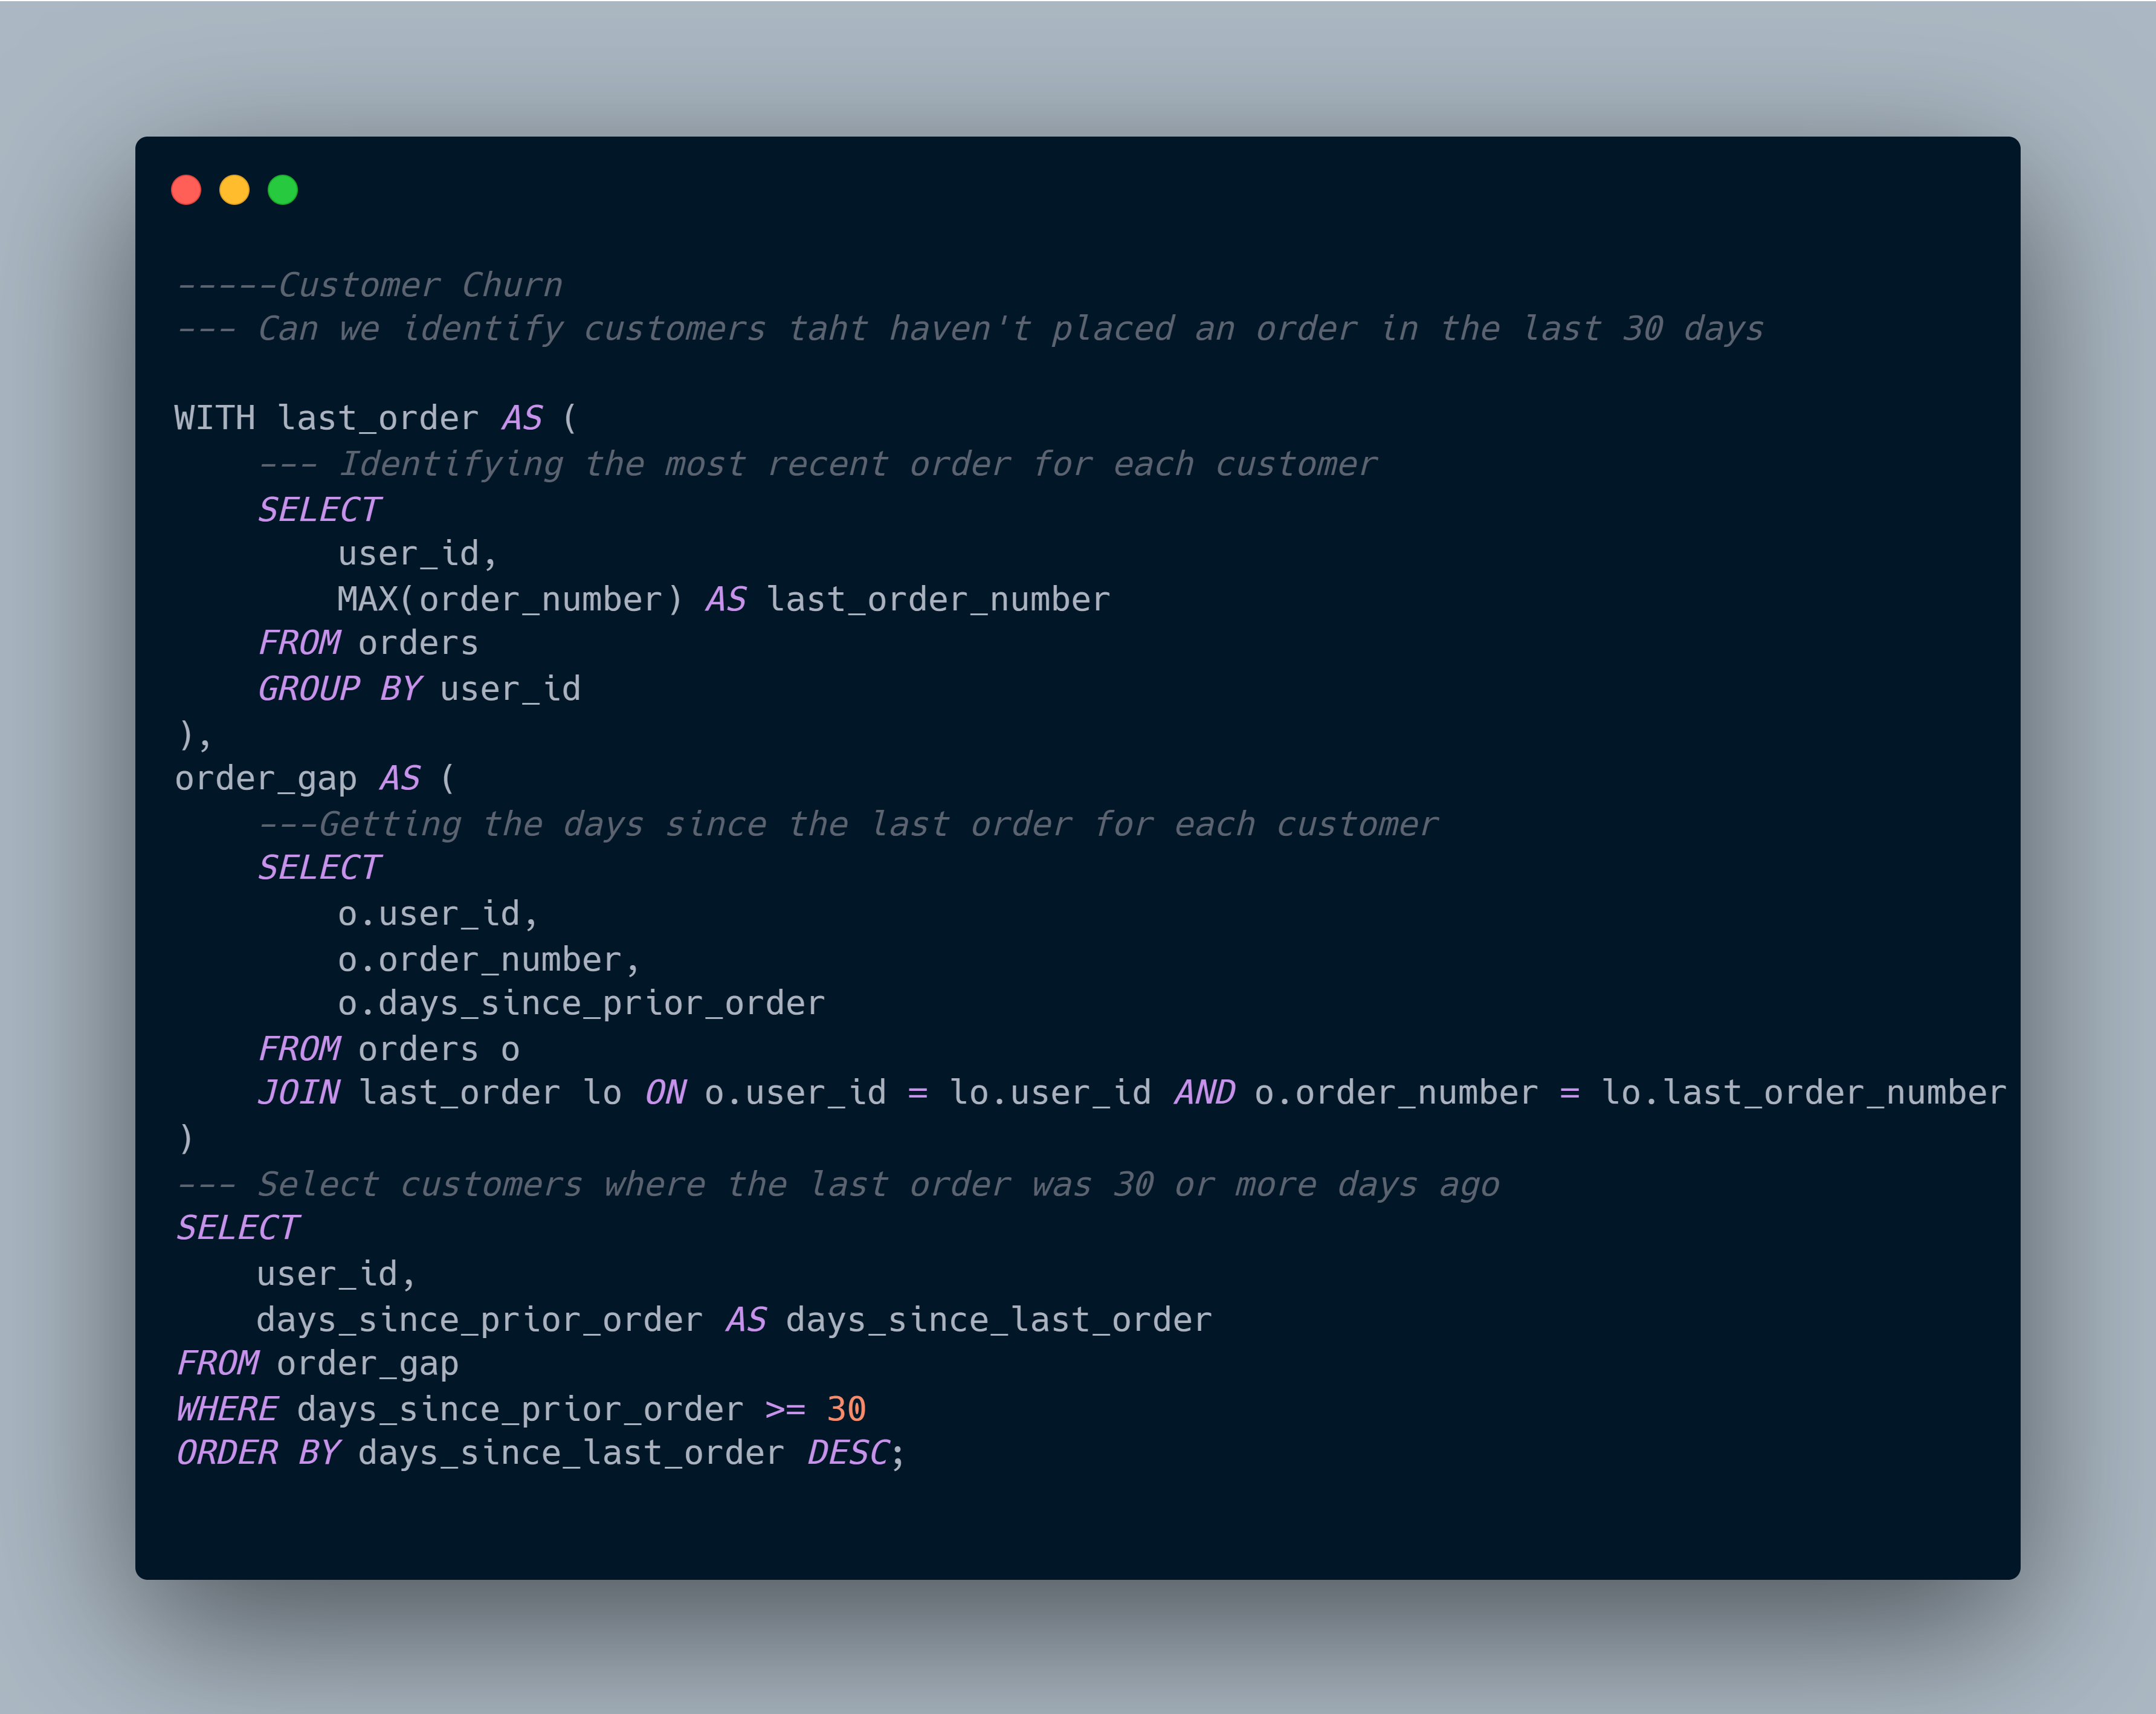
Can we identify customers who haven't placed an order in the last 30 days?
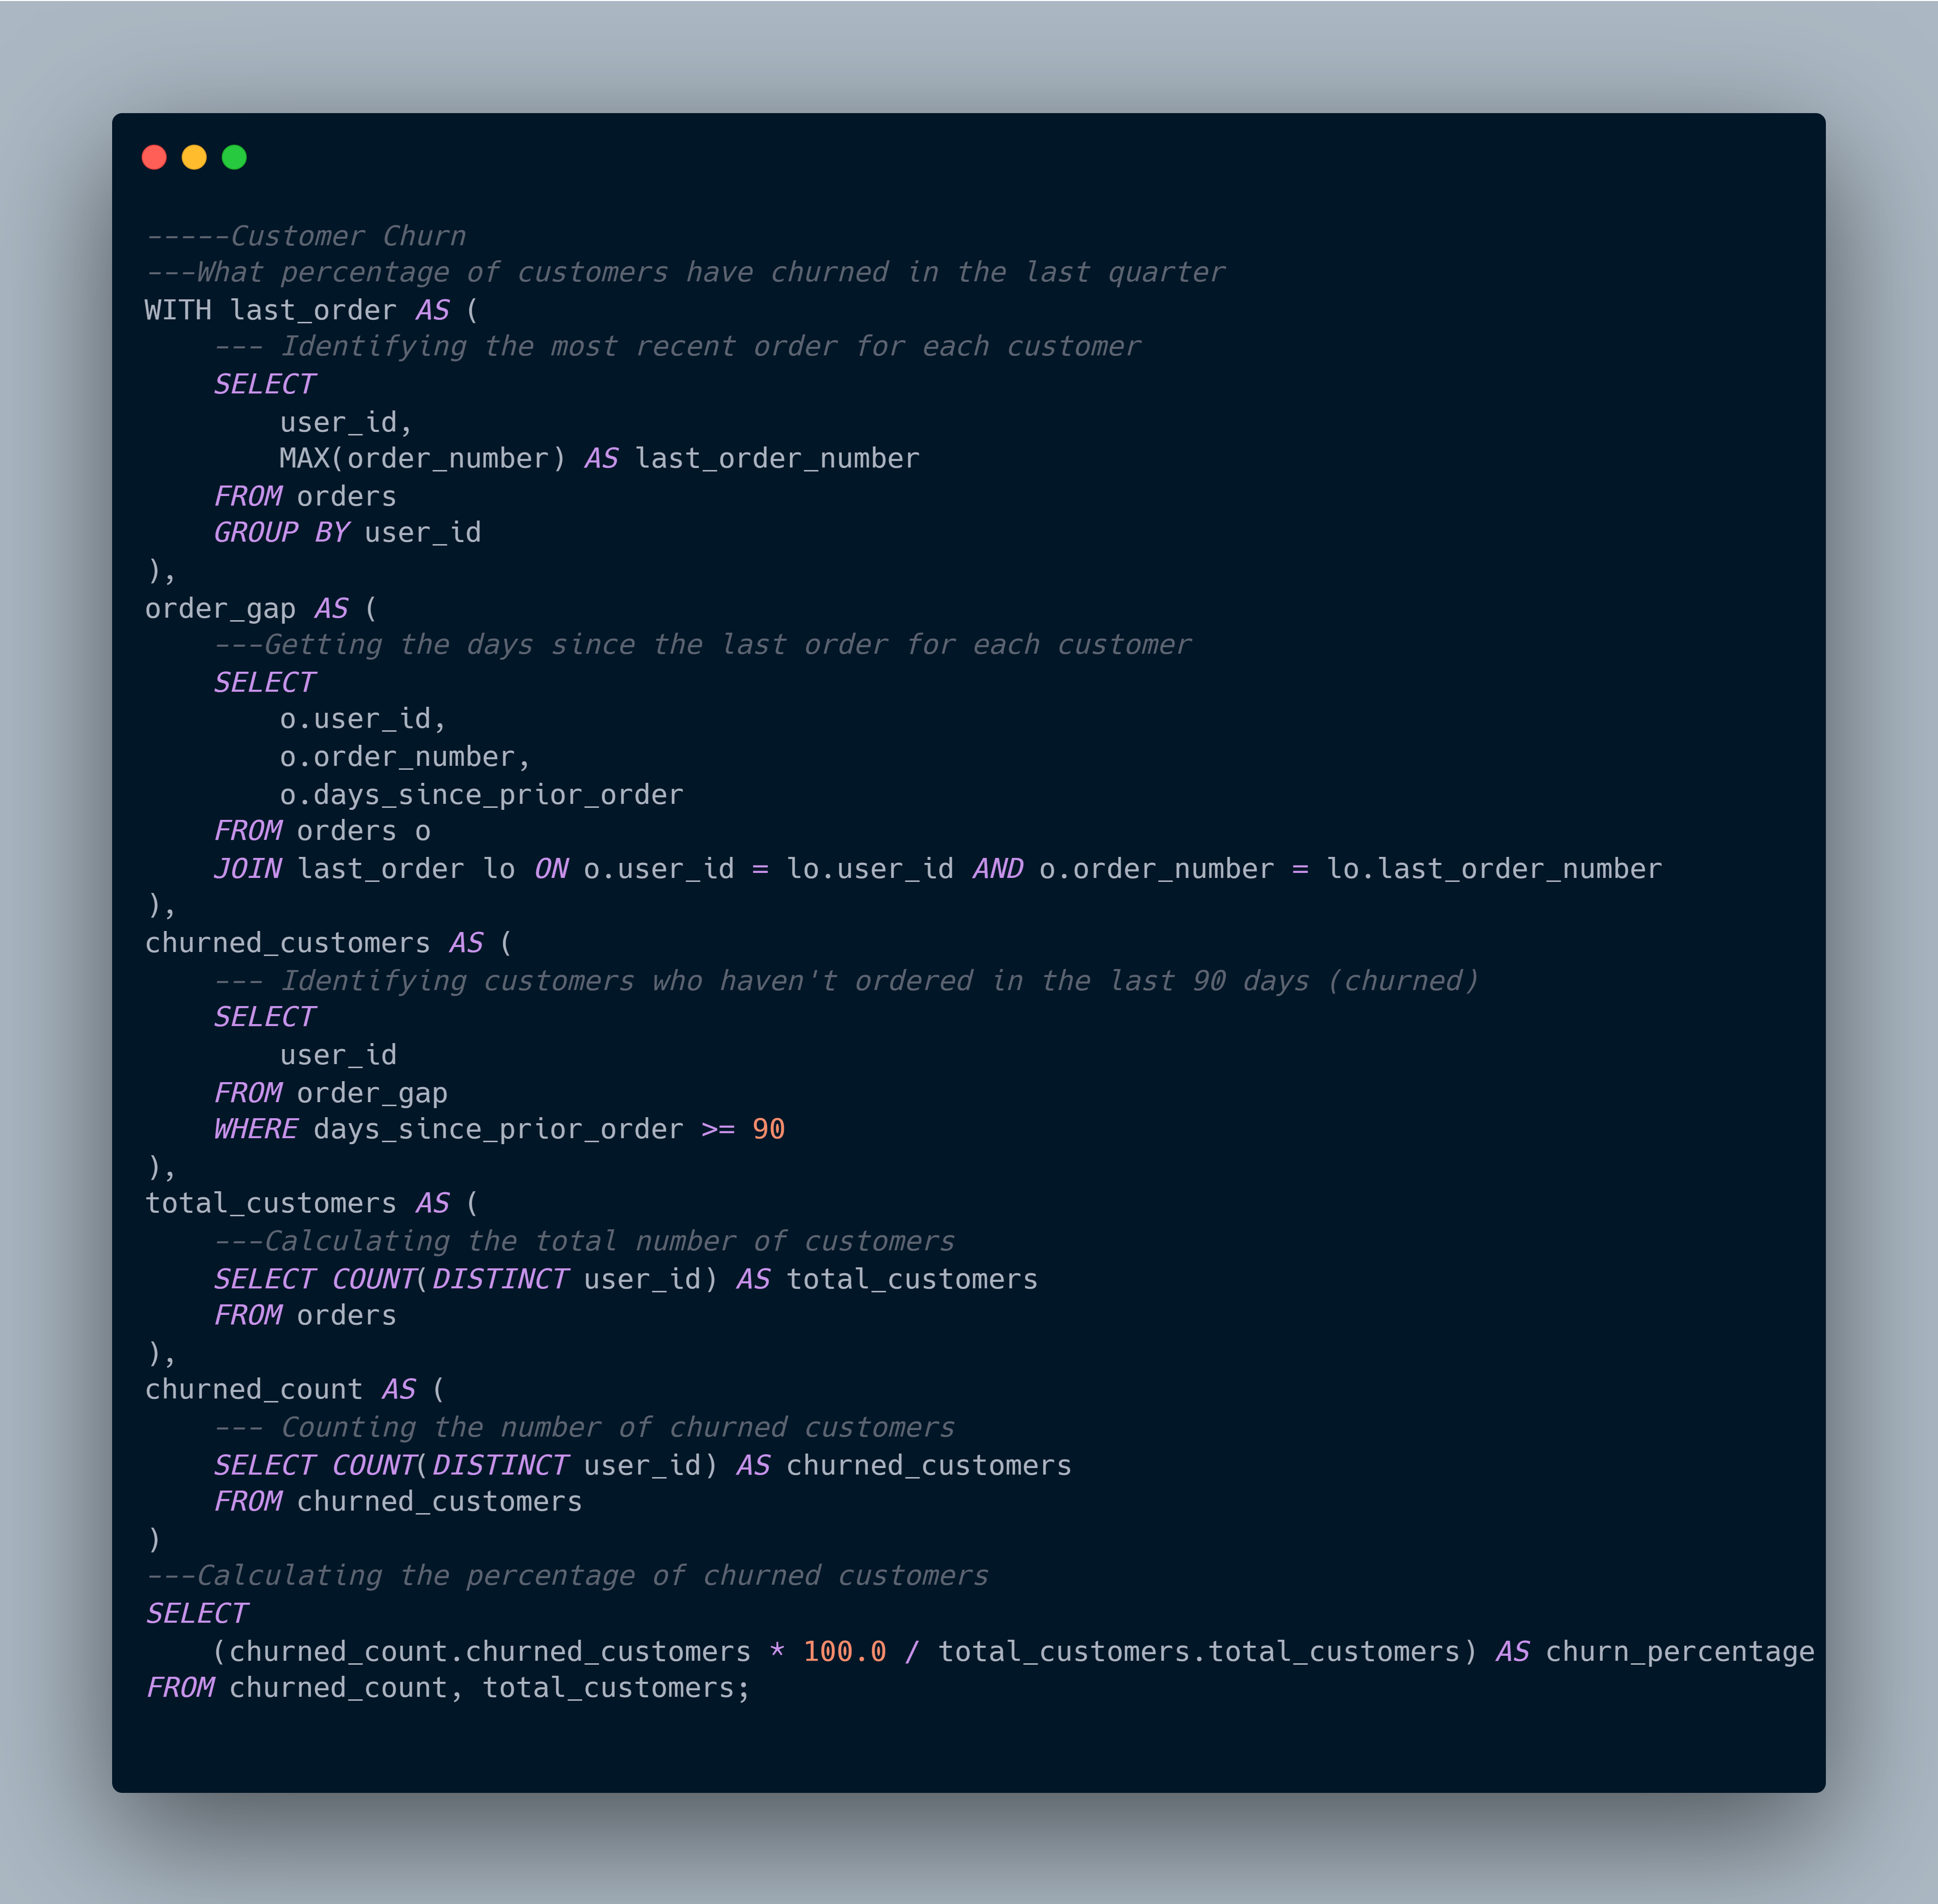
What percentage of customers have churned in the past quarter?
Query:
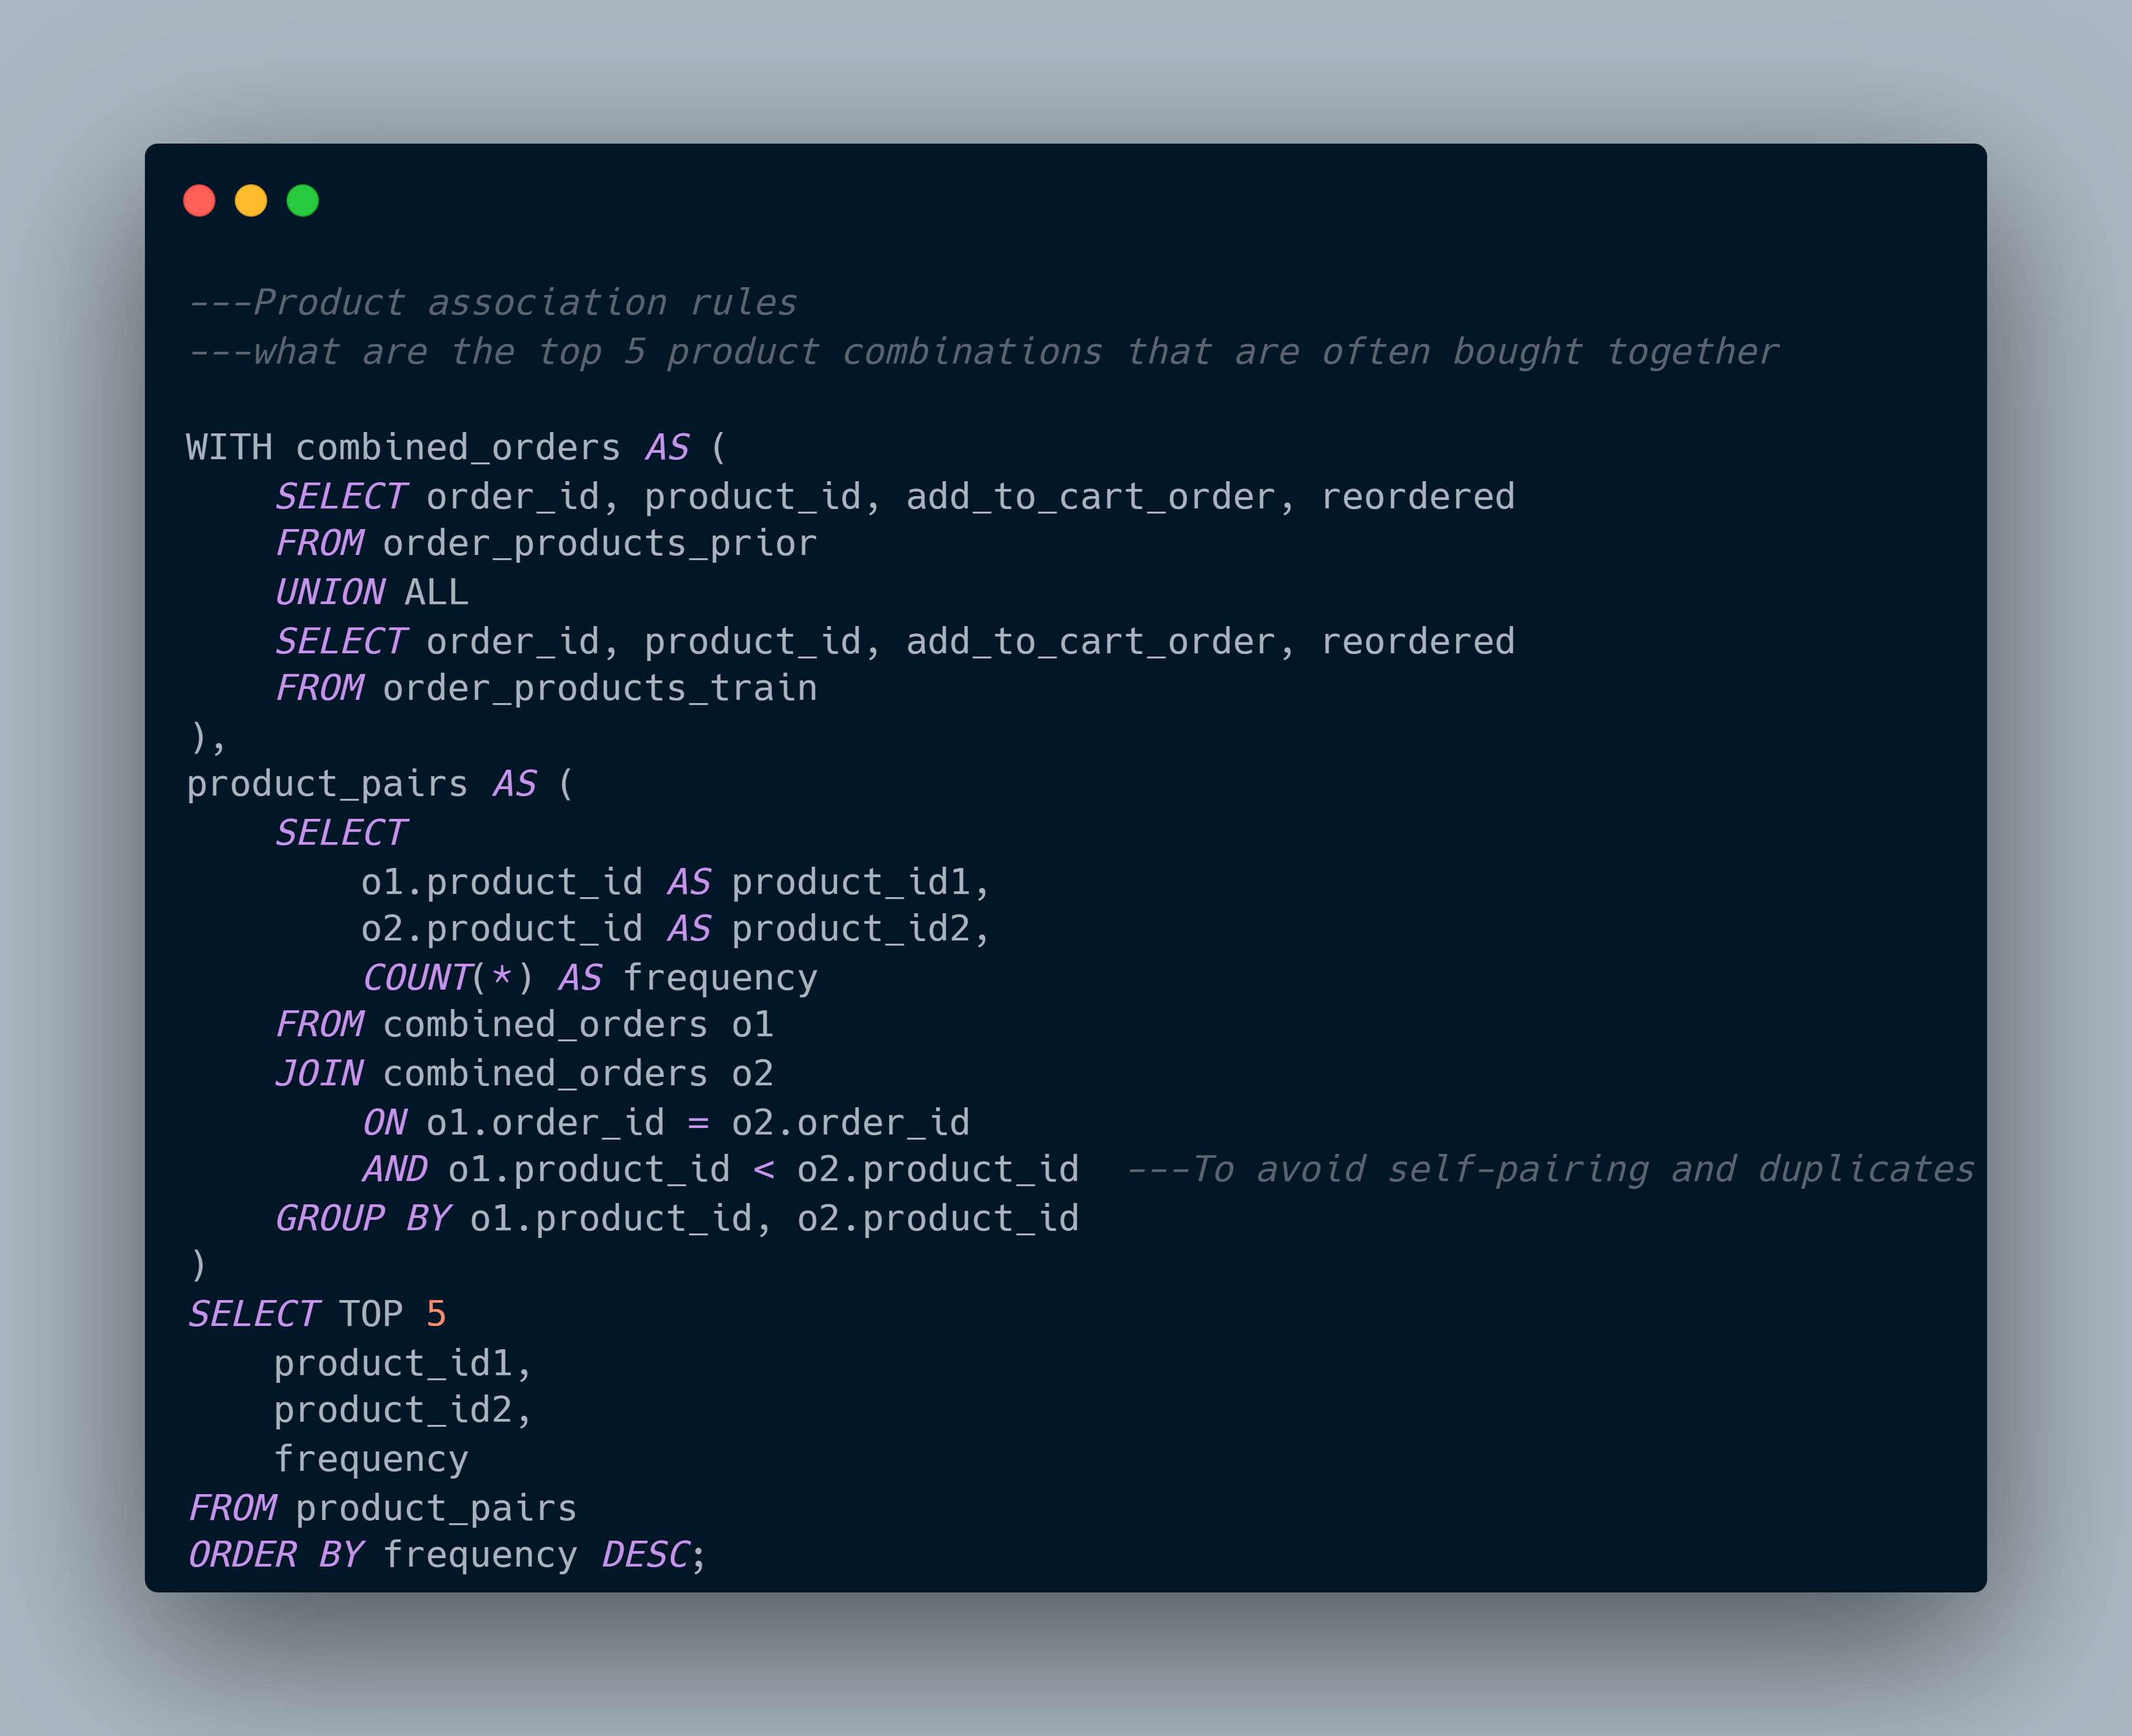
- Product Association Rules:
Analysis: Identify rules or patterns in customer behavior indicating which products are frequently bought together.
Questions:
- What are the top 5 product combinations that are most frequently purchased together?
Can we find products that are often bought together on weekends vs. weekdays?
Queries:
Dashboard
Link to Dashboard: https://drive.google.com/file/d/1Bb550CaBvY-R5HMsOUk3HNIpV4S_0j2d/view?usp=sharing
Conclusion
The Instacart Market Basket Analysis reveals key insights into customer shopping behavior, popular product categories, and peak sales patterns. The Produce and Dairy & Eggs departments emerged as top performers, reflecting strong consumer demand for fresh and essential products. The preference for organic items further emphasizes a growing trend toward health-conscious purchasing, which presents opportunities for Instacart to cater to this demand through targeted marketing and promotions. Additionally, Sundays and Mondays see a significant spike in orders, suggesting these are peak shopping days. By optimizing stock levels, delivery slots, and operational capacity on these days, Instacart can enhance the customer experience, ensuring smooth and timely service. Overall, this analysis provides actionable insights to help Instacart refine its strategies and drive further growth in customer engagement and satisfaction.
Subscribe to my newsletter
Read articles from Precious Hezekiah directly inside your inbox. Subscribe to the newsletter, and don't miss out.
Written by

Precious Hezekiah
Precious Hezekiah
I'm a Google certified data analyst