Optimizing Costs for Cloud Architectures with Kubernetes Workloads
 Subhanshu Mohan Gupta
In this III part of my Kubernetes series, we will dive deep into Cost Estimation for Cloud Architectures, focusing on practical strategies for managing the cost of running Kubernetes workloads in cloud environments like AWS, GCP, and Azure.
Managing cloud costs for Kubernetes workloads can be complex and unpredictable, given the dynamic nature of cloud-native applications. As organizations scale their Kubernetes clusters across multi-cloud platforms, cost optimization becomes a critical challenge. In this article, we will explore how to calculate and optimize costs for running Kubernetes in various cloud environments by using cost-monitoring tools like Kubecost and Prometheus. We'll also discuss strategies such as autoscaling, right-sizing workloads, and managing resource utilization to minimize cloud expenses. Finally, we’ll walk you through a real-world implementation using AWS (EKS) as an example, with a step-by-step guide and architecture diagram to show how to achieve cost efficiency.
Why Optimizing Kubernetes Costs is Important?
Cloud environments are billed on a pay-as-you-go model, where costs can quickly rise if resources are over-provisioned or mismanaged. Kubernetes clusters are no different — poor resource allocation, underutilized nodes, and lack of cost visibility can result in unexpected cloud bills. By leveraging cost optimization strategies, you not only reduce unnecessary spending but also ensure that your infrastructure scales efficiently and remains aligned with business goals.
Understanding the Challenge of Cost Management in Kubernetes: Kubernetes workloads are inherently dynamic. Pods are spun up and down based on demand, and cloud infrastructure bills fluctuate with usage. Without proper cost monitoring, organizations often face unexpected cloud bills or underutilized resources, resulting in wasted expenditure. This section addresses the core challenges organizations face when managing Kubernetes costs in different cloud environments, offering real-world solutions to overcome them.
Key Tools for Kubernetes Cost Estimation
To optimize Kubernetes costs, the following tools and strategies are essential:
Kubecost: This tool provides granular visibility into Kubernetes costs. It allows users to track costs by namespace, pod, and service, giving precise insights into cloud expenditure.
Prometheus: A monitoring solution that tracks CPU, memory, and resource utilization across Kubernetes clusters. Combined with Grafana, it can be used to visualize and analyze resource usage in real-time.
Horizontal Pod Autoscaler (HPA): Dynamically adjusts the number of pods in a deployment based on resource utilization like CPU and memory.
Cluster Autoscaler: Automatically adds or removes nodes from the cluster when workloads increase or decrease, ensuring optimal resource allocation without over-provisioning.
Cost Optimization Strategies
Autoscaling: Kubernetes has built-in autoscaling mechanisms like HPA and Cluster Autoscaler, which ensure your workloads scale up or down based on actual resource requirements. This prevents over-provisioning, leading to more efficient cost management.
Right-Sizing Resources: Many workloads are allocated more resources than they actually need. Using tools like Kubecost, you can right-size your workloads by adjusting CPU and memory limits according to actual utilization.
Monitoring Resource Usage: Tools like Prometheus allow you to monitor your resource usage across nodes and clusters, making it easier to optimize utilization and prevent idle resources from accumulating costs.
Real-World Example: Managing Kubernetes Costs in AWS (EKS)
Imagine you’re running a Kubernetes cluster in AWS Elastic Kubernetes Service (EKS), and over time, your cloud bills have been steadily increasing. A closer look reveals that some pods are over-provisioned, using more CPU and memory than needed, and your nodes are not scaling down during periods of low traffic. Without visibility into resource usage and costs, optimizing the cloud spend becomes difficult.
In this scenario, implementing cost monitoring with Kubecost, Prometheus, and enabling autoscaling strategies will significantly help. Here's how you can implement this architecture to optimize Kubernetes costs and improve resource efficiency.
Architecture Diagram
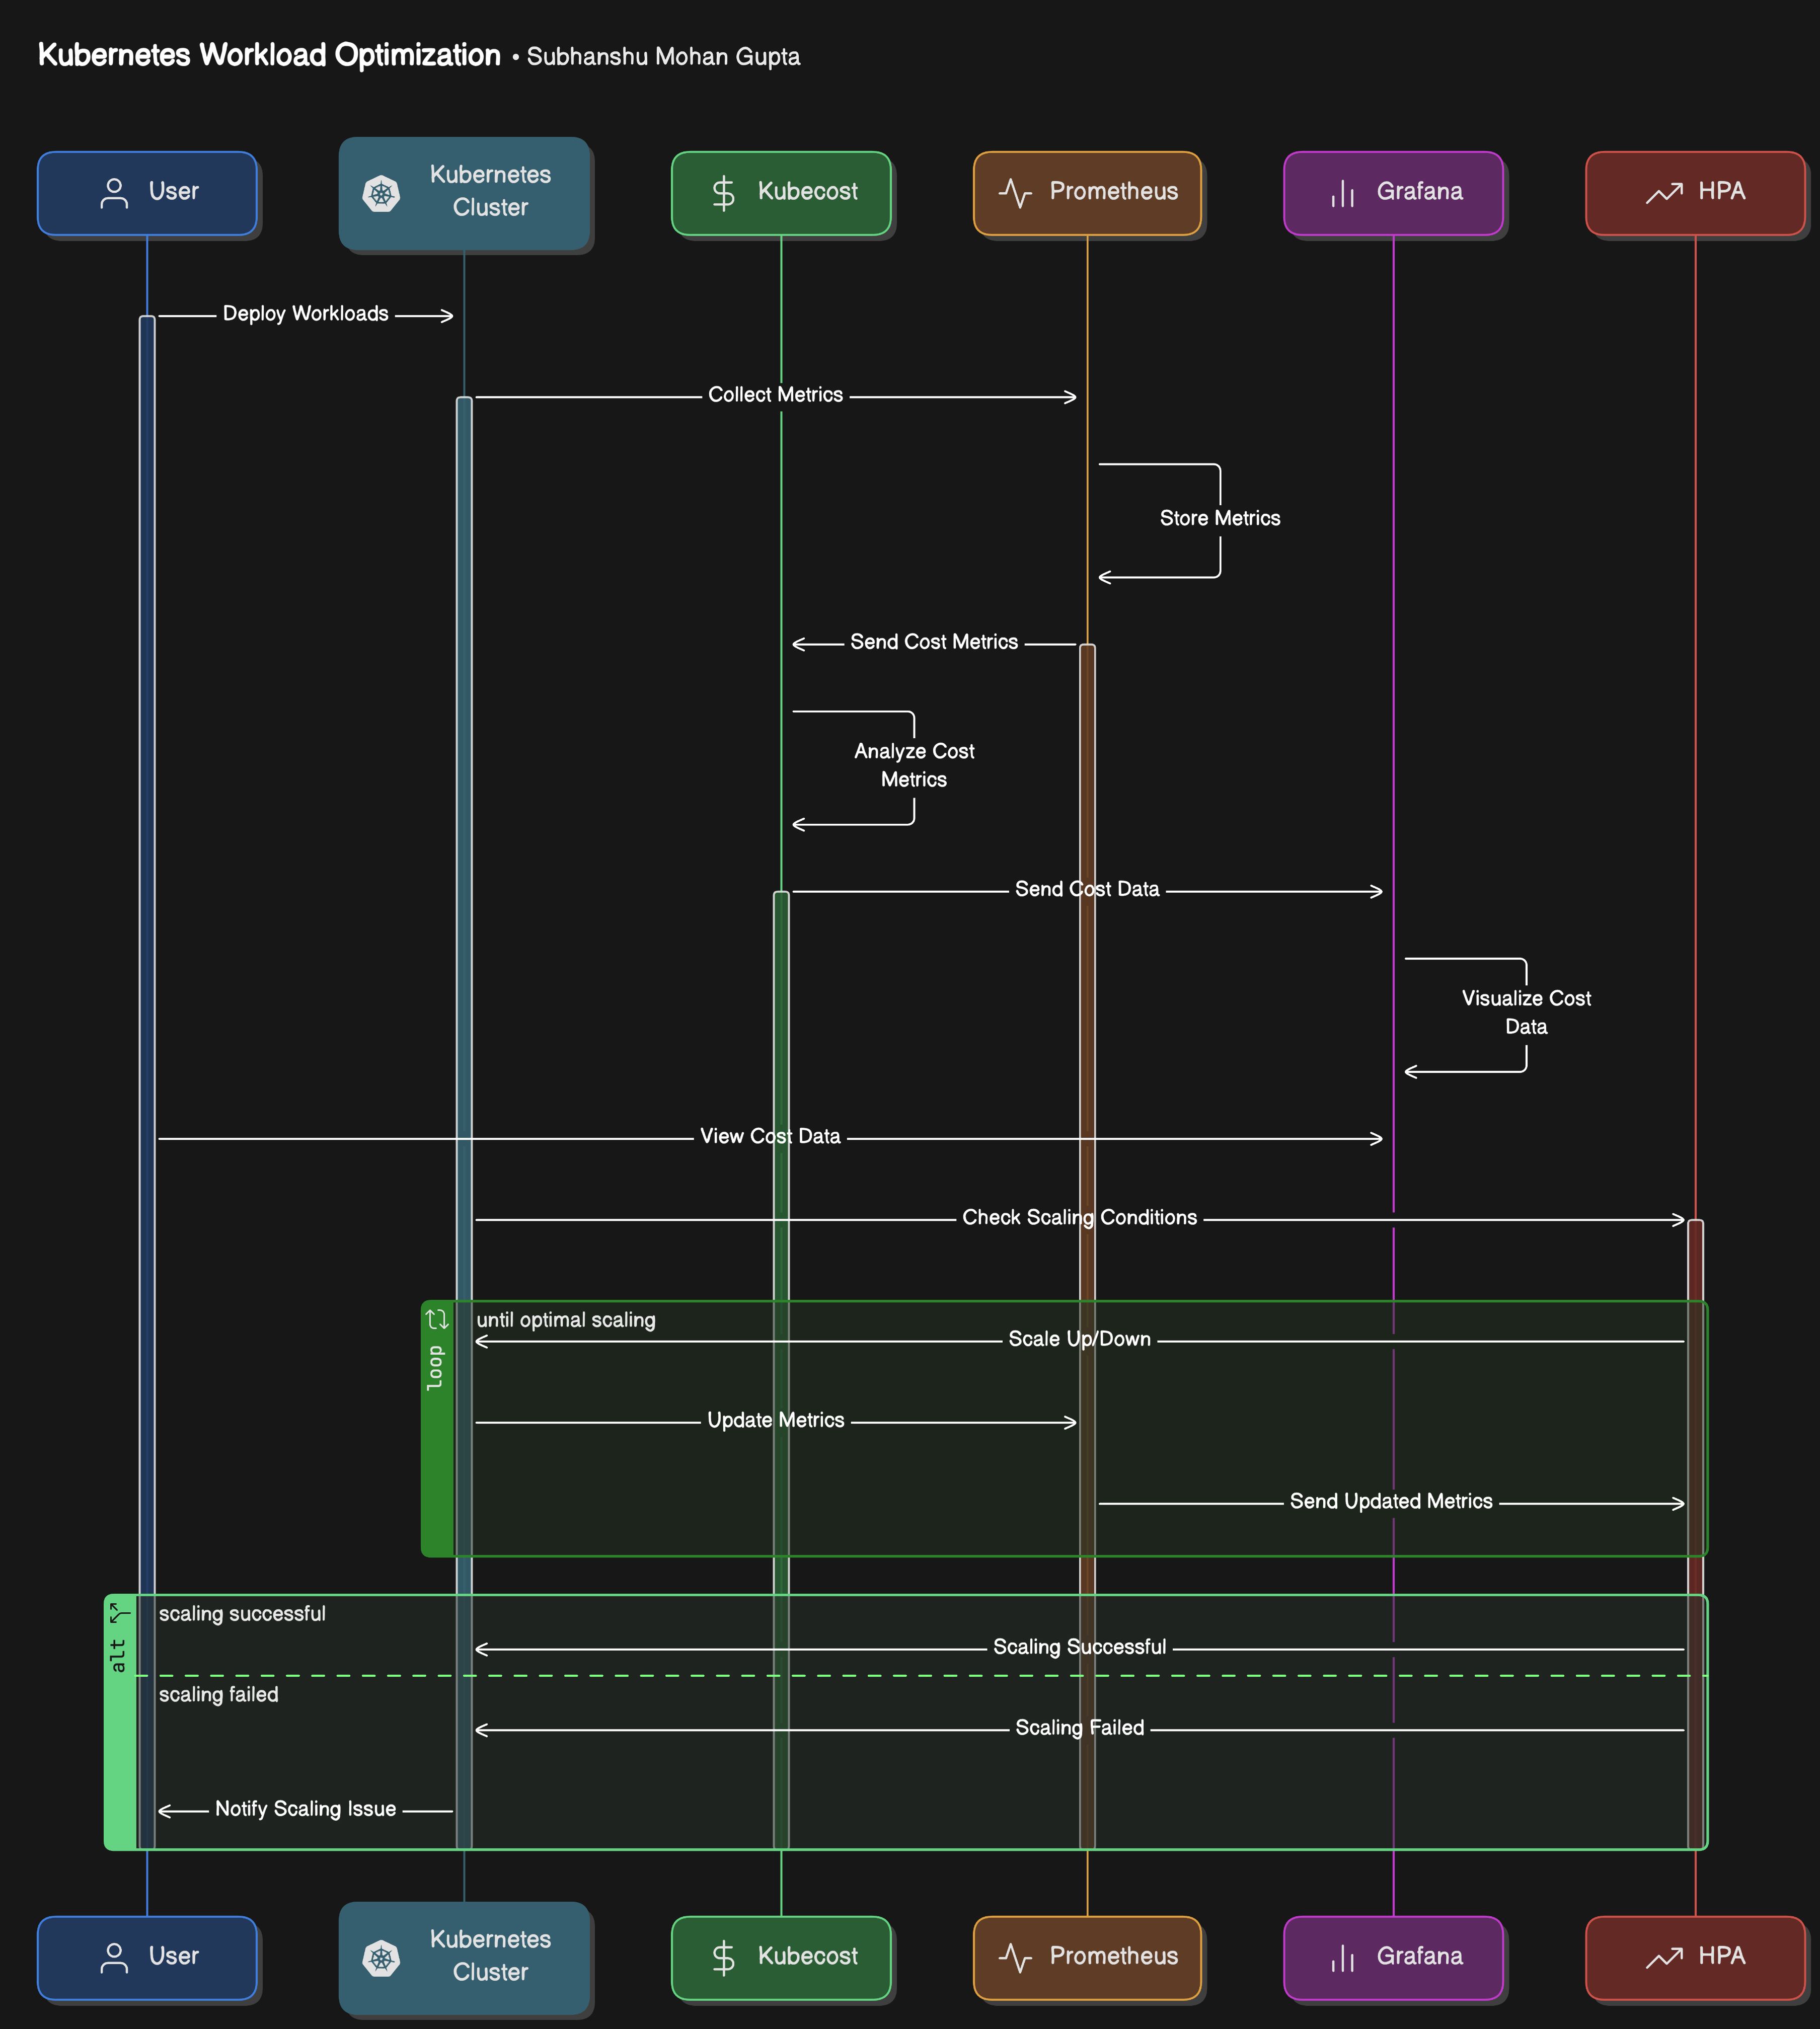
Below is an architecture diagram that outlines the integration of Kubecost, Prometheus, Grafana, and autoscaling techniques for optimizing Kubernetes workloads.

Actors & Components Involved
User: Deploys workloads onto the Kubernetes cluster.
Kubernetes Cluster: Manages workloads and integrates with monitoring and cost-analysis tools.
Kubecost: Responsible for cost estimation and optimization.
Prometheus: Collects and stores resource metrics (CPU, memory, etc.).
Grafana: Visualizes cost and resource data using dashboards.
HPA (Horizontal Pod Autoscaler): Automatically adjusts the number of pods based on resource usage.
Step-by-Step Breakdown
Deploy Workloads (User → Kubernetes Cluster):
- The user initiates the process by deploying workloads (applications, services, etc.) into the Kubernetes cluster.
Collect Metrics (Kubernetes Cluster → Prometheus & Kubecost):
Once the workloads are running, the Kubernetes cluster starts collecting metrics about resource usage (CPU, memory, etc.).
These metrics are sent to Prometheus for monitoring and Kubecost for cost analysis.
Store Metrics (Prometheus):
- Prometheus stores the collected resource metrics in its database for later analysis and decision-making.
Send Cost Metrics (Kubecost → Prometheus):
Kubecost analyzes the collected metrics to compute the cost associated with running the workloads (resource consumption, overhead costs, etc.).
These cost metrics are sent to Prometheus to be stored alongside resource metrics.
Visualize Cost Data (Prometheus → Grafana):
The stored cost and resource data are retrieved by Grafana, which generates visualizations and dashboards.
The user can now view detailed cost reports and real-time resource usage through Grafana’s UI.
Check Scaling Conditions (HPA → Prometheus):
- Horizontal Pod Autoscaler (HPA) queries Prometheus for resource metrics to evaluate whether scaling (up or down) is needed based on the current load (CPU/memory thresholds).
Scale Up/Down (HPA → Kubernetes Cluster):
- Based on the collected metrics, the HPA decides whether to scale up or down the number of pods to optimize resource usage.
Update Metrics (Kubernetes Cluster → Prometheus):
After the scaling decision is executed, the Kubernetes cluster updates its resource metrics to reflect the new state (e.g., after adding/removing pods).
These updated metrics are sent to Prometheus for continuous monitoring.
Notify Scaling Status (HPA → User):
- The HPA communicates the result of the scaling operation (successful or failed) back to the user, ensuring visibility into the system's status.
Implementing Kubernetes Cost Optimization in AWS (EKS)
Pre-requisites -
A Kubernetes cluster running on AWS (EKS). You can use GKE (Google Kubernetes Engine) or AKS (Azure Kubernetes Service) for other cloud providers.
kubectlandhelminstalled.Basic knowledge of Kubernetes and YAML files.
1. Set Up Prometheus for Monitoring
Prometheus is a widely used tool for monitoring resource utilization in Kubernetes. You can deploy Prometheus using Helm, which simplifies the installation process.
Install Prometheus using Helm:
Add the Helm repository and install Prometheus with default values:
 helm repo add prometheus-community https://prometheus-community.github.io/helm-charts
 helm repo update
 helm install prometheus prometheus-community/prometheus --namespace monitoring --create-namespace
This command installs Prometheus in the
monitoringnamespace.Access Prometheus:
Once Prometheus is running, you can access it using port-forwarding:
kubectl port-forward -n monitoring svc/prometheus-server 9090:80Navigate to
http://localhost:9090in your browser.
2. Set Up Grafana for Visualization
Grafana works seamlessly with Prometheus to visualize metrics and trends for better analysis.
Install Grafana using Helm:
helm install grafana grafana/grafana --namespace monitoringYou can also set a persistent volume to store data across restarts.
Access Grafana:
Get the Grafana admin password and port-forward to access the UI:
 kubectl get secret --namespace monitoring grafana -o jsonpath="{.data.admin-password}" | base64 --decode ; echo
 kubectl port-forward -n monitoring svc/grafana 3000:80
Go to
http://localhost:3000and log in with the usernameadminand the password from the above command.Add Prometheus as a Data Source in Grafana:
Log in to Grafana → Configuration → Data Sources → Add data source → Select Prometheus.
Set the URL to
http://prometheus-server.monitoring.svc.cluster.local:80and click Save & Test.
3. Install Kubecost for Cost Monitoring
Kubecost helps in monitoring and breaking down costs for Kubernetes workloads. It tracks costs by namespaces, services, and pods.
Install Kubecost using Helm:
Add the Kubecost Helm repository and install it:
 helm repo add kubecost https://kubecost.github.io/cost-analyzer/
 helm install kubecost kubecost/cost-analyzer --namespace kubecost --create-namespace
Access Kubecost UI:
Use port-forwarding to access Kubecost:
kubectl port-forward --namespace kubecost svc/kubecost-cost-analyzer 9090:9090Open
http://localhost:9090in your browser to see your Kubernetes cost breakdown.
4. Configure Horizontal Pod Autoscaling (HPA)
The Horizontal Pod Autoscaler (HPA) automatically adjusts the number of pods in a deployment based on CPU or memory usage.
Set CPU and Memory Requests/Limits for Your Deployment:
Define resource requests and limits in the deployment YAML:
 apiVersion: apps/v1
 kind: Deployment
 metadata:
   name: my-app
 spec:
   replicas: 1
   template:
     metadata:
       labels:
         app: my-app
     spec:
       containers:
       - name: my-container
         image: my-app:latest
         resources:
           requests:
             memory: "128Mi"
             cpu: "250m"
           limits:
             memory: "256Mi"
             cpu: "500m"
Enable HPA Based on CPU:
Create an HPA that scales the number of pods based on CPU utilization:
kubectl autoscale deployment my-app --cpu-percent=50 --min=1 --max=10This command will scale the
my-appdeployment between 1 and 10 replicas based on CPU usage. The target is set at 50% CPU utilization.Monitor Autoscaling:
You can view the HPA status with:
kubectl get hpa
5. Set Up Cluster Autoscaler for Nodes
The Cluster Autoscaler adjusts the number of nodes in your cluster based on resource demands.
Install the Cluster Autoscaler:
For AWS, use the following YAML configuration (replace
<cluster-name>with your EKS cluster name):apiVersion: apps/v1 kind: Deployment metadata: name: cluster-autoscaler namespace: kube-system spec: replicas: 1 selector: matchLabels: app: cluster-autoscaler template: metadata: labels: app: cluster-autoscaler spec: containers: - image: k8s.gcr.io/autoscaling/cluster-autoscaler:v1.21.0 name: cluster-autoscaler command: - ./cluster-autoscaler - --v=4 - --stderrthreshold=info - --cloud-provider=aws - --skip-nodes-with-local-storage=false - --expander=least-waste - --nodes=1:10:<nodegroup-name> env: - name: AWS_REGION value: us-west-2 terminationGracePeriodSeconds: 60Apply this configuration:
kubectl apply -f cluster-autoscaler.yamlConfigure Autoscaler Permissions (IAM roles):
Ensure that your worker nodes have IAM permissions for scaling. Attach the following policy to the worker node IAM role:
 {
   "Version": "2012-10-17",
   "Statement": [
     {
       "Effect": "Allow",
       "Action": [
         "autoscaling:DescribeAutoScalingGroups",
         "autoscaling:DescribeAutoScalingInstances",
         "autoscaling:DescribeTags",
         "autoscaling:SetDesiredCapacity",
         "autoscaling:TerminateInstanceInAutoScalingGroup"
       ],
       "Resource": "*"
     }
   ]
 }
6. Test and Monitor the Setup
Run Load Tests: Use a load-testing tool like k6 to generate traffic and observe how the HPA and Cluster Autoscaler scale the pods and nodes.
Example
k6test script:import http from 'k6/http'; import { sleep } from 'k6'; export default function () { http.get('http://my-app.example.com'); sleep(1); }Run the test with:
k6 run test.jsMonitor Costs and Scaling:
In Kubecost, track the cost reduction after autoscaling.
Use Grafana dashboards to monitor resource utilization, scaling behavior, and trends.
Conclusion
Optimizing cloud costs for Kubernetes workloads is critical for any organization operating in AWS, GCP, or Azure. By implementing cost-monitoring tools like Kubecost and Prometheus, setting up Grafana for visualization, and enabling autoscaling with HPA and Cluster Autoscaler, you can ensure that your infrastructure scales efficiently while keeping cloud expenses in check. This article we covered illustrates how you can put these best practices into action, starting with cost monitoring and ending with fully automated scaling strategies to match your workloads dynamically.
With the right strategies in place, you can not only avoid unexpected cloud bills but also maintain a scalable and cost-effective Kubernetes environment.
What's Next?
Stay tuned for Part IV, where we’ll dive into Building Compliant Systems on Kubernetes. We will explore how to ensure your Kubernetes workloads meet the stringent compliance requirements of standards like PCI-DSS, POPI, GDPR, and HIPAA, and how you can build secure, compliant, and scalable systems while staying within regulatory boundaries.
Additional Resources
Feel free to subscribe to my newsletter and follow me on LinkedIn
Subscribe to my newsletter
Read articles from Subhanshu Mohan Gupta directly inside your inbox. Subscribe to the newsletter, and don't miss out.
Written by

Subhanshu Mohan Gupta
Subhanshu Mohan Gupta
A passionate AI DevOps Engineer specialized in creating secure, scalable, and efficient systems that bridge development and operations. My expertise lies in automating complex processes, integrating AI-driven solutions, and ensuring seamless, secure delivery pipelines. With a deep understanding of cloud infrastructure, CI/CD, and cybersecurity, I thrive on solving challenges at the intersection of innovation and security, driving continuous improvement in both technology and team dynamics.