How to Show Active Filters in Power BI Using DAX (One Method Among Many)
 Nalaka Wanniarachchi
Power BI reports often require users to apply various filters to explore the data in specific ways. But once those filters are applied, it’s helpful to show the active filters on the report, allowing users to understand exactly what data they’re seeing. This tutorial will guide you on how to display active filters dynamically using DAX.
Overview of the Power BI Setup
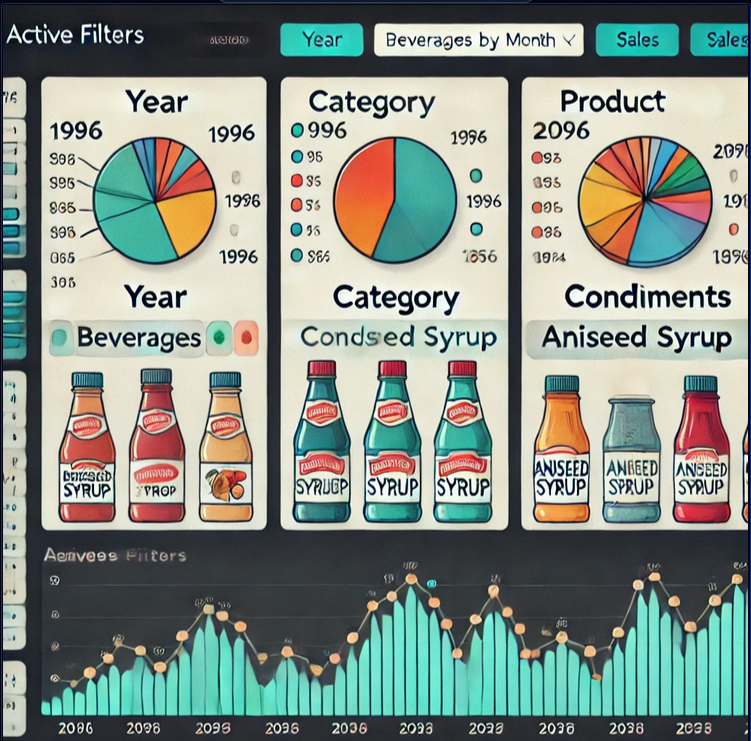
In this example, we are using a report with filters applied to Year, Category, and Product. Here’s a snapshot of the report layout:
Year: Filtered between 1996 and 1997.
Category: Filters include "Beverages" and "Condiments."
Product: "Aniseed Syrup" is selected.
Below the slicers, there’s a Sales by Month line chart that updates dynamically based on the filters applied. To enhance the user experience, we will show the applied filters in a text box beneath the chart.

Step-by-Step Guide to Display Active Filters
Step 1: Define Variables for Filtered Items
We start by defining variables in DAX for each filter, such as Year, Category, and Product. This will capture the values selected by the user in the report.
VAR _year = "Year (" & CONCATENATEX(VALUES('Calendar'[Year]), 'Calendar'[Year], ", ") & ")"
VAR _category = "Category (" & CONCATENATEX(VALUES(Categories[CategoryName]), Categories[CategoryName], ", ") & ")"
VAR _product = "Product (" & CONCATENATEX(VALUES(Products[ProductName]), Products[ProductName], ", ") & ")"
In the formula:
CONCATENATEXis used to concatenate the values for each filter type. For instance, if multiple categories or years are selected, they will appear in a comma-separated list.
The output might look something like this:
Year (1996, 1997)Category (Beverages, Condiments)Product (Aniseed Syrup)
Step 2: Check Which Filters Are Applied
Next, we need to determine if any filter has been applied for each category (Year, Category, Product). We use the ISFILTERED function to check this:
VAR _yearFiltered = ISFILTERED('Calendar'[Year])
VAR _categoryFiltered = ISFILTERED(Categories[CategoryName])
VAR _productFiltered = ISFILTERED(Products[ProductName])
This part of the DAX formula returns TRUE if the corresponding field is filtered and FALSE if it is not.
Step 3: Count the Selected Filters
To ensure proper handling of multiple selections, we count the number of items selected for each filter. This will help later when displaying active filters in the report.
VAR _totalFiltersSelected =
    IF(_yearFiltered, COUNTROWS(VALUES('Calendar'[Year]))) +
    IF(_categoryFiltered, COUNTROWS(VALUES(Categories[CategoryName]))) +
    IF(_productFiltered, COUNTROWS(VALUES(Products[ProductName])))
Step 4: Build the Filters Display String
We now construct a display string that shows the active filters. If no filters are applied, we will return “No selection.” Here’s how we do this in DAX:
VAR _filters = IF(_yearFiltered || _categoryFiltered || _productFiltered,
    IF(_yearFiltered, _year & " ") &
    IF(_categoryFiltered, _category & " ") &
    IF(_productFiltered, _product & " "),
    "No selection")
The IF statements check whether a filter is applied and, if true, concatenate the selected values into the final string.
Step 5: Limit the Number of Filters Displayed
If many filters are applied, the display can get cluttered. To avoid this, we set a maximum limit of 5 filters to be shown. If the number of filters exceeds this limit, we display a summary instead.
VAR _maxFilterDisplay = 5
VAR _filtersMaxDisplay = IF(_totalFiltersSelected <= _maxFilterDisplay, _filters, "Multiple selections (" & _totalFiltersSelected & " active filters)")
In this part, the formula limits the number of visible filters and replaces the details with a message such as "Multiple selections (5 active filters)" when necessary.
Step 6: Returning the Active Filters
Finally, we return the concatenated active filters in the format we want:
RETURN
    "Active filter(s): " & _filtersMaxDisplay
This string will appear in your Power BI report, showing which filters are currently applied in a user-friendly manner.
Full Code
Active Filters =
VAR _year = "Year (" & CONCATENATEX(VALUES('Calendar'[Year]), 'Calendar'[Year], ", ") & ")"
VAR _category = "Category (" & CONCATENATEX(VALUES(Categories[CategoryName]), Categories[CategoryName], ", ") & ")"
VAR _product = "Product (" & CONCATENATEX(VALUES(Products[ProductName]), Products[ProductName], ", ") & ")"

VAR _yearFiltered = ISFILTERED('Calendar'[Year])
VAR _categoryFiltered = ISFILTERED(Categories[CategoryName])
VAR _productFiltered = ISFILTERED(Products[ProductName])

VAR _maxFilterDisplay = 5
VAR _totalFiltersSelected =
    IF(_yearFiltered, COUNTROWS(VALUES('Calendar'[Year]))) +
    IF(_categoryFiltered, COUNTROWS(VALUES(Categories[CategoryName]))) +
    IF(_productFiltered, COUNTROWS(VALUES(Products[ProductName])))

VAR _filters = IF(
    _yearFiltered || _categoryFiltered || _productFiltered,
    IF(_yearFiltered, _year & " ") &
    IF(_categoryFiltered, _category & " ") &
    IF(_productFiltered, _product & " "),
    "No selection"
)

VAR _filtersMaxDisplay = IF(
    _totalFiltersSelected <= _maxFilterDisplay,
    _filters,
    "Multiple selections (" & _totalFiltersSelected & " active filters)"
)

RETURN
    "Active filter(s): " & _filtersMaxDisplay
Conclusion
Displaying active filters in Power BI using DAX enhances the user experience by providing clear visibility into the selected filters. It ensures transparency and context, making reports easier to interpret. Follow the steps outlined above to implement this feature in your reports and give users more control and understanding of the data they’re viewing.
By dynamically showing the filters applied, users can instantly see how their selections affect the visualizations, leading to better data exploration and insights.
Subscribe to my newsletter
Read articles from Nalaka Wanniarachchi directly inside your inbox. Subscribe to the newsletter, and don't miss out.
Written by

Nalaka Wanniarachchi
Nalaka Wanniarachchi
Nalaka Wanniarachchi is an accomplished data analytics and data engineering professional with over 20 years of working experience. As a CIMA(ACMA/CGMA) UK qualified ex-banker with strong analytical skills, he transitioned into building robust data solutions. Nalaka specializes in Microsoft Fabric and Power BI, delivering advanced analytics and engineering solutions. He holds a Microsoft certification as a Fabric Analytic Engineer and Power BI Professional, combining technical expertise with a deep understanding of financial and business analytics.