Step-by-Step Guide to Configuring Cribl and Grafana for Data Processing
 Metta Surendhar
Data is the pulse of any system, and effectively managing it can bring significant value to your business. In this blog, we'll guide you step-by-step through setting up Cribl Edge for data collection, Cribl Stream for processing, and Grafana for visualizing your metrics. Whether you're new to Cribl or looking for a refresher, this guide will have you up and running in no time.
Here’s what we'll cover:
Setting Up Cribl Agent for Data Collection
Configuring Cribl Edge to Send Data to Cribl Stream
Processing Data with Cribl Stream
Utilizing Data in Grafana
Let’s dive in!
Step 1: Setting Up Cribl Agent for Data Collection
Efficient data collection is the first step towards real-time system monitoring. Cribl Edge helps you capture system metrics and logs from multiple sources and send them to Cribl Stream for processing.
Follow these instructions to install and configure Cribl Edge on Linux and Windows systems.
1.1 Create an Account in Cribl Cloud
Before we begin, we need to set up an account in Cribl Cloud:
Sign-Up Process: Go to Cribl Cloud and create an account.
Login: After signing up, log into Cribl Cloud with your credentials. The Cribl Cloud will be your primary interface for managing Edge nodes and data pipelines.
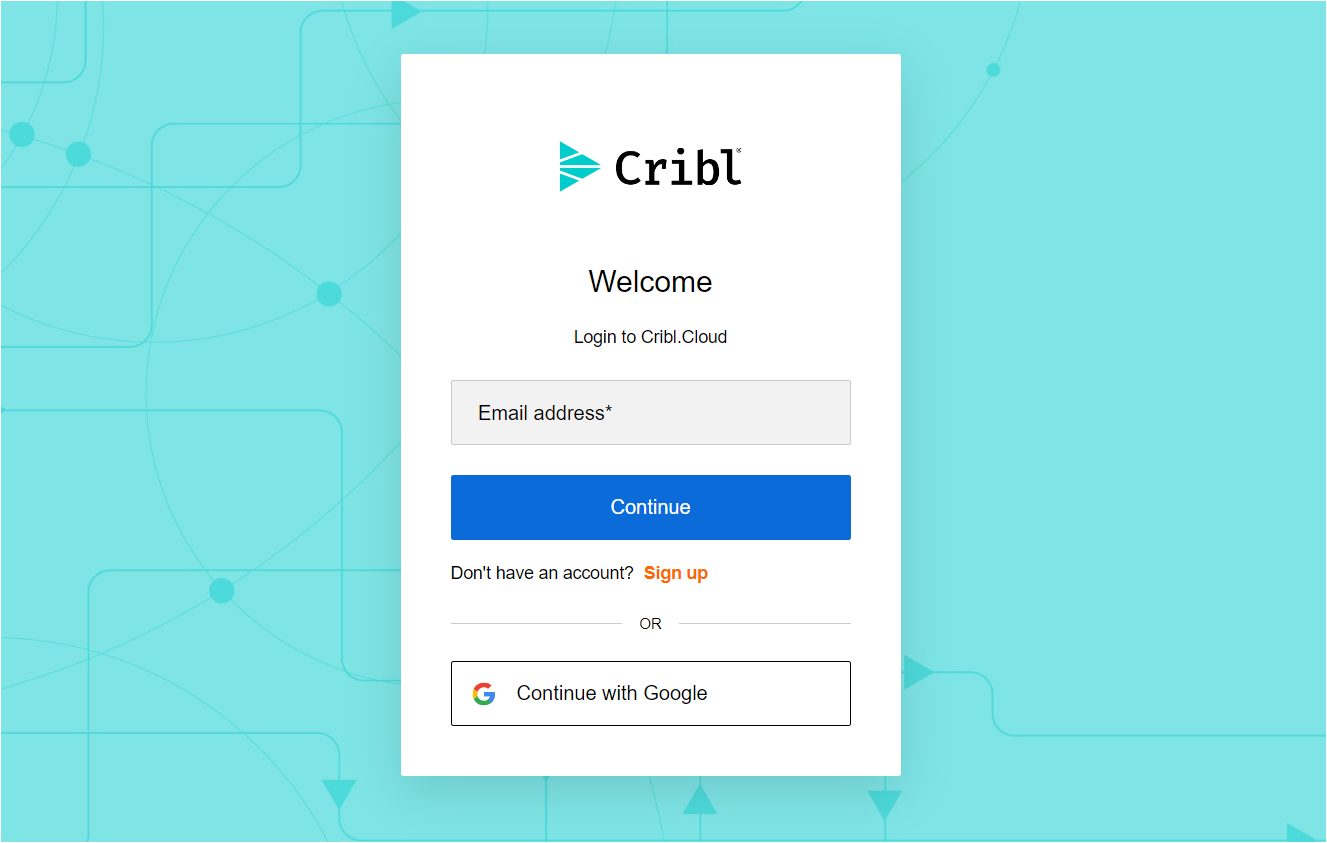
⚙️ Note: For learning purposes, we will use Cribl Cloud to manage our data collection agents.
1.2 Access the Edge Fleet
Navigate to Edge : After logging in, select the “Manage” button in the Cribl Edge section.
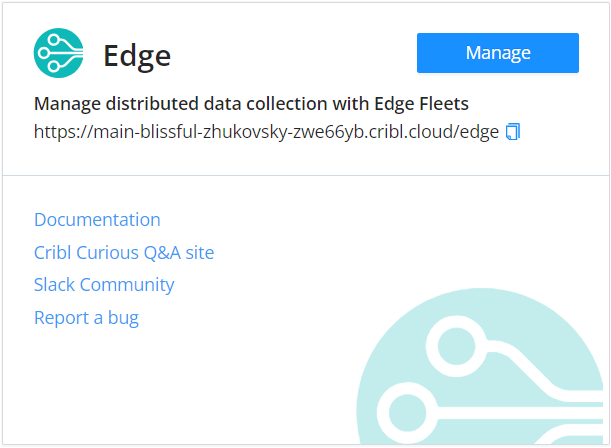
Fleet Overview: This will redirect you to the Edge page, where you can see a list of fleets and analytics
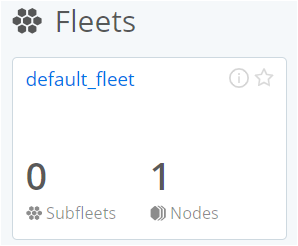
Navigate to Default Fleet: In Cribl Cloud, only one fleet (
default_fleet) will be available by default. Click ondefault_fleetto view the monitoring data for Edge nodes, sources, and destinations.
1.3 Add an Edge Node
Edge Node Overview: Edge nodes are responsible for collecting and sending data from your system to Cribl Stream
Edge Node Installation:
In the
default_fleetpage, click the "Add/Update Edge Node" button in the upper right corner
Choose an environment (Linux or Windows) where you want to install the Cribl Edge agent.
Linux Edge Node:
Hover over the Linux tab, click "Add", and copy the installation script.
Run the Script: Open a terminal and execute the script as the root user.
Start and Verify: After installation, ensure the agent is running with the command:
systemctl status cribl.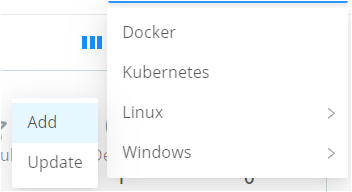
Windows Edge Node:
Hover over "Windows" and click "Add" to view the command prompt and PowerShell scripts.
Modify the Script: Edit the script by changing
"/qn"to"/q"to ensure the installation runs in the foreground.Run as Admin: Run the script with administrator privileges to install the agent

1.4 Check the Data Flow
Verify Agent Installation: Once the Edge node is installed, monitor its status in the Cribl Cloud by navigating to the Edge Node Monitoring page.
Real-Time Data Monitoring: Under Edge Fleet → default_fleet → Overview → Monitor, you can view metrics such as events in and bytes in to verify that the Edge node is collecting data.
List View for Health Status: Use the “List View” to check the health and status of each Edge node

Step 2: Configuring Cribl Edge to Send Data to Cribl Stream
Once the Cribl Edge agent is installed and collecting data, you need to configure it to send the collected data to Cribl Stream for further processing
2.1 Configure Source in Cribl Edge
Sources Overview: Data sources represent the type of data being collected (e.g., system metrics, logs).
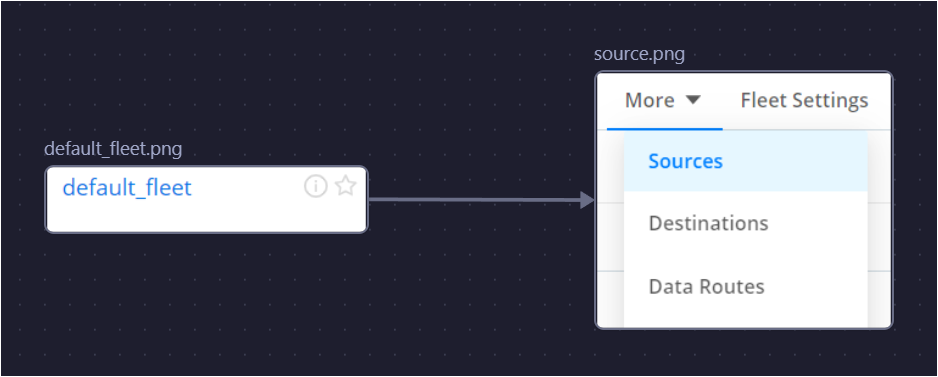
Navigate to default_fleet → More → Sources to add a new data source. Depending on your environment, configure one of the following:
Windows Metrics:
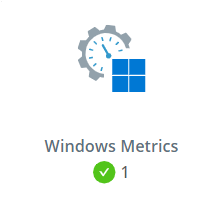
Enable the
in_windows_metricssource and configure it by setting host metrics to "All."Set processing settings with Fields to a field name and value like
observ_data = 'edge_win_metrics', Preprocessing Pipeline topassthruand Connect Destination set toSend to Routes.Commit and deploy the changes.
System Metrics:
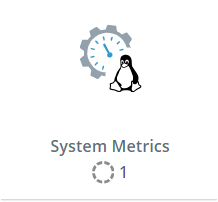
Enable the
in_system_metricssource and configure processing settings.Set Fields to a field name and value like
observ_data = 'edge_lin_metrics', Preprocessing Pipeline topassthru.Ensure Connect Destination set to
Send to Routesand commit/deploy changes
⚠️ Note:
Can’t enable both Windows and Linux sources in the same fleet simultaneously.
The destination can also be connected via interface using quick connect for more details check the docs.
2.2 Configure Destination in Cribl Edge
Go to default_fleet → More → Destinations to add a new destination.

Use Cribl TCP as the destination for both Windows and Linux sources:
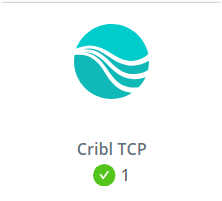
Set a unique output ID (e.g.,
cribl_system).Enter the IP address from Cribl Cloud’s Access Details (can be get from your cribl cloud → Access details → Ingress IPs).
Enter the port number (e.g.,
10300).Commit and deploy the changes.
2.3 Verify Source and Destination Configuration
Verify that both source and destination are enabled (indicated by a check mark).
If there’s an issue (indicated by a cross mark), check the logs to resolve configuration errors.
2.4 Create the Data Route
Route Overview: The data route links the source (e.g.,
Windows or Linux metrics) to the destination (Cribl Stream).Route Configuration :
In Cribl Stream, go to default_fleet → More → Data Routes.
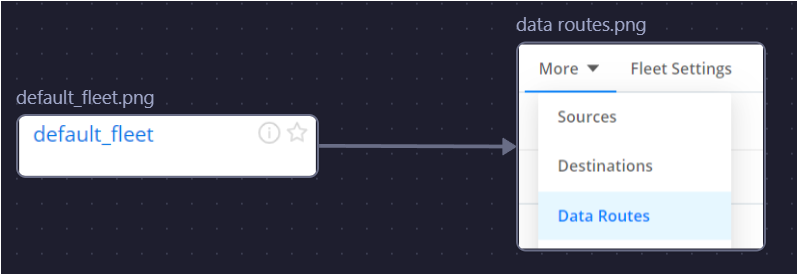
Create a new route that links the source and destination:
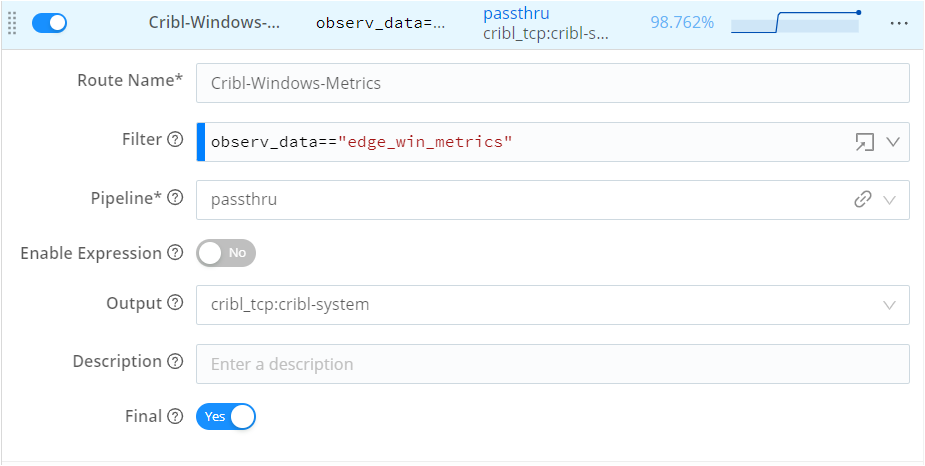
Name the route and set filter expressions (
observ_data == 'edge_win_metrics'for Windows andobserv_data == 'edge_lin_metrics'for Linux) to ensure only Windows/Linux metrics are sent through this route.Set the pipeline to
passthru(default pipeline that doesn't modify data) and output to the Cribl TCP destination created earlier (cribl_tcp:cribl_system).Save the changes and Commit and deploy it to activate the route.
2.5 Capture and Verify Data Flow
Status Check: Use the source and destination status and chart pages to view live data

Capture Events: Monitor live data capture in source, destination and the data route.
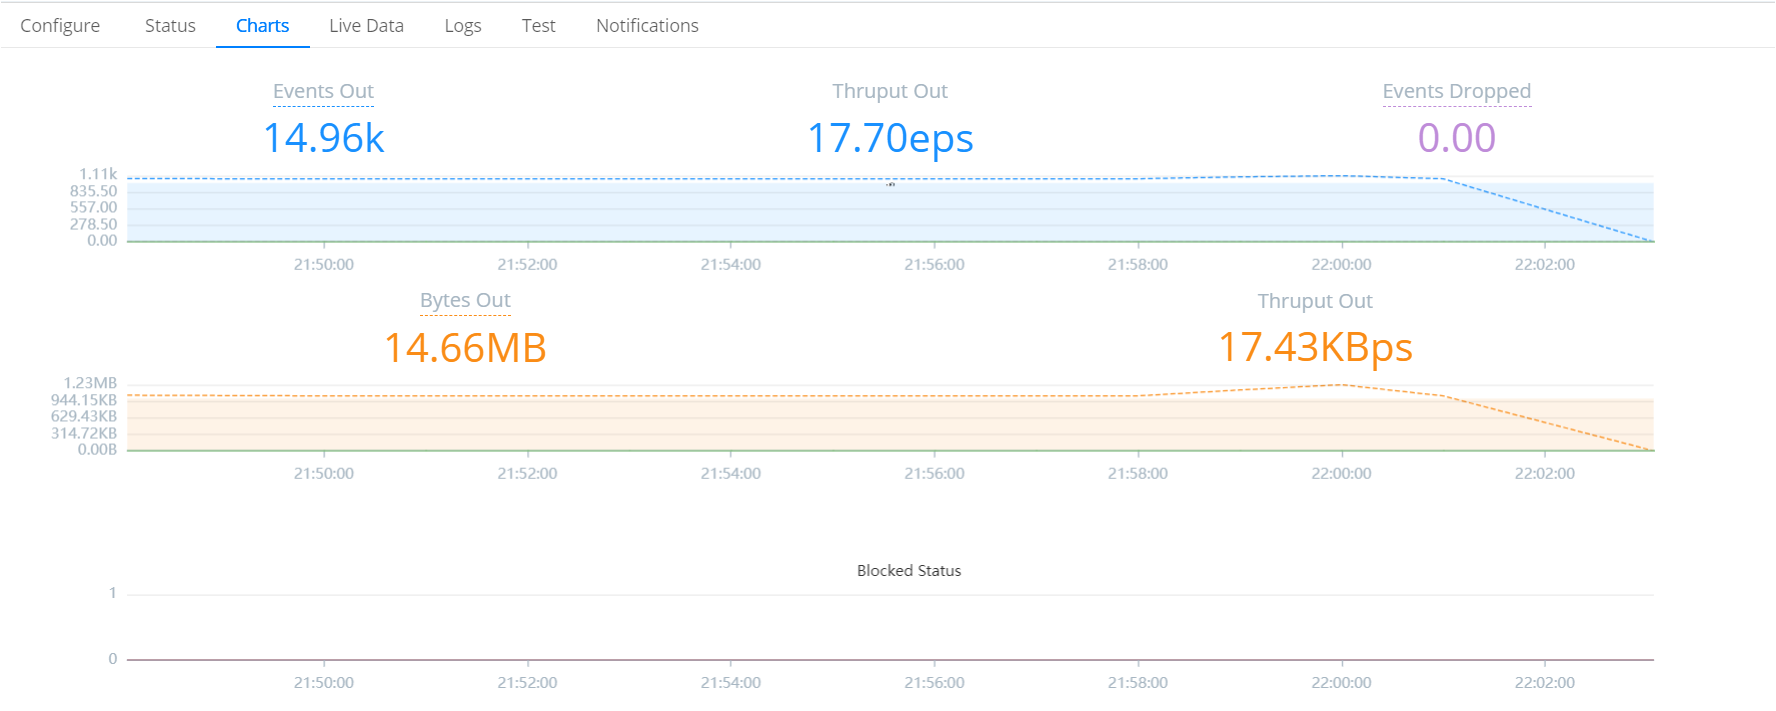
Verify Routing: Ensure that data flows seamlessly from source to destination by capturing data in the data route as well.
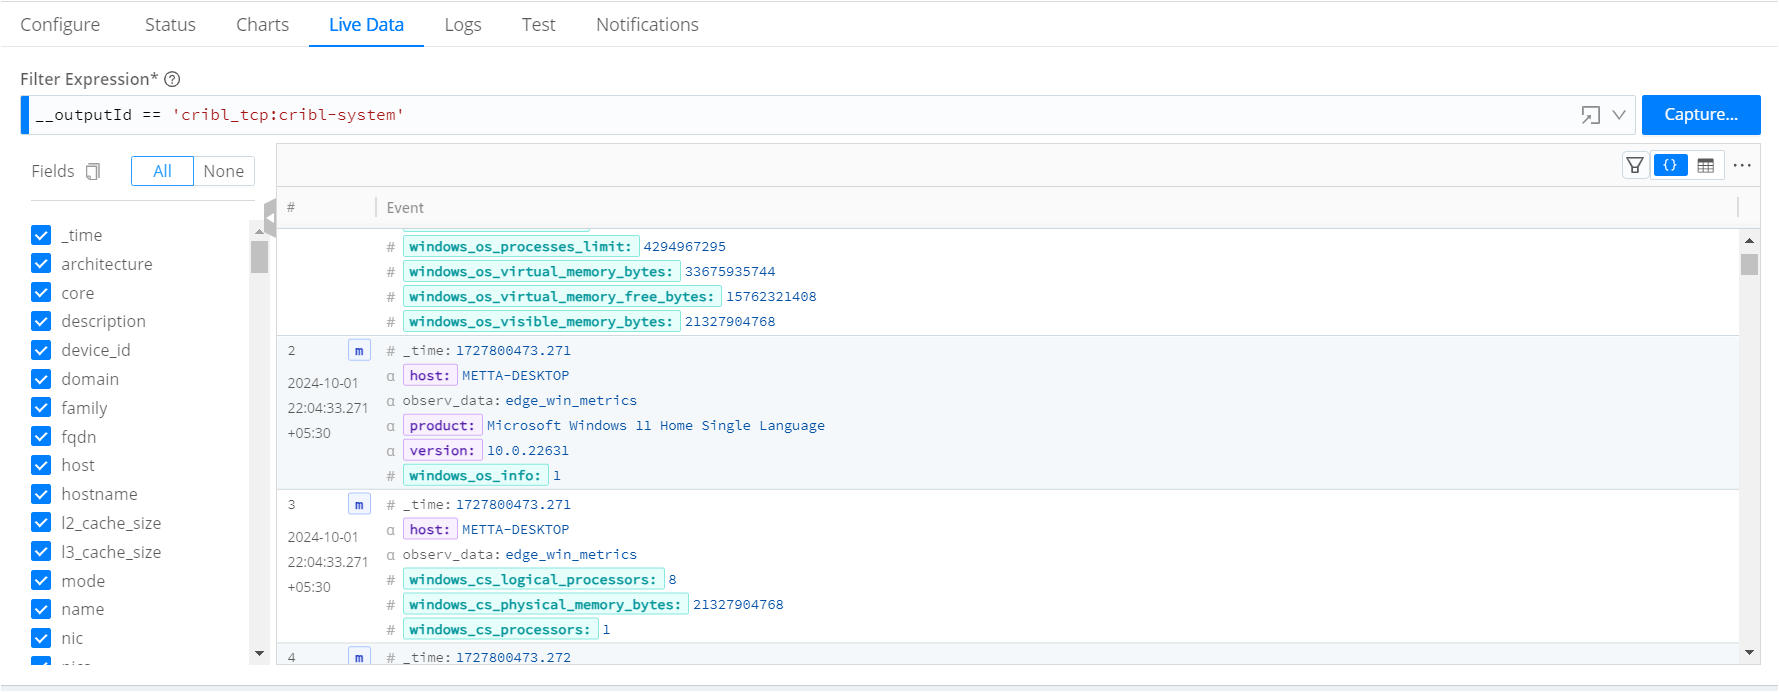
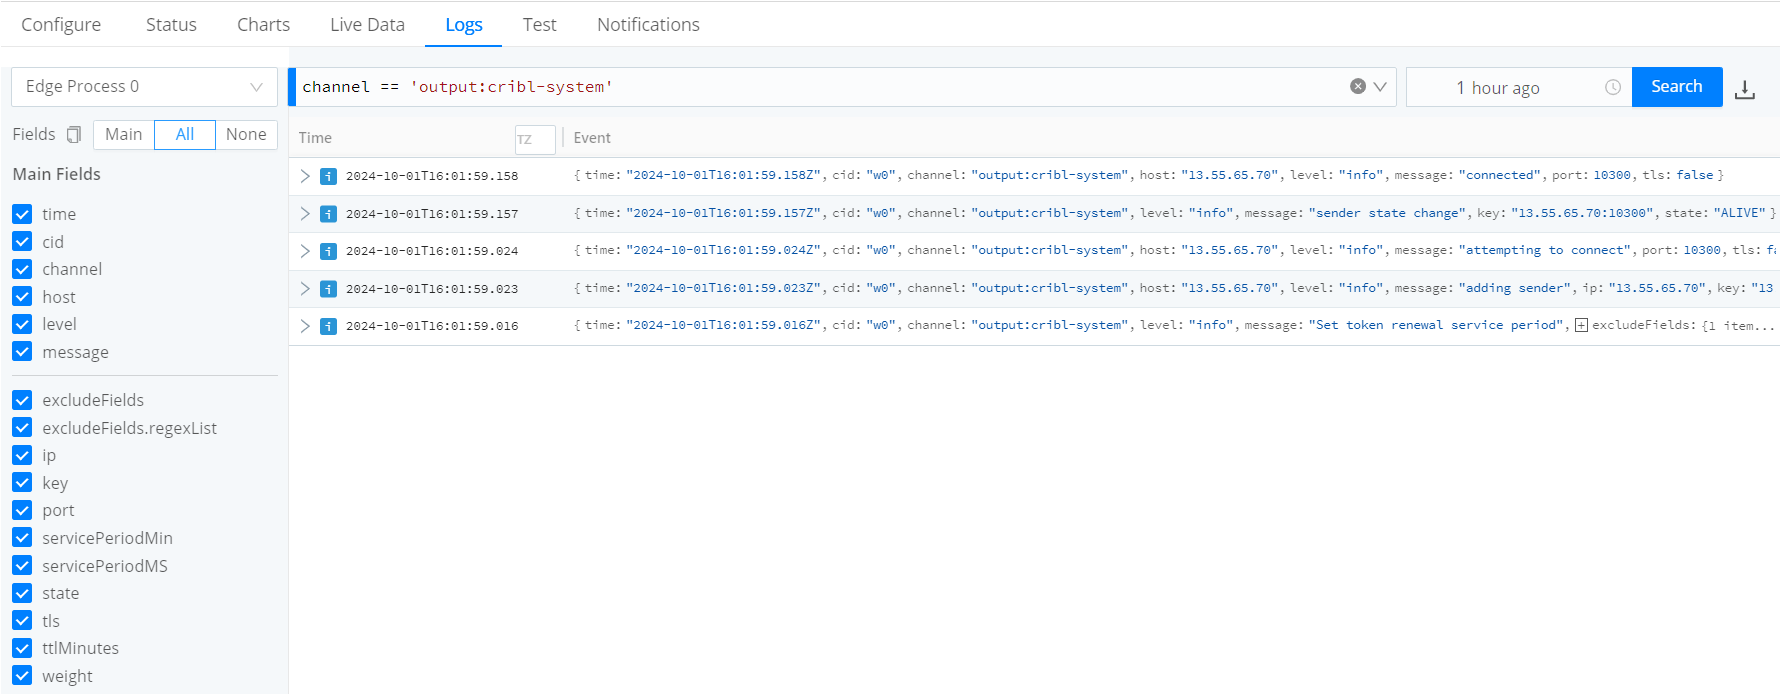
Troubleshoot: If data doesn’t flow as expected, check the logs in Cribl Edge for potential configuration errors.
Step 3: Processing Data with Cribl Stream
Now that Cribl Edge is sending data to Cribl Stream, the next step is to configure Cribl Stream to receive, process, and route this data.
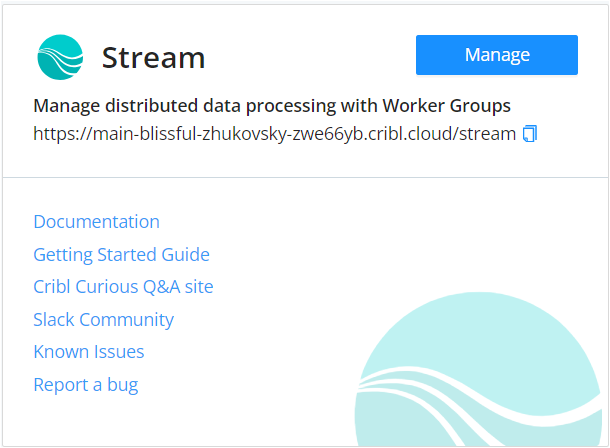
3.1 Configure Source in Cribl Stream
Setting Up the TCP Source: Cribl Stream needs to listen for incoming data from Cribl Edge via a TCP connection.
Navigate to Cribl Stream → Default → Data → Sources and add a source.
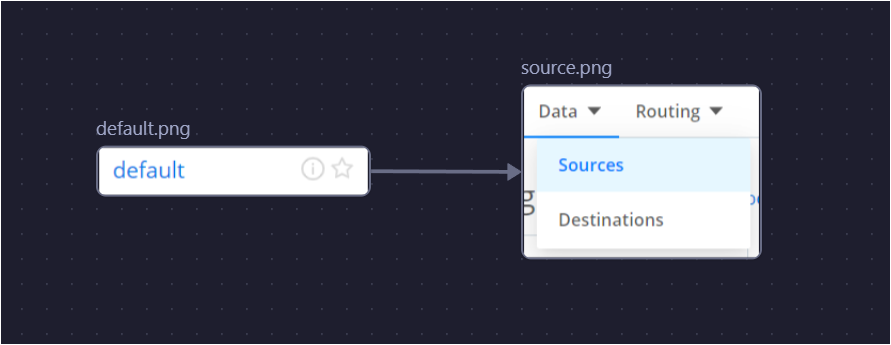
Select Cribl TCP Source to match the configuration of the Cribl Edge TCP destination.
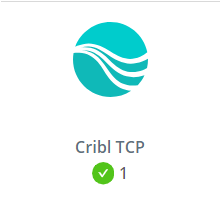
Add a new source with a unique input ID, set the IP to bind to the edge which will be in default
0.0.0.0, and configure it with the same port used in Cribl Edge (e.g.,10300).Commit and deploy the changes.
3.2 Configure Destination in Cribl Stream
Destination Configuration: The processed data will be sent to Grafana using Prometheus Remote Write.
Go to Cribl Stream → Default → Data → Destinations and select Prometheus destination.
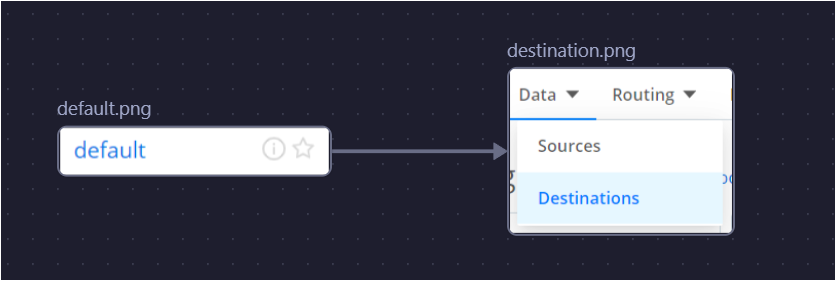
Create a new destination with a unique input ID like
prometheus-output.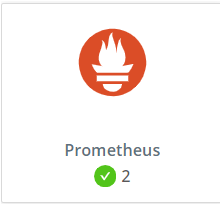
Set the remote write URL , get the Prometheus Remote Write URL from your Grafana Cloud account (found under Prometheus → Send Metrics → Write URL )
Commit and deploy the changes.
3.3 Create a Processing Pack
Processing Packs: A processing pack in Cribl Stream allows you to create modular pipelines to filter, enrich, or modify data before it reaches its destination.
Go to Cribl Stream → Default → Processing → Packs and add a pack.
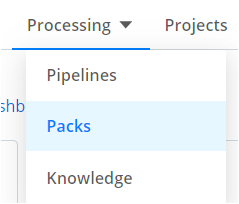
Create a new pack (e.g.,
Cribl-Windows-Metrics).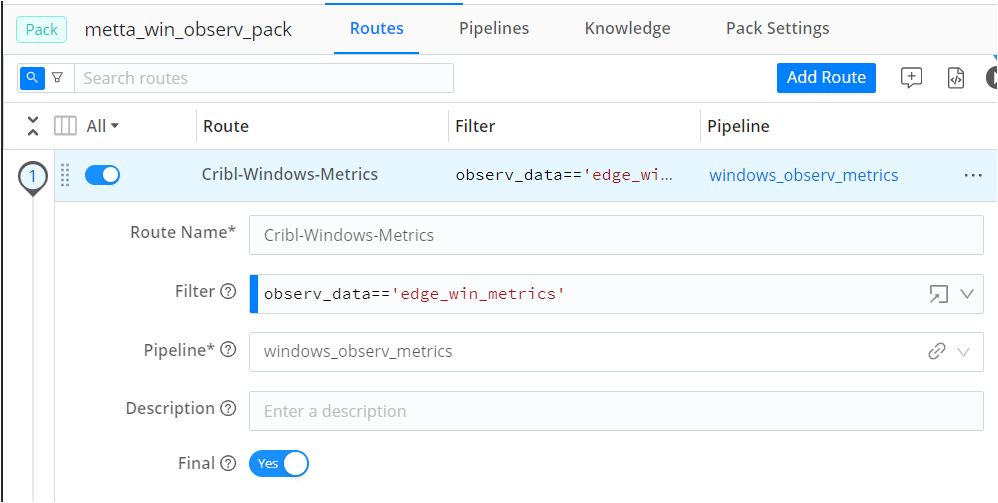
Use functions and routes within the pack to process data via adding a pipelines.
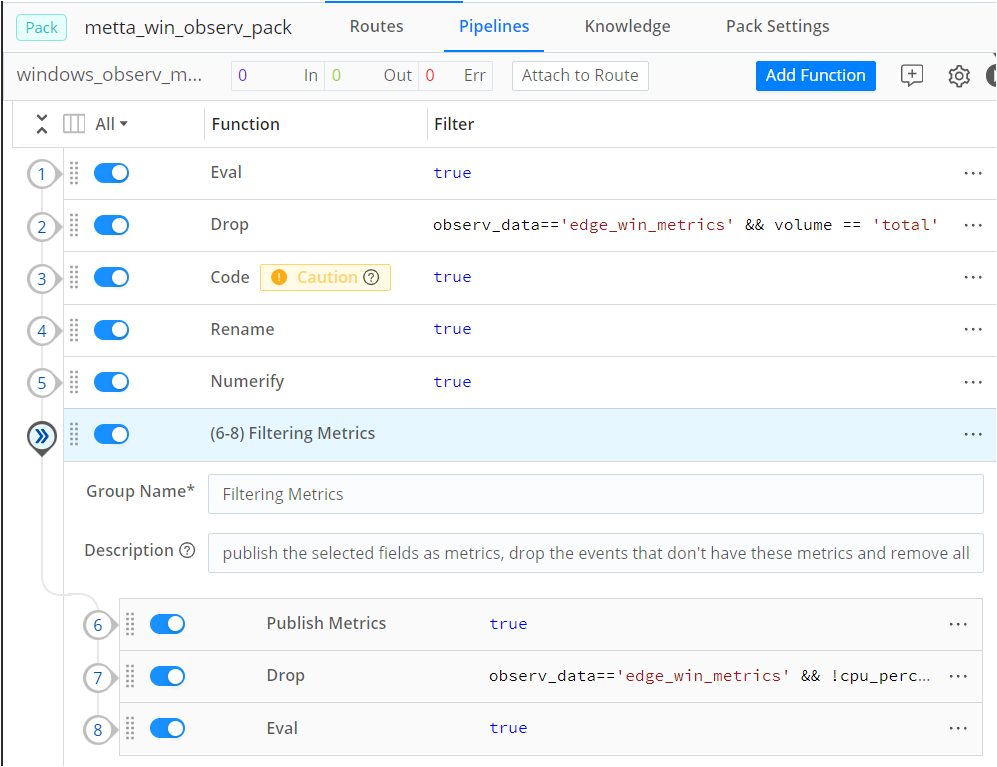
For more details on packs and pipelines, refer to Cribl documentation
3.4 Configure the Data Route
Create a Data Route: Similar to Cribl Edge, create a data route that links the TCP source to the Prometheus destination.
In Cribl Stream, go to Default → Routing → Data Routes and add a route.

Set filter expressions based on the source tags (
observ_data=='edge_win_metrics').Link the pack (
Cribl-Windows-Metrics) to the source and set the output to Prometheus (prometheus:prometheus-output).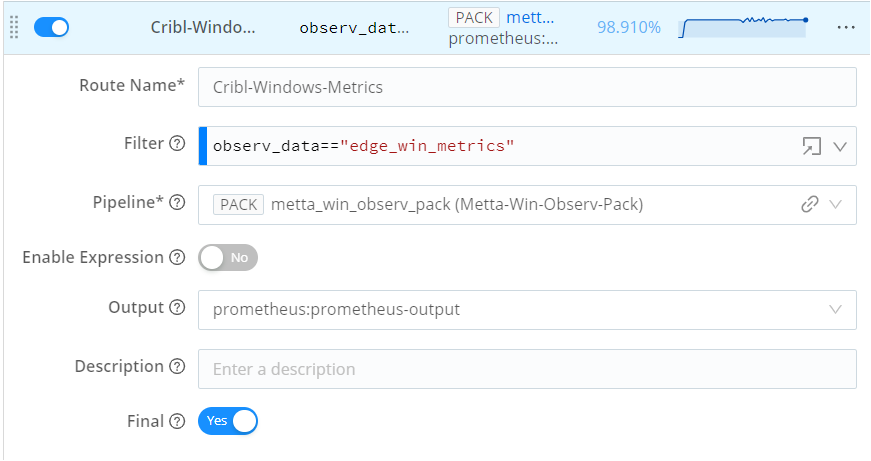
Commit and deploy the changes.
3.5 Verify Data Flow
Monitor Event Flow: Use the data capture and status pages in Cribl Stream to verify that events are flowing correctly from the sources to the destinations.

Capture Data: Monitor live data for around 50 minutes and ensure the data is being processed and sent to Grafana.
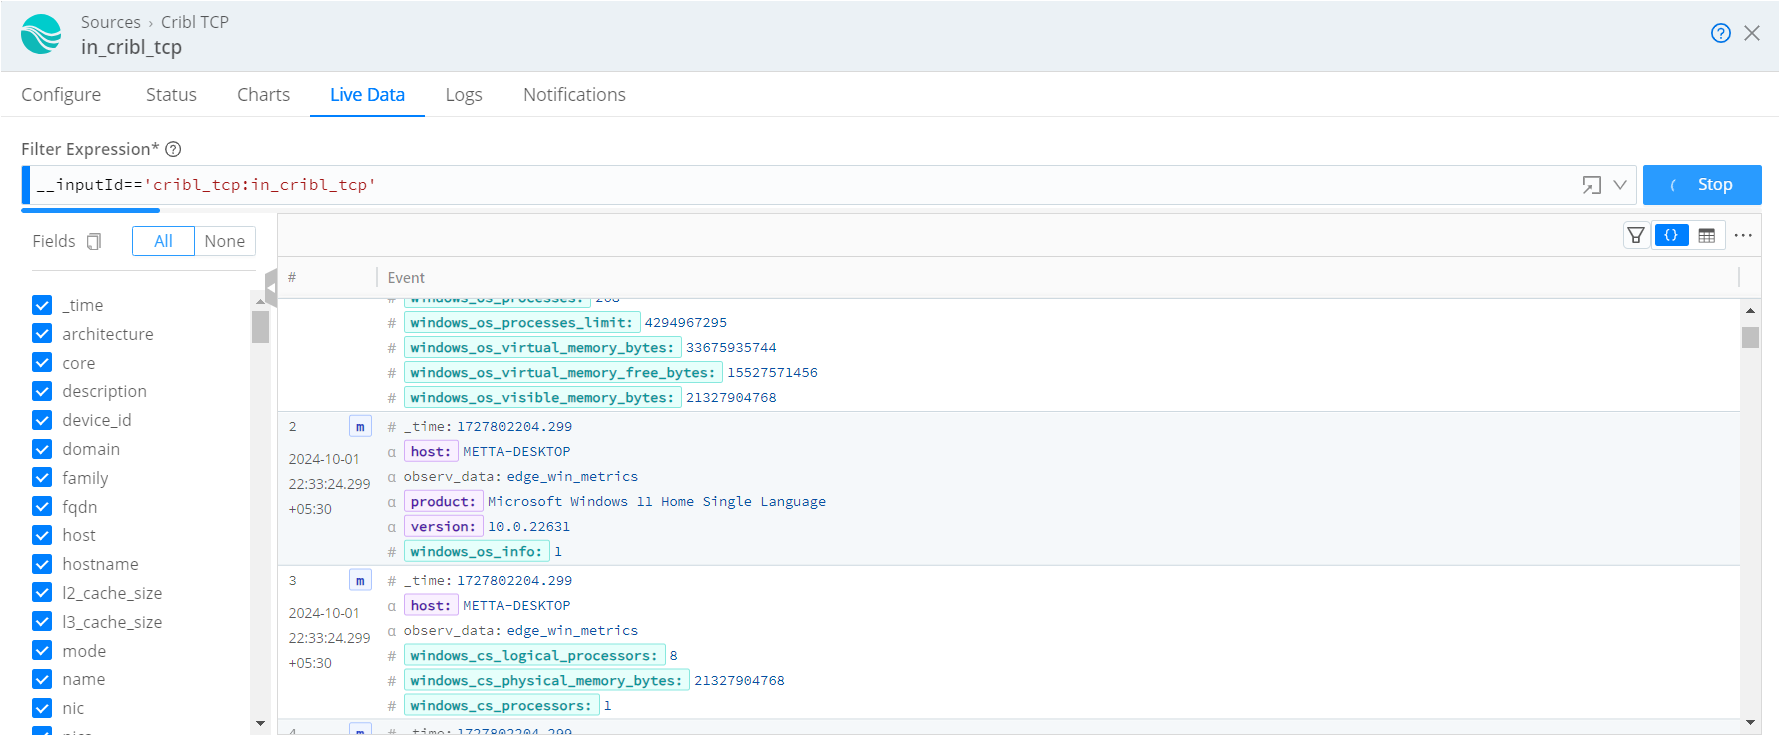

Troubleshoot: If data doesn’t flow or doesn’t processed as expected , check the logs for potential configuration errors.
Step 4: Utilizing Data in Grafana
Once the data has been processed by Cribl Stream, you can visualize it in Grafana.
4.1 Create a Dashboard in Grafana
Log in to Grafana Cloud: If you don’t have an account, sign up at Grafana Cloud.
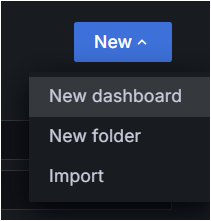
Create a Dashboard: After logging in, go to Create Dashboard and add a new panel.
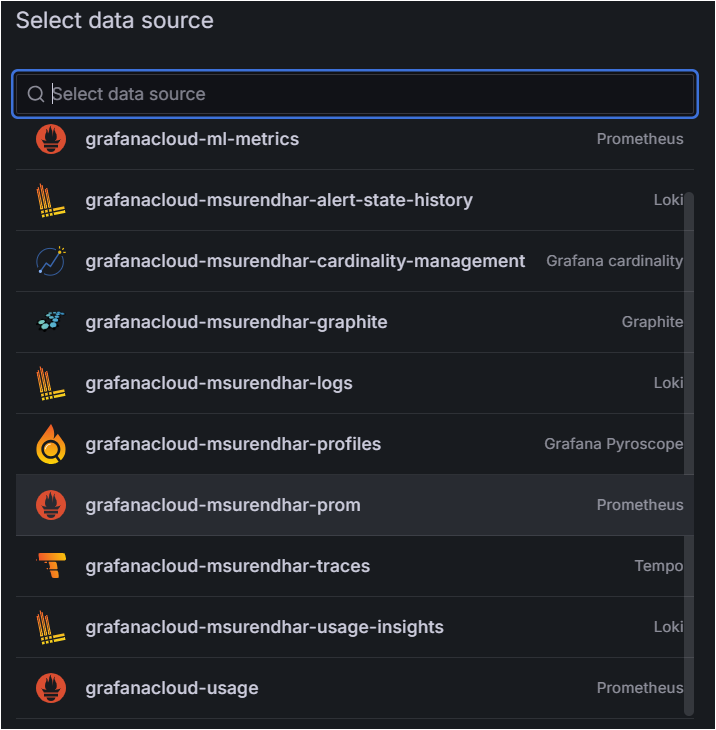
Data Source: Set the data source to Prometheus.
Query Configuration: Use PromQL queries to retrieve data from Prometheus. For example,
windows_cpu_percent_activeto visualize CPU usage.Customize the Panel: Give the panel a meaningful name (e.g.,
Windows CPU Metrics).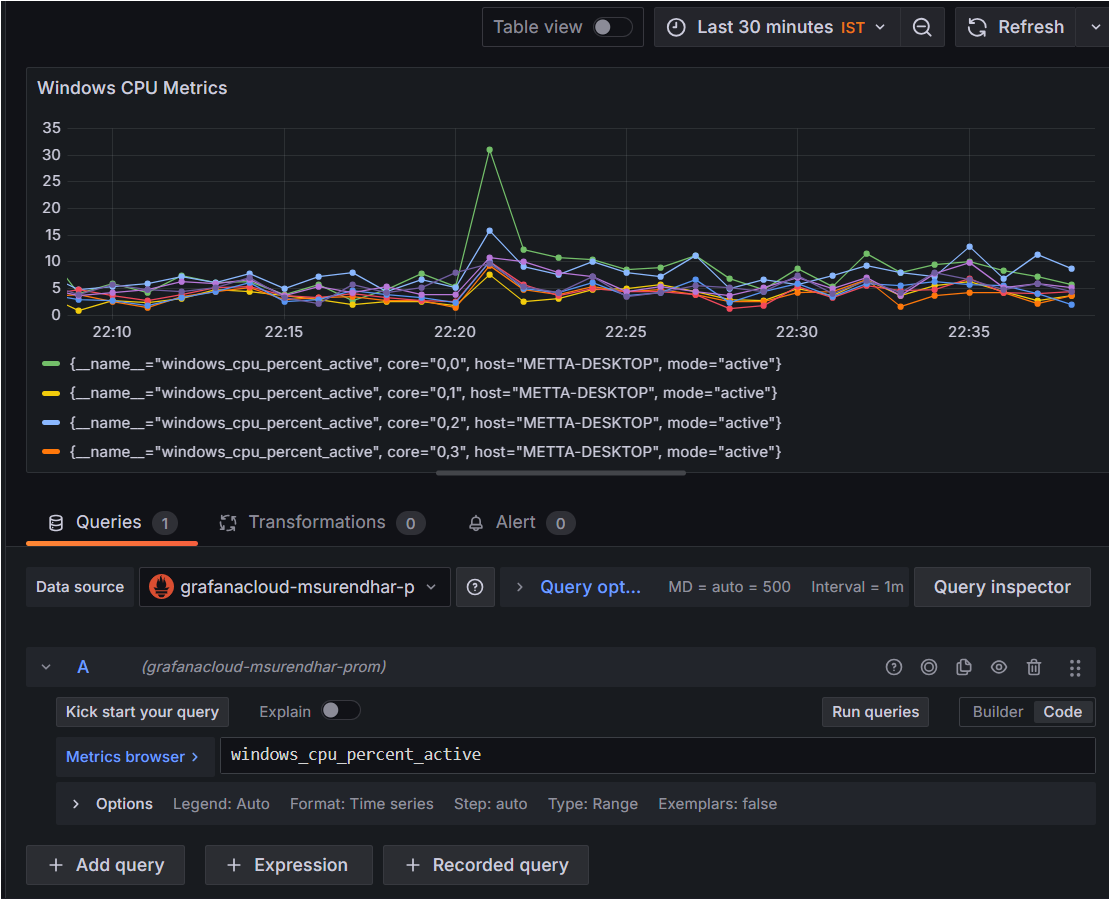
4.2 Fine-Tuning Visualization
Panel Customization: Adjust time ranges, choose chart types (line, bar, etc.), and set thresholds for key metrics.
Multiple Panels: Add panels for different metrics (memory, disk usage, network I/O).
Deploy Dashboard: Save and deploy the dashboard for real-time monitoring.
4.3 Monitoring and Analyzing Data
Real-Time Data: Grafana will now display real-time metrics based on the data collected, processed, and routed from Cribl Edge and Stream.
Alerts and Notifications: Set up alerts in Grafana based on threshold values (e.g., high CPU usage).
Conclusion
And there you have it! By following these steps, you can successfully set up Cribl Edge for data collection, Cribl Stream for processing, and Grafana for visualizing the data. This guide provides a foundation for customization of your data pipelines, allowing you to monitor, process, and visualize large-scale metrics effectively.
In the next post, we will dive deeper into the detailed steps for creating dashboards, panels, and alerts in Grafana. Stay tuned!
Subscribe to my newsletter
Read articles from Metta Surendhar directly inside your inbox. Subscribe to the newsletter, and don't miss out.
Written by

Metta Surendhar
Metta Surendhar
Interned as a Platform Engineer specializing in Observability and Gen AI, passionate about open-source contributions and real-world solutions. Currently pursuing an MSc in Integrated IT at CEG (2024-26), SAASCEG'24, CTF'24. I'm exploring LLMs, Haystack, Retrieval-Augmented Generation (RAG), and Gen AI, focusing on building conversational AI bots. Diving into new tools to enhance chatbot performance and interaction quality!