Day 73 - Grafana 🔥
 Pooja Bhavani
Task 1: Setup Grafana in Your Local Environment on AWS EC2
- We'll follow the steps outlined in the Official Grafana Documentation
Step 1: Launch an AWS EC2 Instance
Log in to your AWS Management Console.
Navigate to the EC2 service.
Click on "Launch Instance" to create a new instance.
Select an appropriate Amazon Machine Image (AMI) for your EC2 instance. Choose an image that supports Grafana, like Amazon Linux or Ubuntu.
Choose an instance type based on your requirements.
Configure instance details such as the VPC, subnet, security group, and any other necessary settings.
Add storage if needed, and configure tags and security settings as per your requirements.
Review and launch the instance.
Step 2: Connect to Your EC2 Instance
Once the instance is launched, select it from the EC2 dashboard.
Click on "Connect" to get connection instructions.
Follow the instructions to connect to your instance using your preferred method.

Step 3: Install Grafana
Complete the following steps to install Grafana from the APT repository:
- To install the required packages and download the Grafana repository signing key, run the following commands:
 sudo apt-get install -y apt-transport-https
 sudo apt-get install -y software-properties-common wget
 sudo wget -q -O /usr/share/keyrings/grafana.key https://apt.grafana.com/gpg.key
- To add a repository for stable releases, run the following command:
echo "deb [signed-by=/usr/share/keyrings/grafana.key] https://apt.grafana.com beta main" | sudo tee -a /etc/apt/sources.list.d/grafana.list
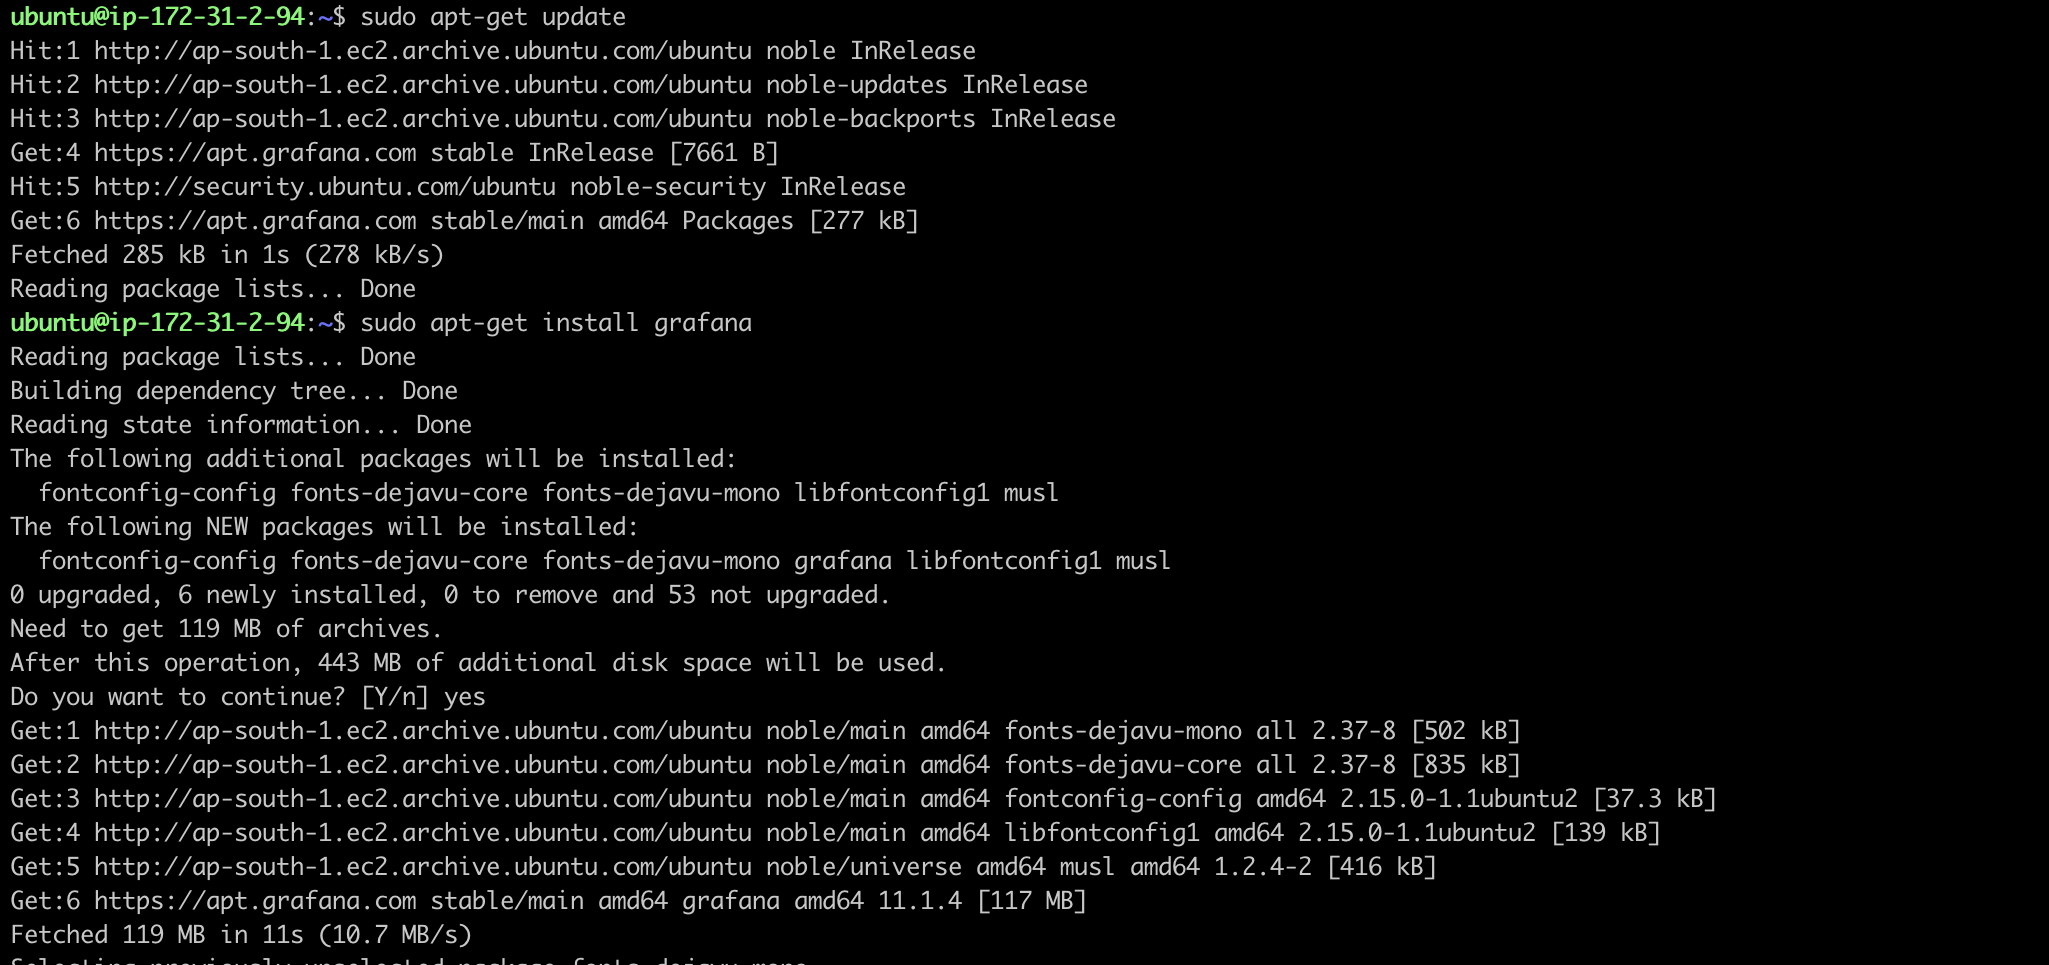
Run the following command to update the list of available packages:
To install Grafana OSS, run the following command:
 # Installs the latest OSS release:
 sudo apt-get install grafana

Step 4: Start and Enable Grafana Service
- Start the Grafana service:
sudo systemctl start grafana-server
- Enable the Grafana service to start on boot:
sudo systemctl enable grafana-server

Step 5: Access Grafana Web Interface
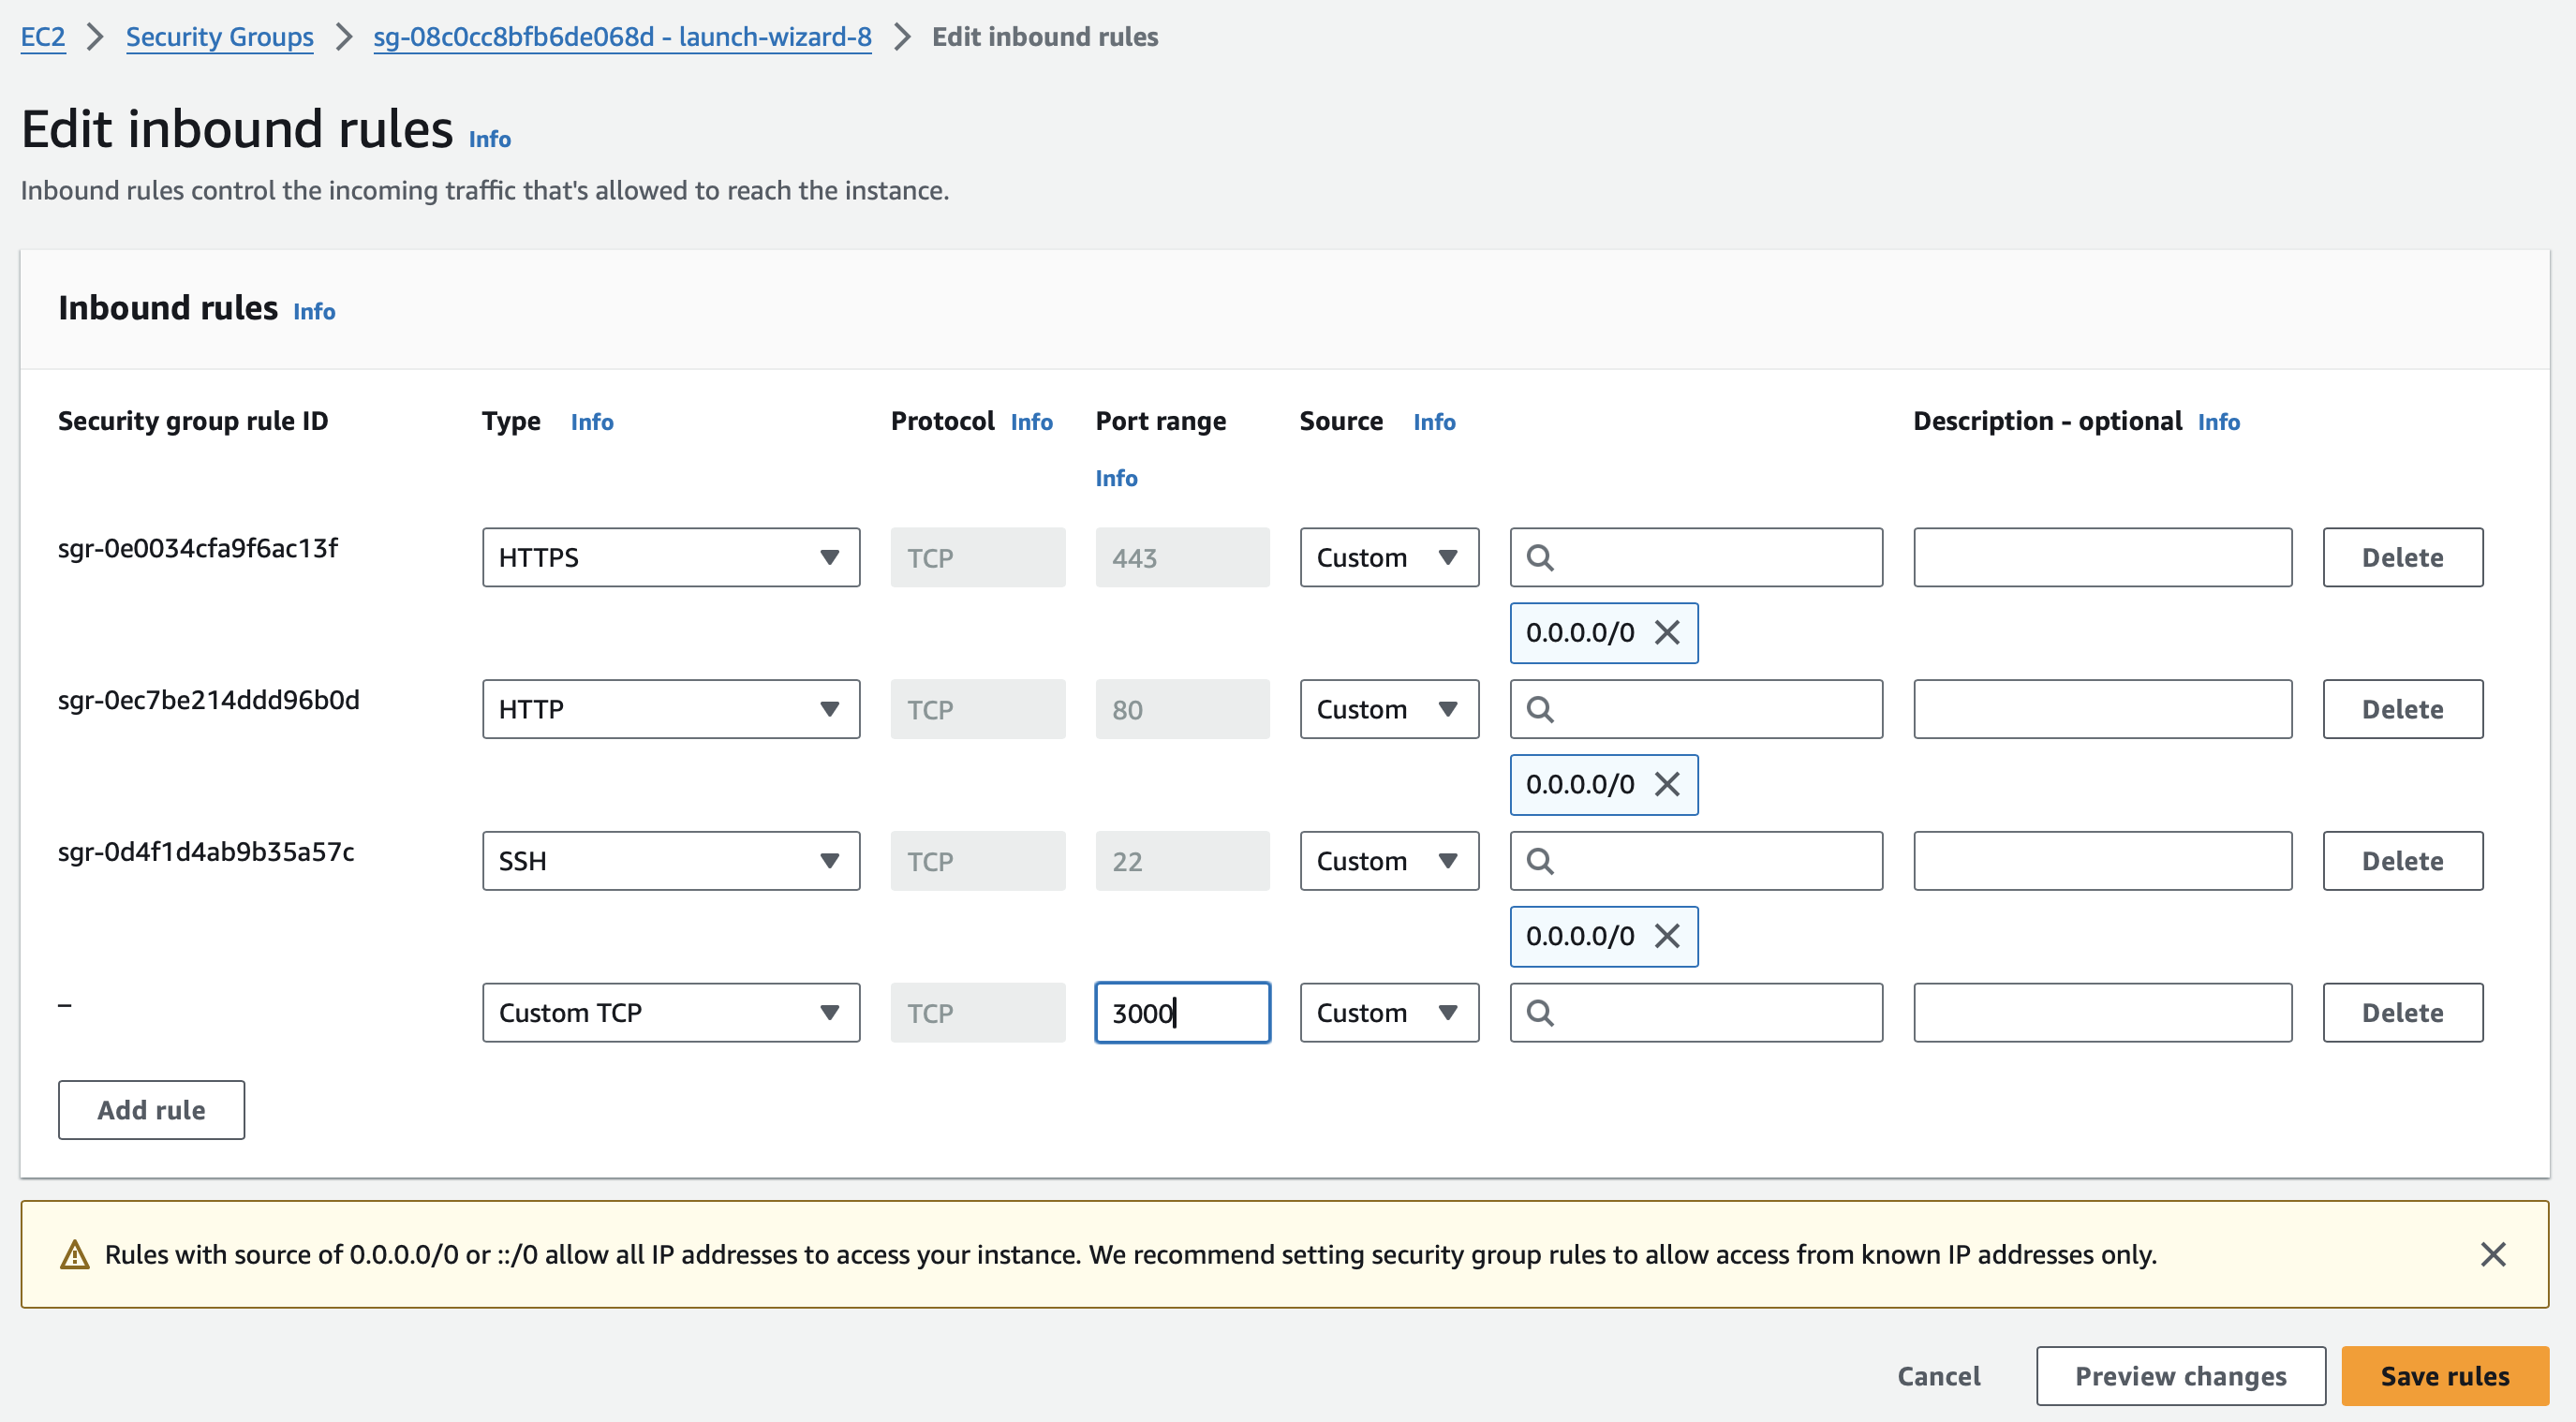
- By default, Grafana listens on port 3000. Open port 3000 in the security group associated with your EC2 instance to allow incoming traffic.

- Open your web browser and access Grafana using your EC2 instance's public IP address or DNS name, followed by port 3000 (e.g., http://your-ec2-public-ip:3000).

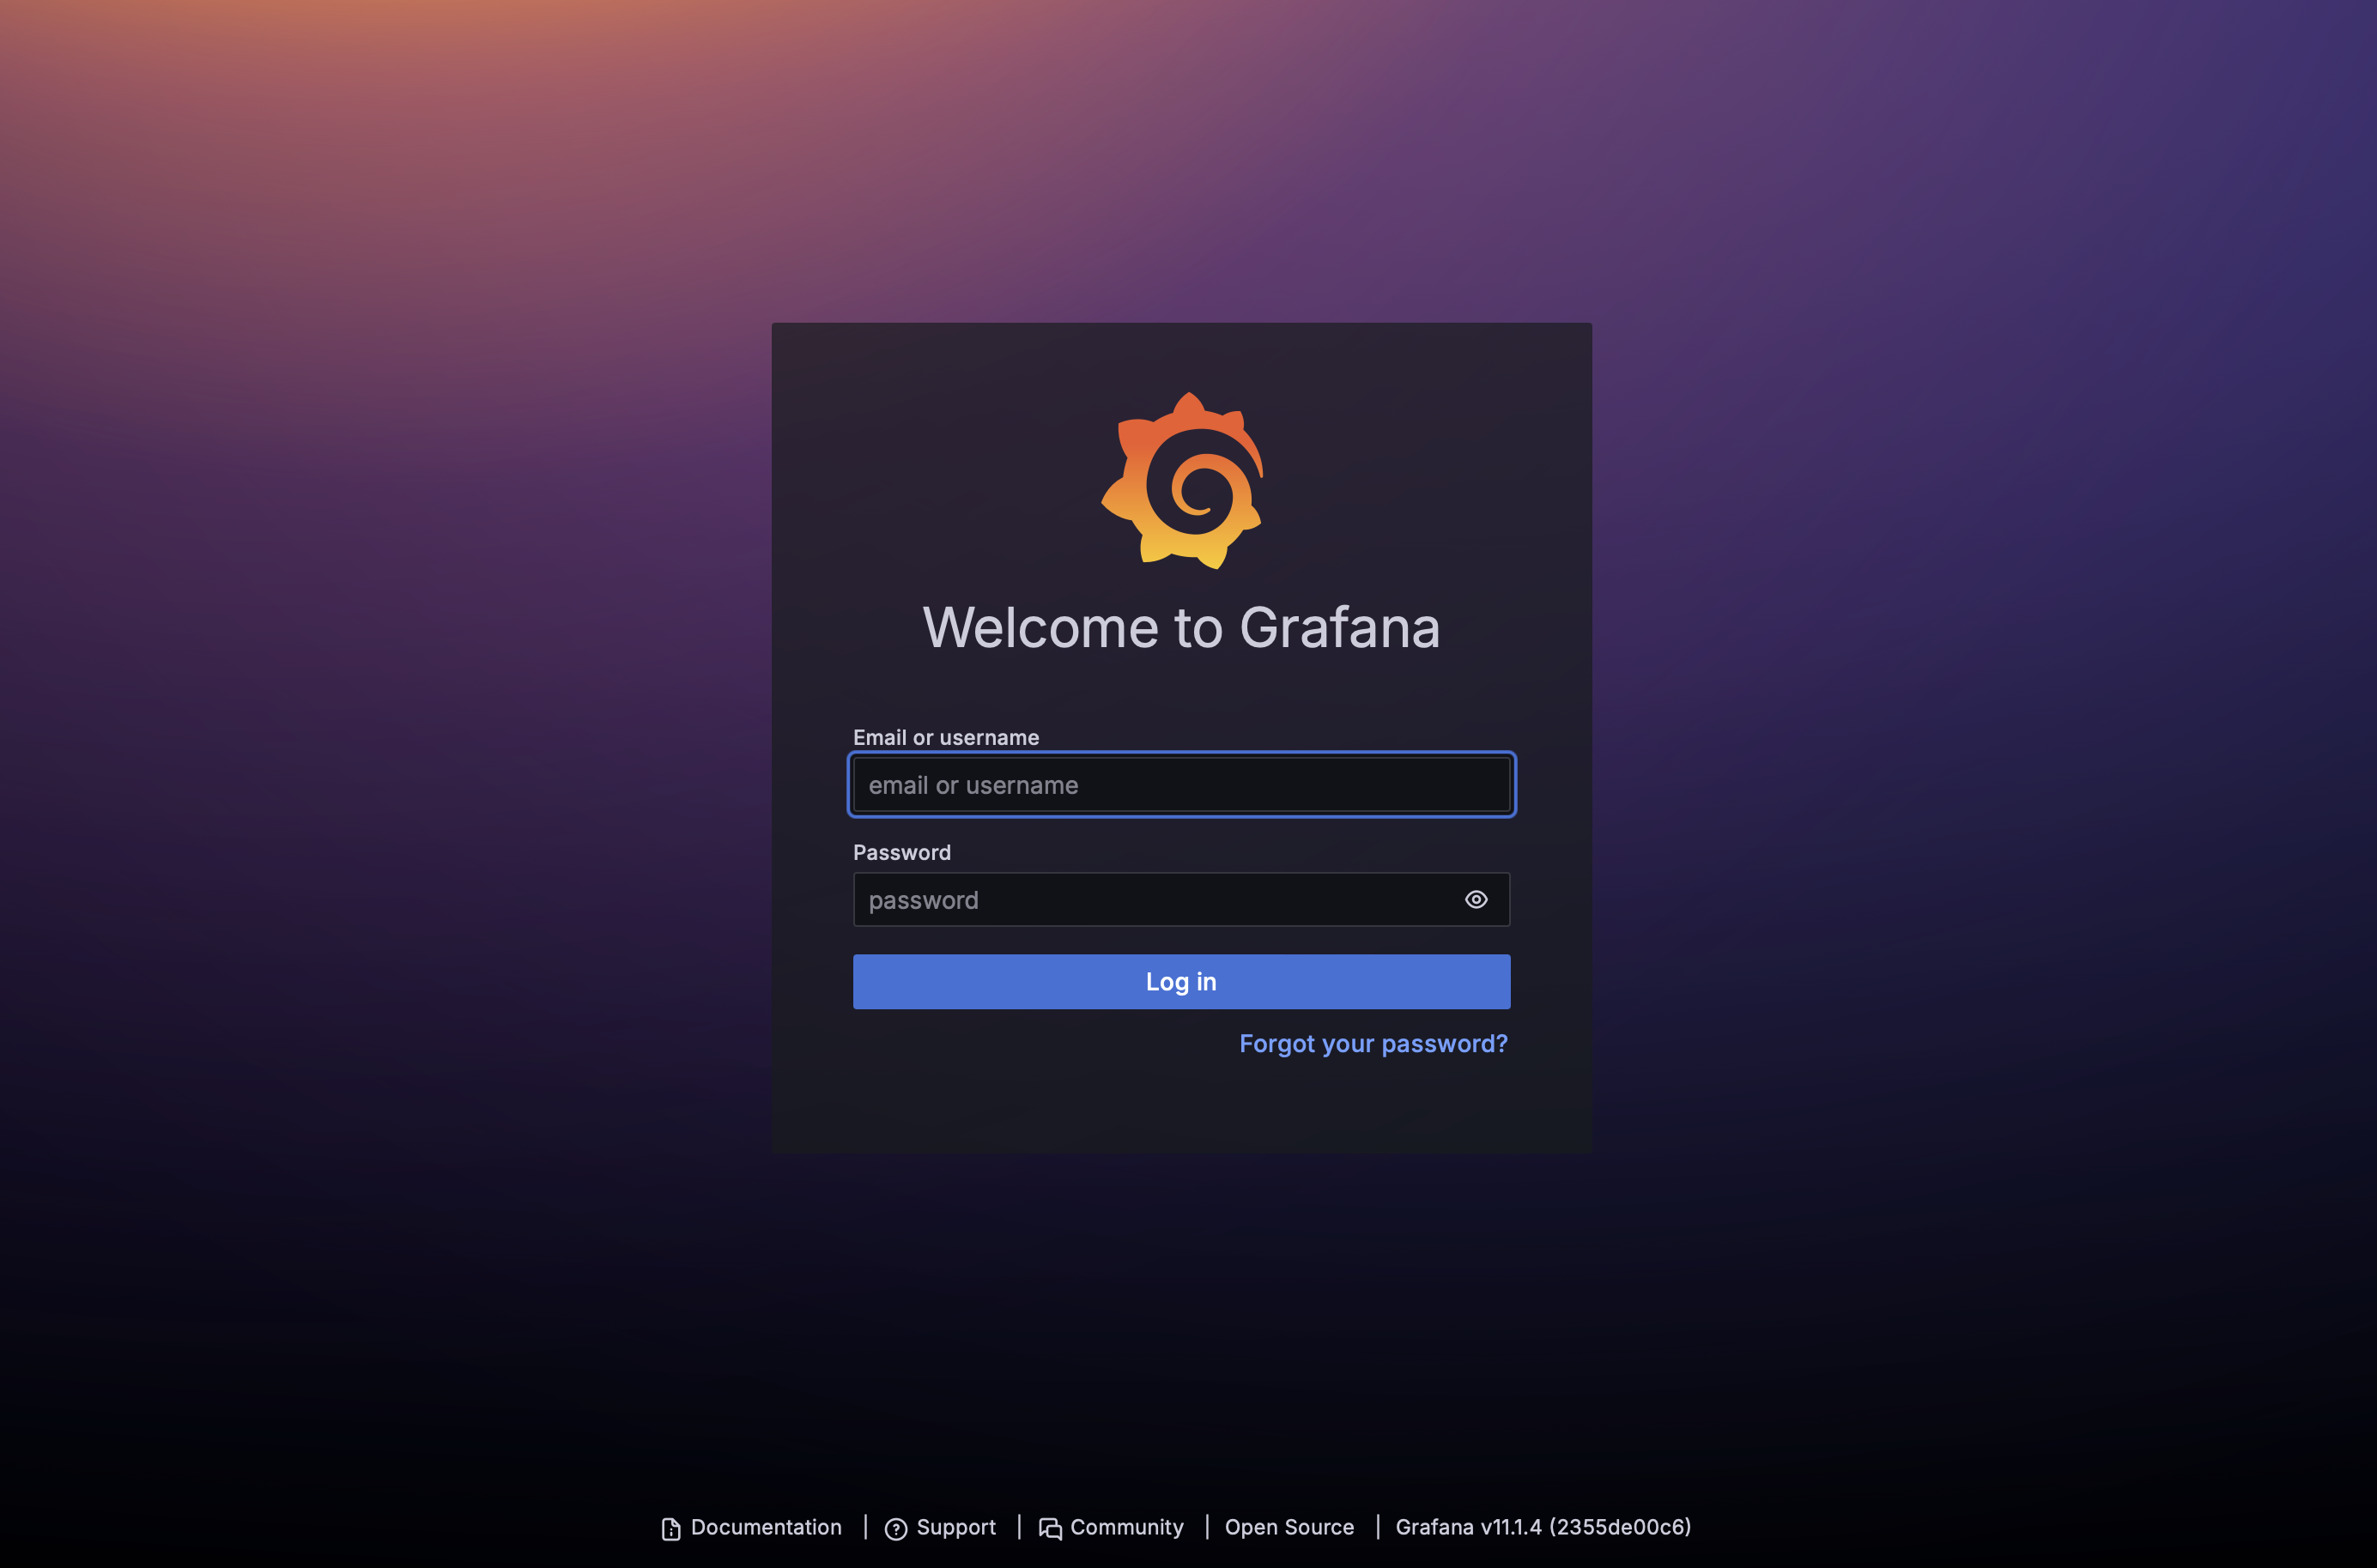
Step 6: Log in to Grafana
On the sign-in page, enter
adminfor username and password.The first time you access Grafana, you will be prompted to set up an admin password.
Set your admin password and log in with the default username "admin" and the password you just set.

Step 7: Explore Grafana
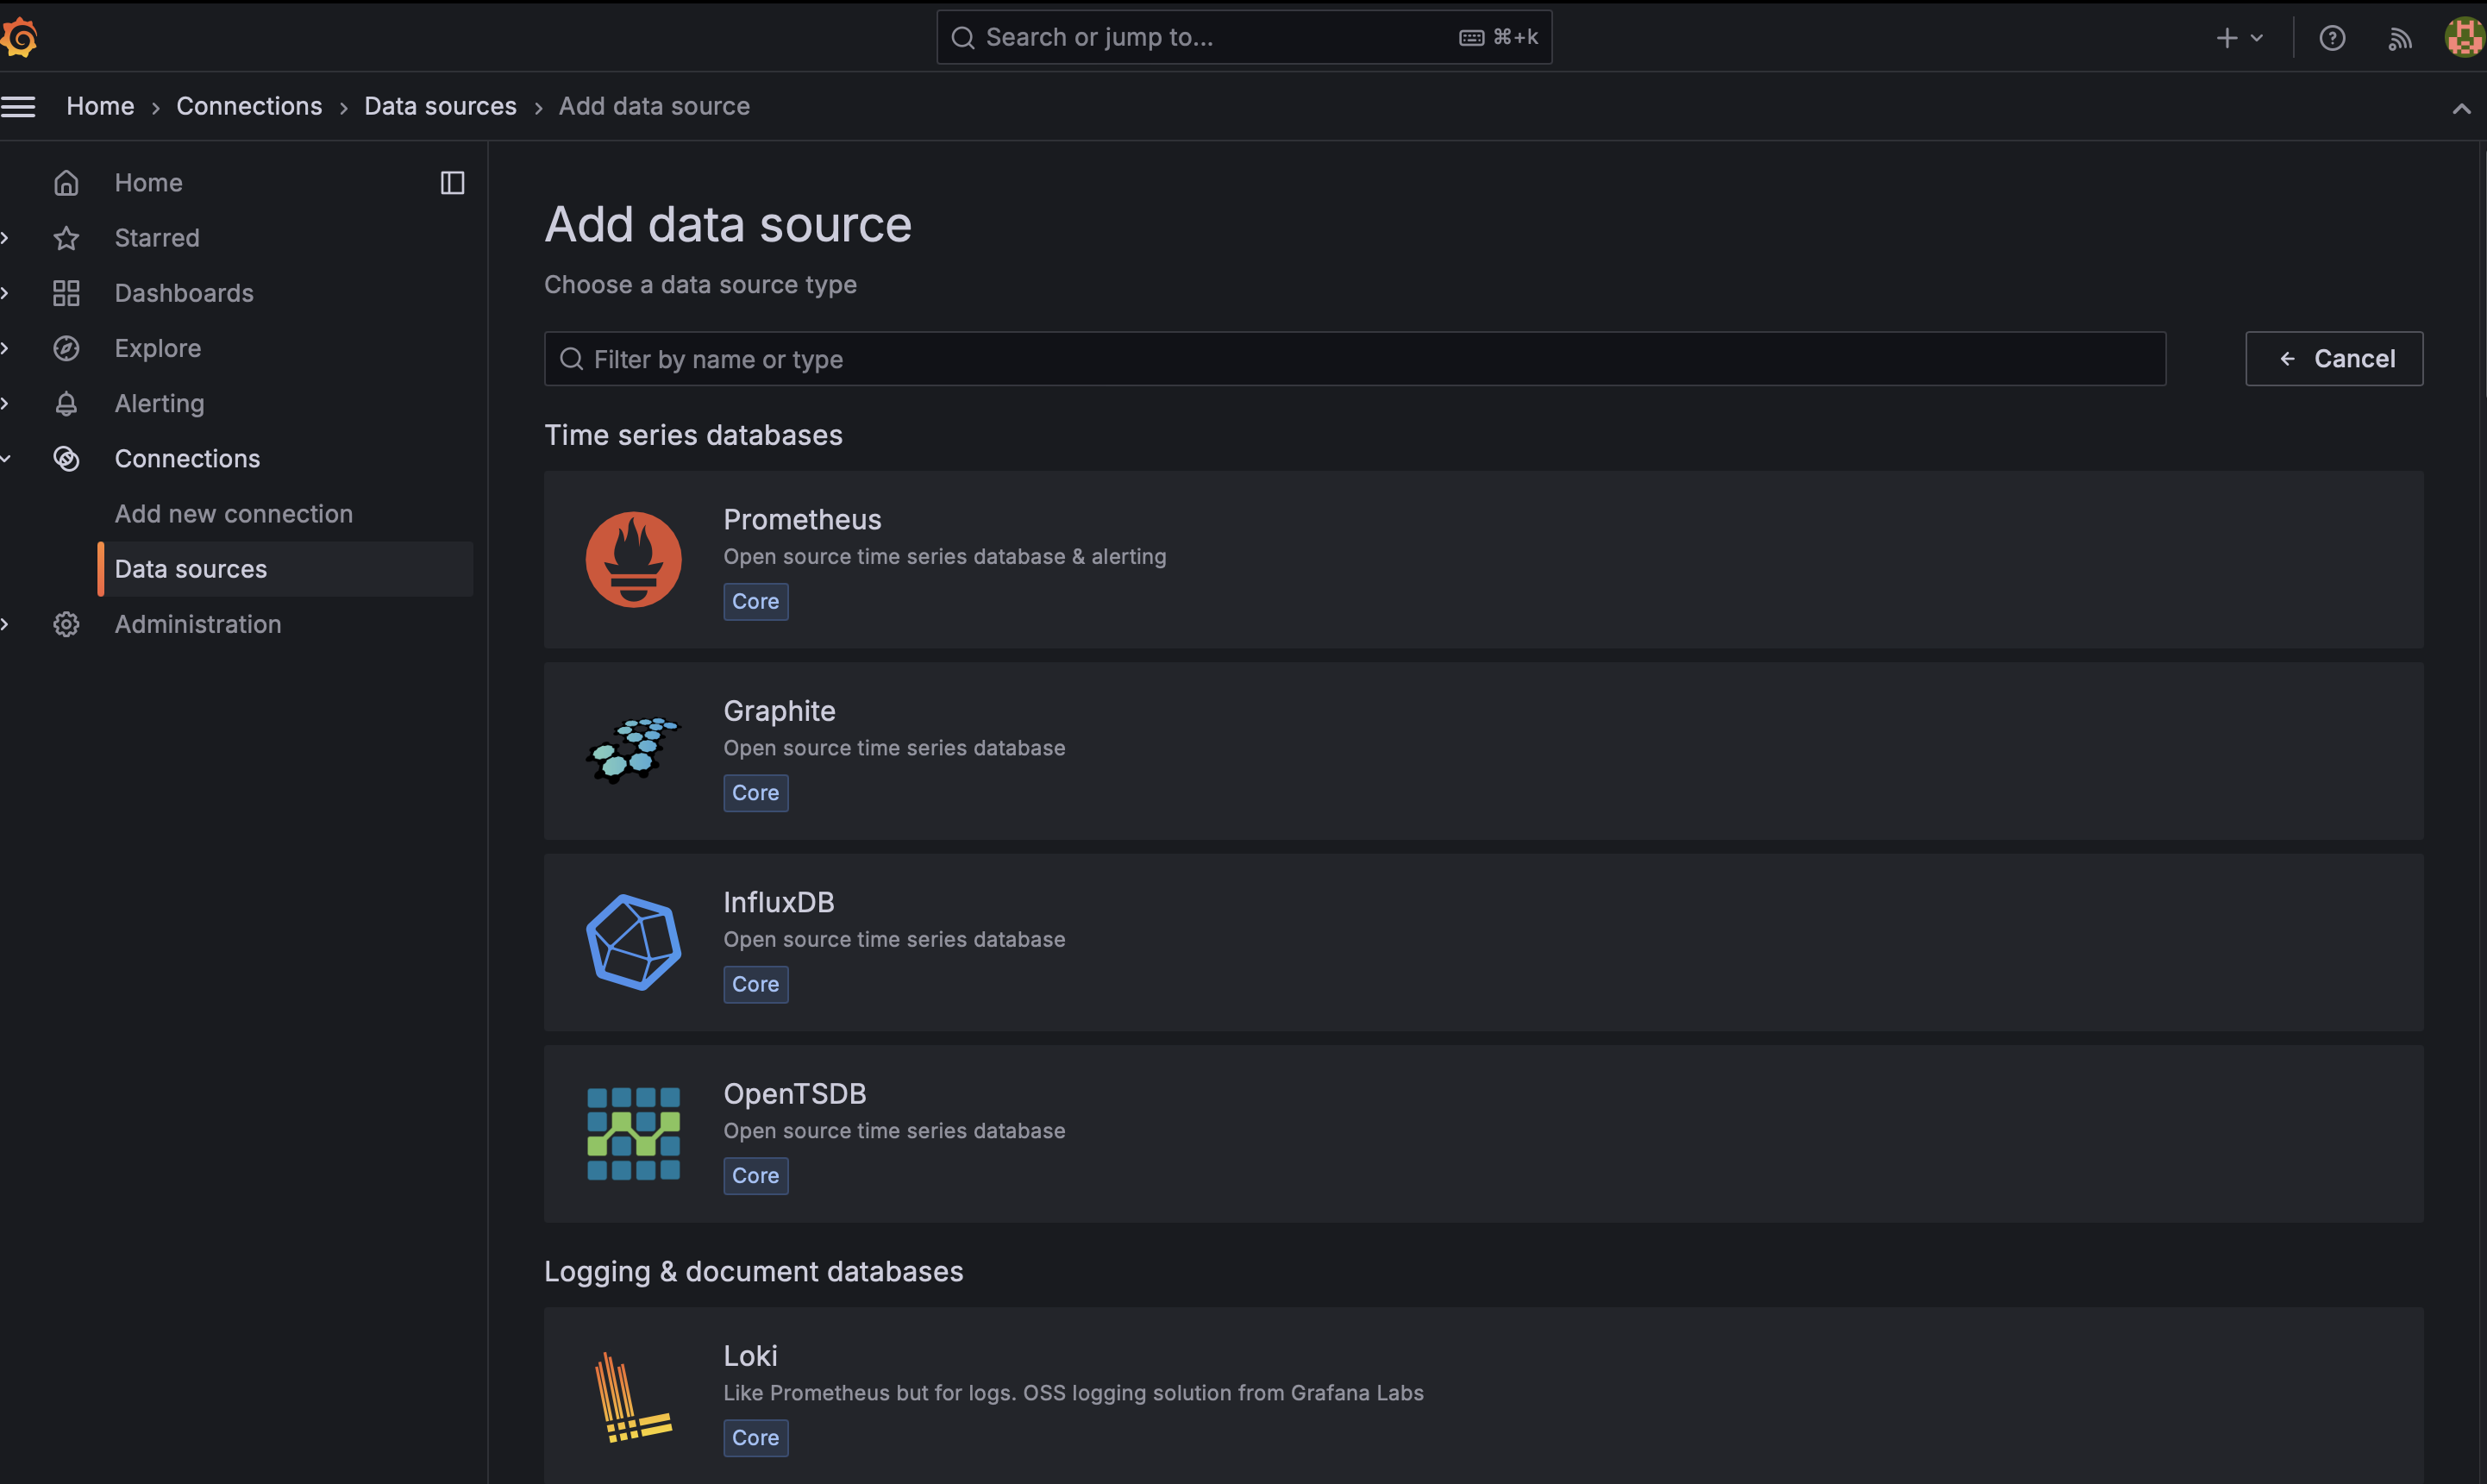
- Once you log in, you will be directed to the Grafana dashboard.

- Explore the Grafana interface and start creating your own dashboards to visualize and monitor data from various data sources.
Subscribe to my newsletter
Read articles from Pooja Bhavani directly inside your inbox. Subscribe to the newsletter, and don't miss out.
Written by
