Observability in software
 Al Duncanson
O11y, pronounced similar to “folly” without the “f”, is a numeronym commonly used to refer to observability in relation to software infrastructure.
We get o11y by taking the first and last letters in the word “observability”, and replacing the inner letters with the total count of those letters, 11.
We use o11y to represent observability, for the same reason we use i18n to represent internationalization, or a11y for accessibility. These contractions are just easier to type!
But what does it mean for software to be observable?
Let’s explore what makes software observable, and how you can increase visibility in your software systems.
The three pillars of observability
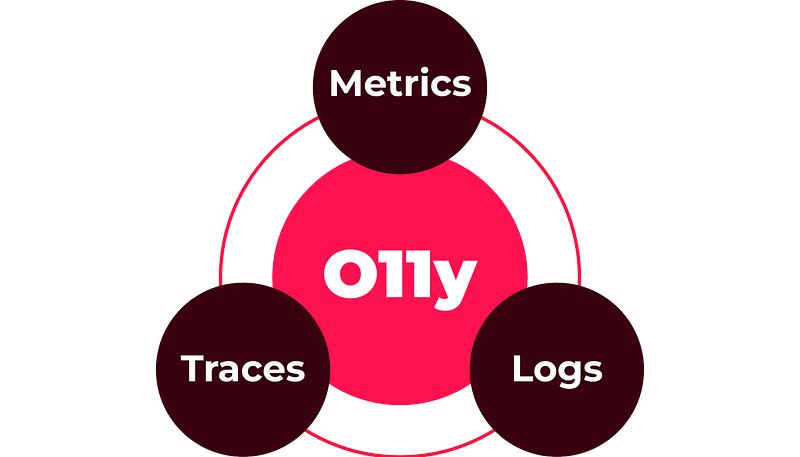
O11y primarily consists of three components:
Metrics
Logs
Traces
These make up the three pillars of observable software.
Our first pillar of o11y is Metrics.
Metrics
In regards to software engineering, metrics are quantifiable measurements that we can analyze to determine the health of a system.
Commonly used metrics include:
CPU utilization
Network throughput
Application response time
API latency
Activity logs
All of which together enable you to discern the current and overall health of your software systems at a glance.
Metrics are great for understanding your software’s health and performance, but how do we know what is happening in the system?
This question brings us to our second pillar of o11y: Logs.
Logs
Logs are likely the most familiar aspect of monitoring software for most people.
They provide us with a detailed chronological record of past and ongoing events within the system. Providing insight into issues, errors, or general operational information.
There are many different types of logs, some of which include:
Event logs
Transaction logs
Message logs
Server logs
Each of which provide us with different information that we can view, record, process, and take action on if necessary.
We get our quantitative insights from metrics, and logs provide us with a chronological record of events… But how do we figure out what components of our system were involved? Or how long each event took to execute?
These questions can be answered by our third and final pillar: Traces.
Traces
A trace captures and records the entire journey of a request within a system.
Traces provide more information than logs, such as connection, performance, concurrency, and causality, offering a deeper understanding due to the additional context they provide.
With logs, we can only see a chronological record of events. This is fine if our software is synchronous, but can get confusing and harder to follow when we introduce concurrency.
Jessica Kerr, an Engineering Manager at Honeycomb.io, writes:
If you don’t want to guess about connection, performance, concurrency, or causality, then traces are for you.
Traces can be analyzed using a causal graph or causal tree, which is a tool derived from the structured analytical technique known as Causal Factor Tree Analysis, a form of Root Cause Analysis.
Suman Karumuri, previously a Sr. Staff Software Engineer at Slack, explains in depth how they model their traces as causal graphs in his article Tracing at Slack: Thinking in Causal Graphs.
Implementing o11y in your software
Now that we’ve covered what o11y is, and the three pillars it’s built on, I’ll show you how to setup your own o11y infrastructure, with highlight.io.
Highlight.io is an open-source, full-stack monitoring platform.
Get started by setting up an account and project here.
Installation
Two of my favorite tools right now are Next.js and Bun, so I’ll use them to quickly setup a web application for demonstration purposes..
To create a Next.js application with Bun, run the following:
bunx create-next-app
Then, to get started with Highlight.io, install the npm package:
bun add @highlight-run/next
Next, we need to setup Highlight’s client instrumentation.
To initialize the client SDK, start by importing Highlight’s initialization component at the beginning of your root layout:
import { HighlightInit } from '@highlight-run/next/client'
Then just render the component inside your layout, before your html opening tag.
Make sure to replace <YOUR_PROJECT_ID> with your new highlight project ID:
<HighlightInit
    projectId={'<YOUR_PROJECT_ID>'}
    serviceName="my-nextjs-frontend"
    tracingOrigins
    networkRecording={{
        enabled: true,
        recordHeadersAndBody: true,
        urlBlocklist: [],
    }}
/>
With these steps, you’re all set to utilize Highlight’s observability features, including:
Session Replay
Error monitoring
Logging
Traces
Metrics
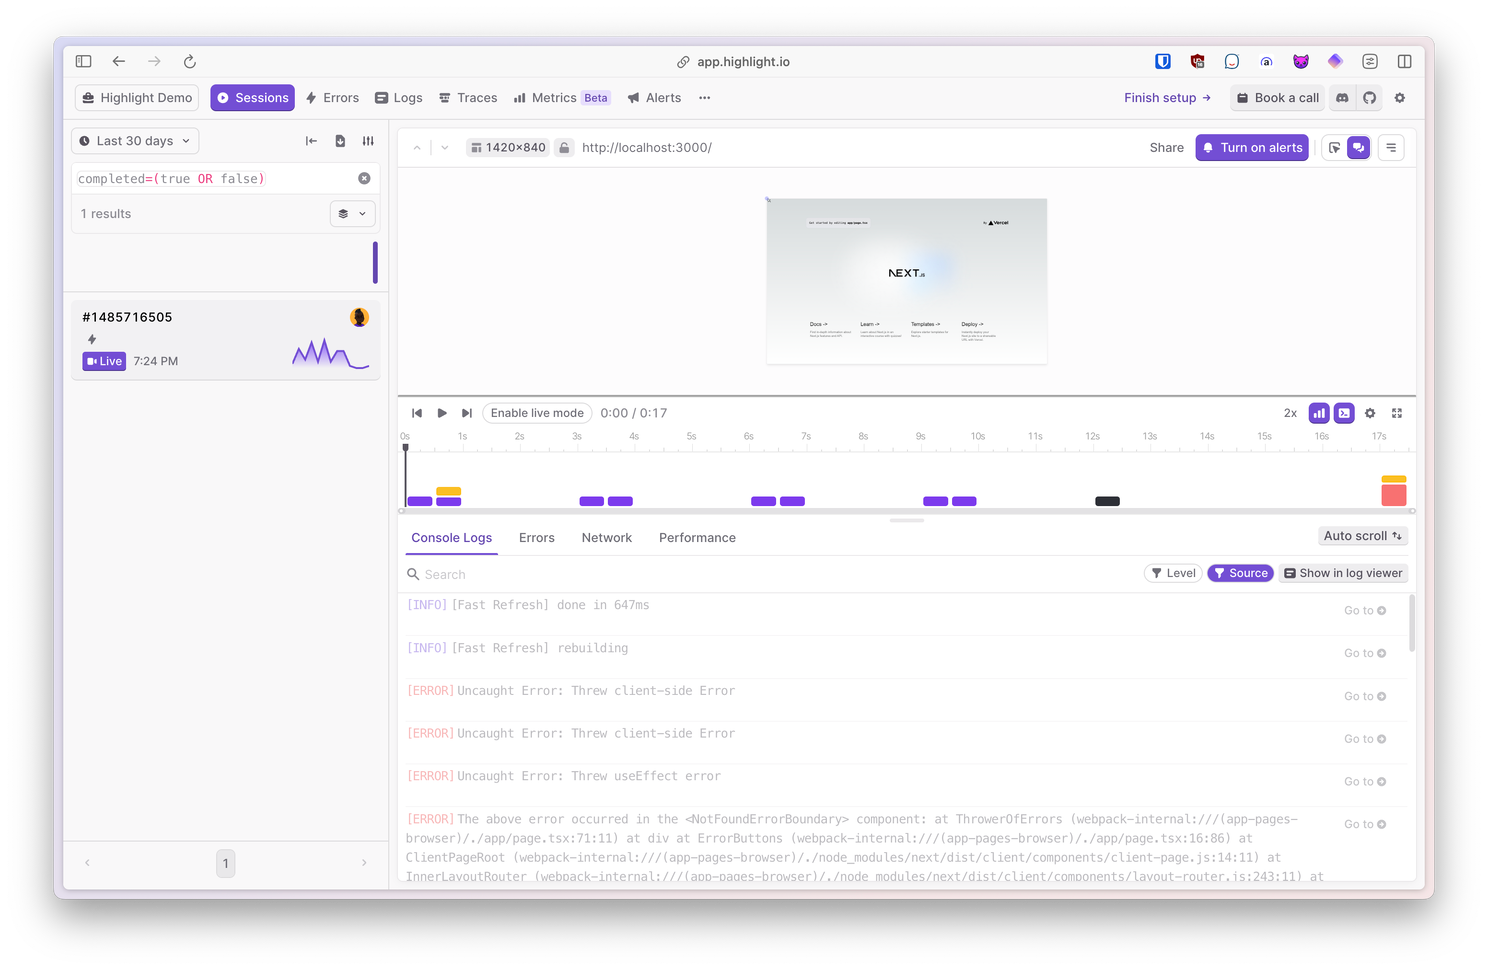
Session replay
Highlight’s session replay offers console and network recording, comprehensive session search, as well as privacy controls.
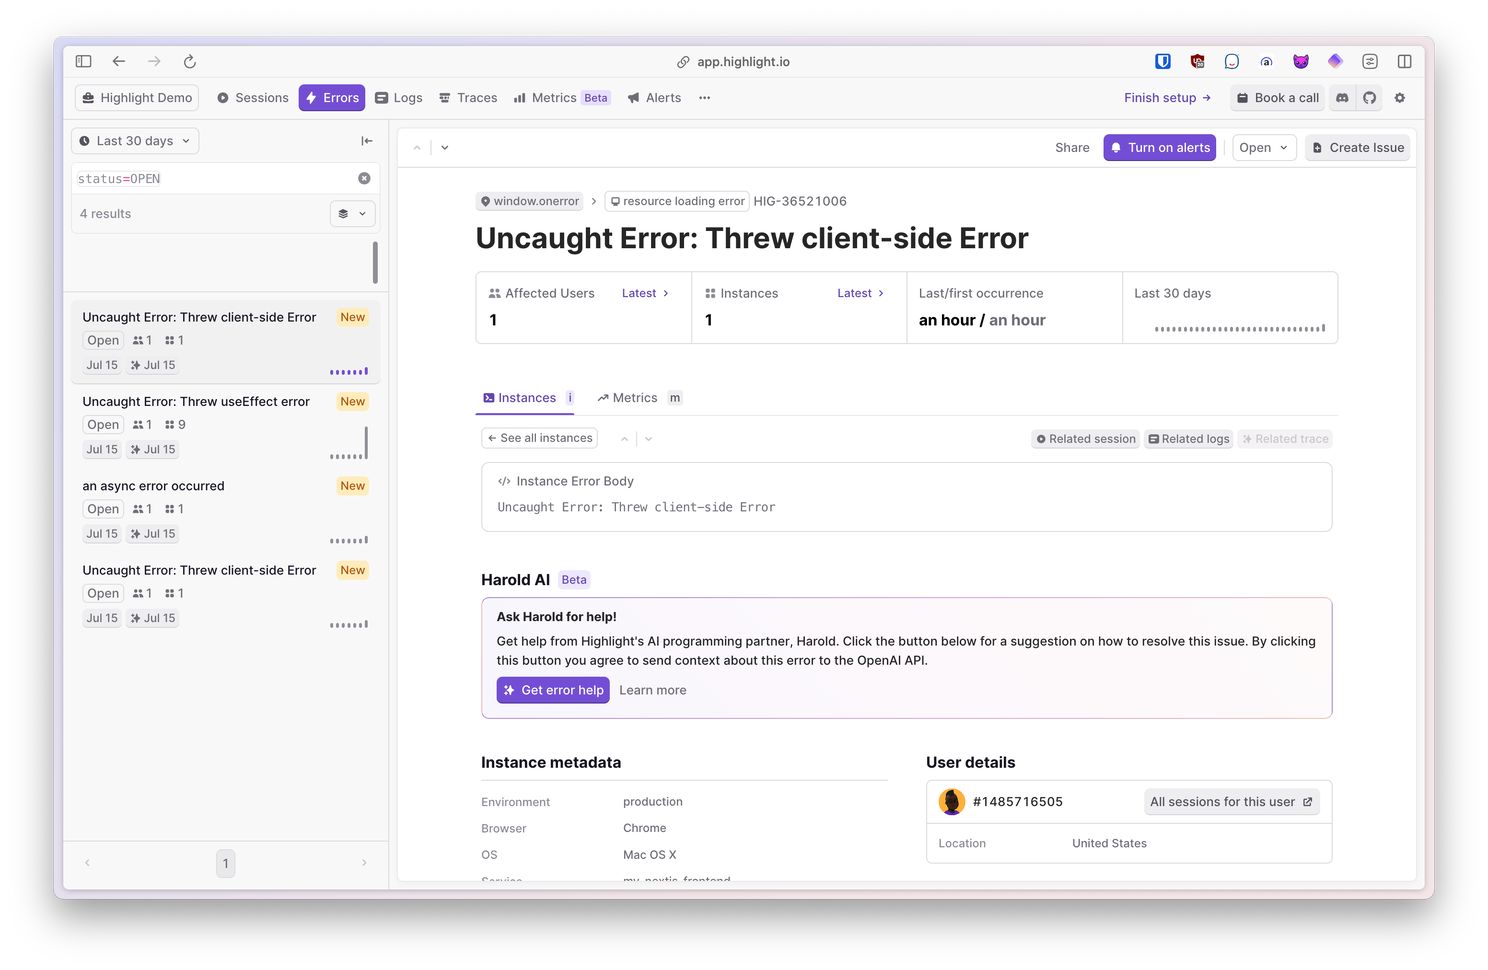
Error monitoring
With highlight’s error monitoring you get custom error grouping, and customizable alerting rules, all powered by Open Telemetry.
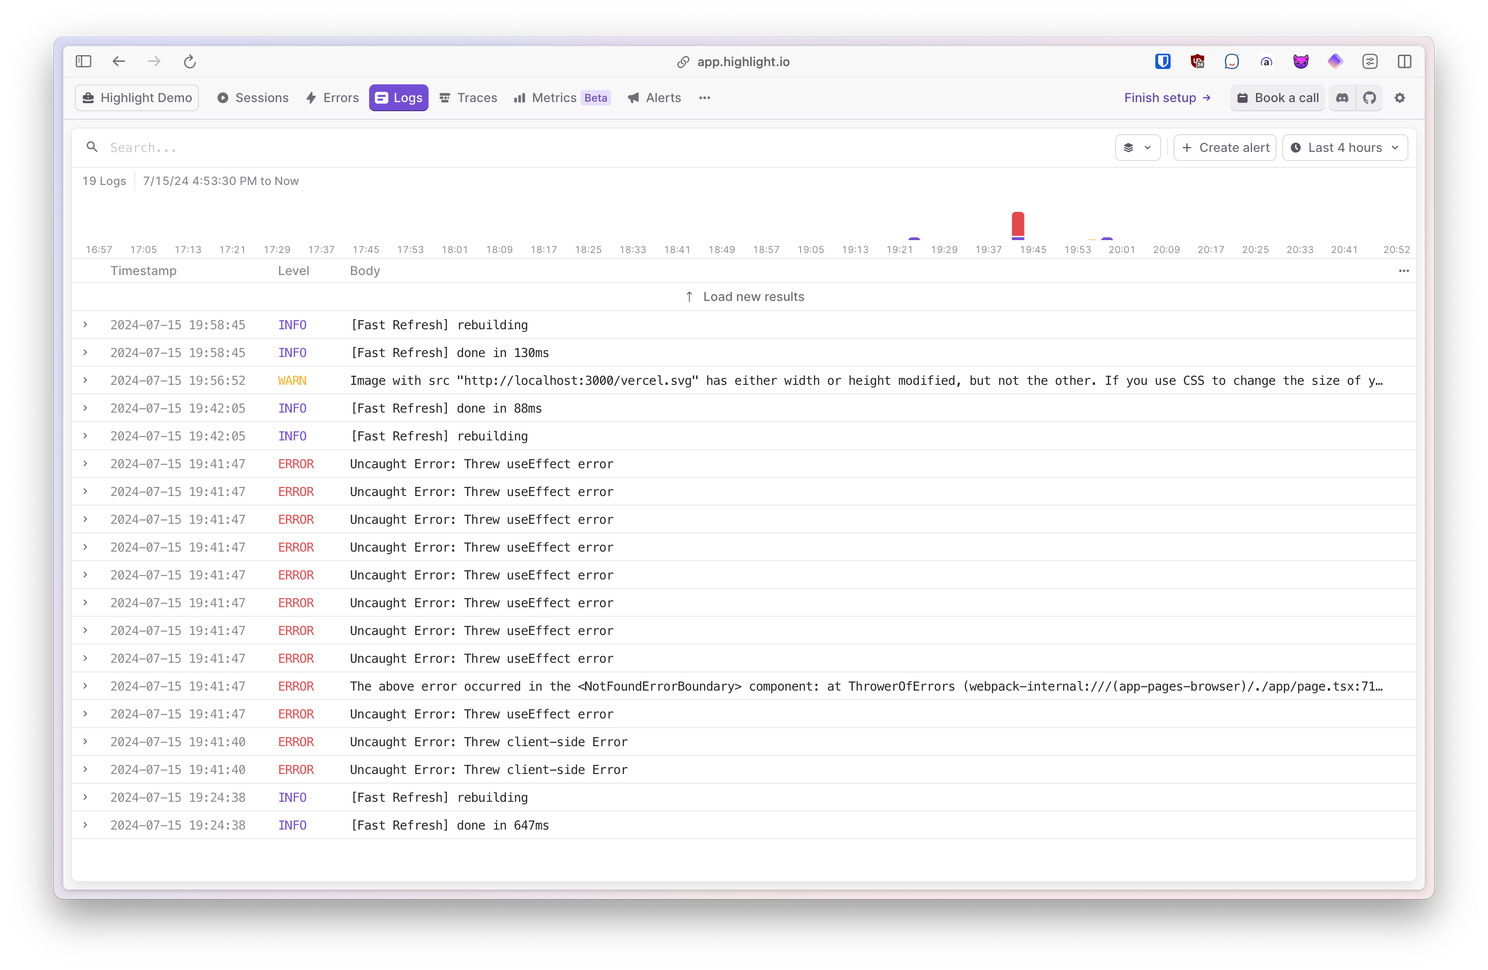
Logging
Using ClickHouse, a real-time data warehouse for o11y, you can search, filter, and configure customizable alerts with Highlight logs.
Traces
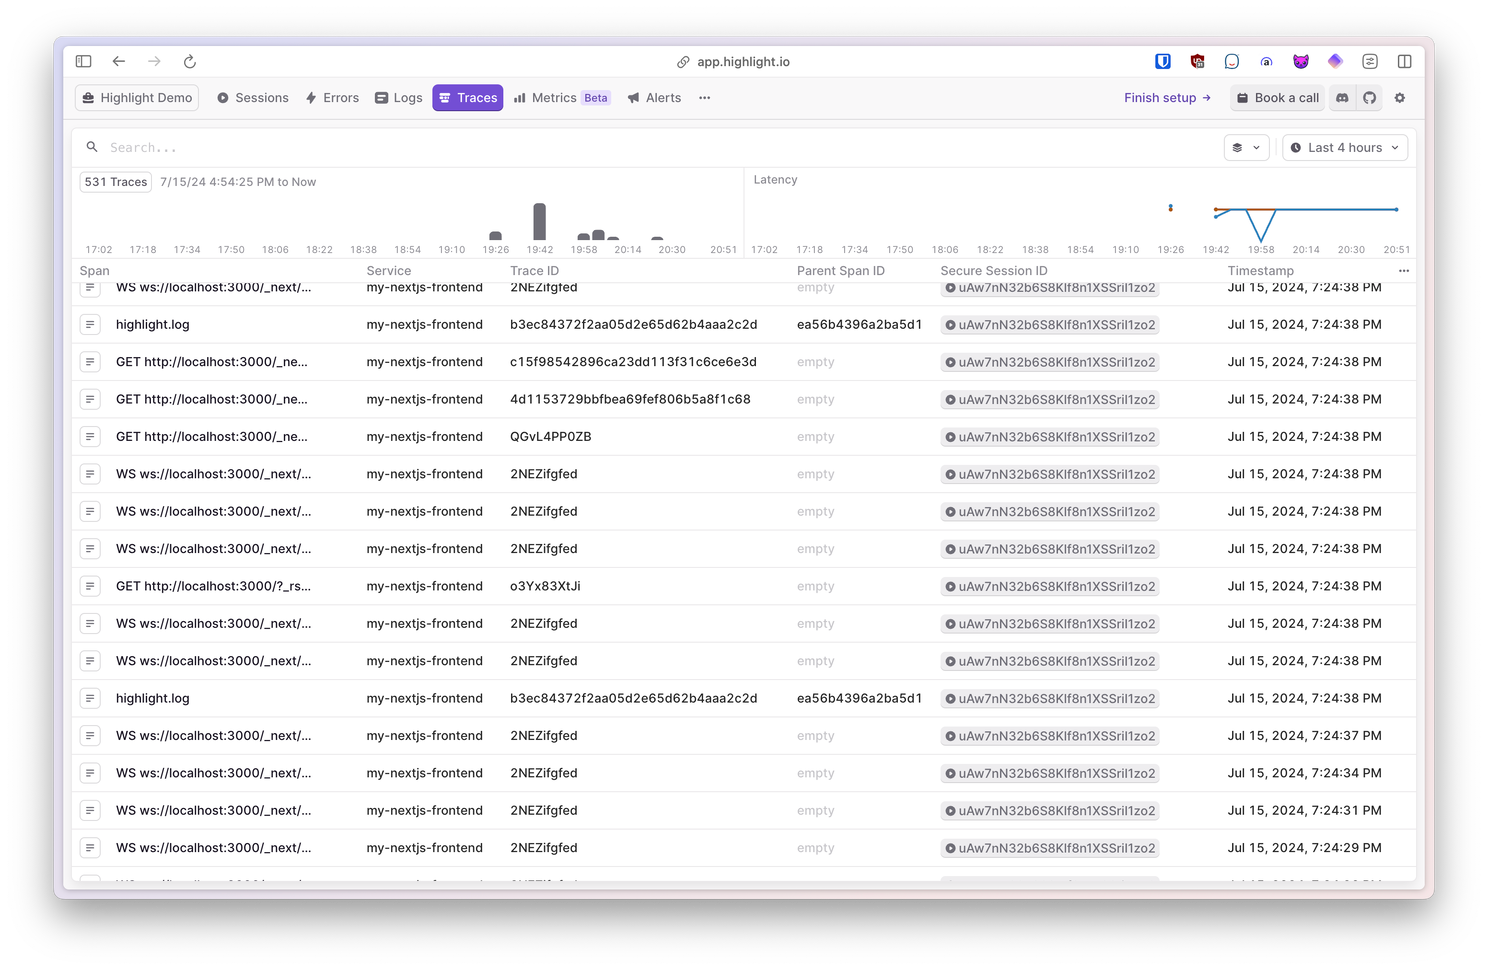
Highlight.io supports distributed tracing, and provides performance insights on all requests and transactions throughout your web application stack.
Metrics
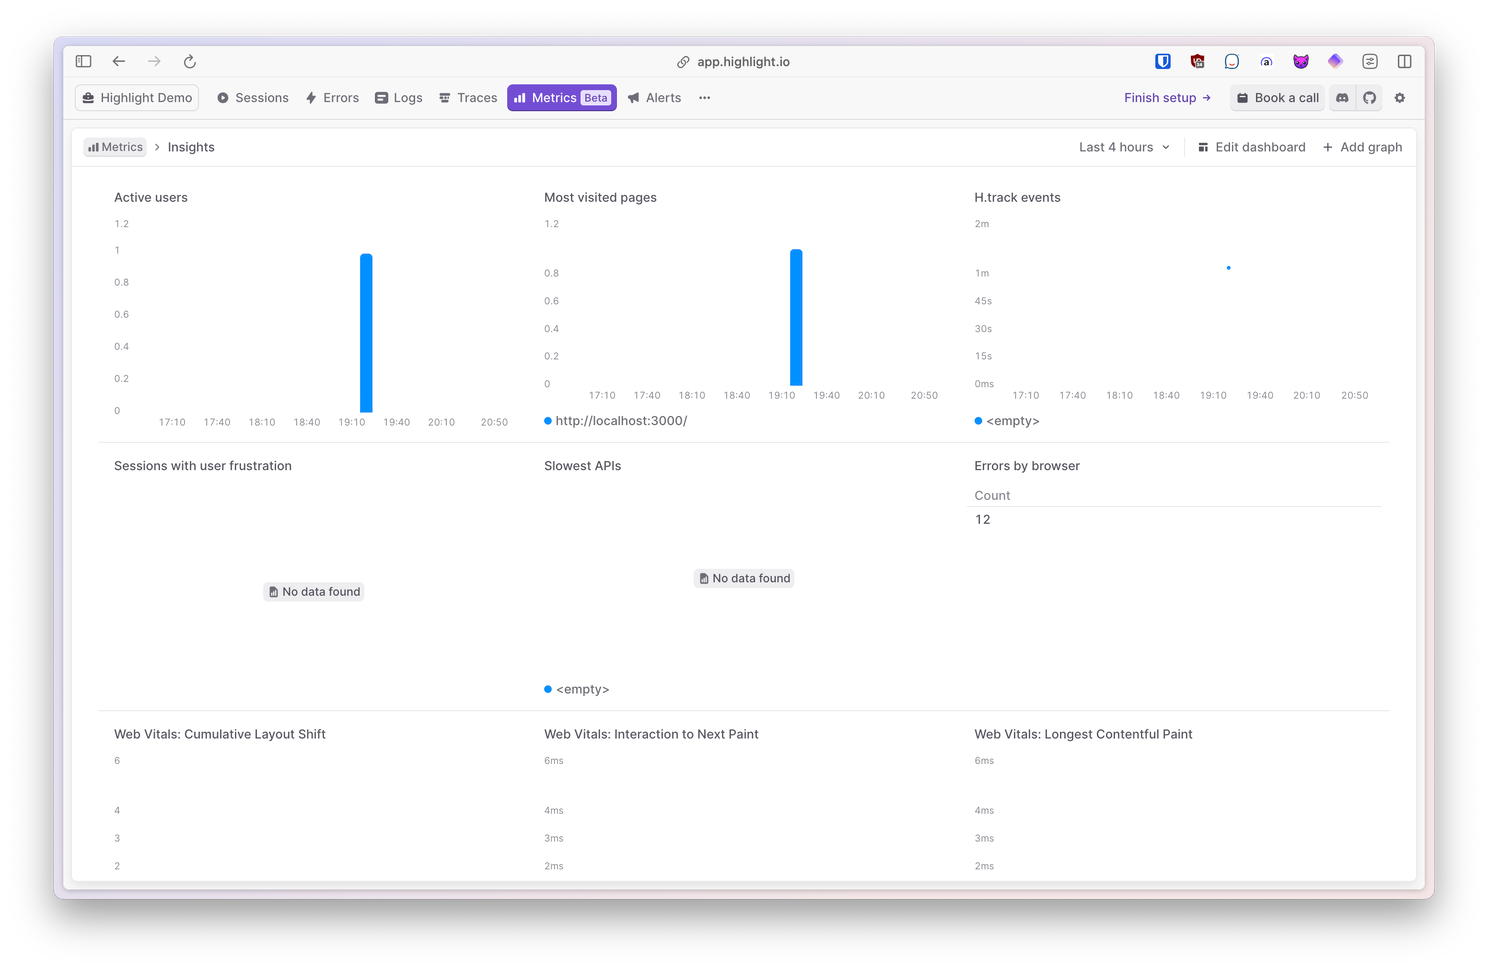
Lastly, you can see and analyze all of your o11y data from the metrics dashboard.
Wrapping up
I hope you found this article engaging and informative.
Understanding observability is crucial for maintaining and improving software systems. By leveraging metrics, logs, and traces, you can gain valuable insights into your system’s performance and health.
Thank you for reading, and feel free to share your thoughts or questions in the comments.
Subscribe to my newsletter
Read articles from Al Duncanson directly inside your inbox. Subscribe to the newsletter, and don't miss out.
Written by

Al Duncanson
Al Duncanson
Hi, I'm Al. Interested in web technologies, mathematics, and open source software. Occasionally I share things in writing.
