An Introduction to Prometheus for Effective DevOps Monitoring
 Vishwajeet Singh
Get to know about monitoring
Monitoring is an essential practice in DevOps. Through the use of diverse monitoring strategies and methodologies, developers can improve several aspects of a distributed system, including failure rates, error occurrences, the mean time to detect errors, and the mean time to resolve them. To gain a deeper understanding of monitoring and its significance in DevOps, let's explore an example.
Consider a distributed system, such as a microservices application, where each microservice depends on others. For example, the authentication service depends on the rate limiter service, which then connects requests to the database service, among others. If the database fails, developers need to determine the root cause of the issue to fix it. The problem could be in the frontend or the backend. Identifying the root cause might take a significant amount of time, during which the application remains down and inaccessible. Thus, it is crucial for developers to swiftly identify and address the root cause to minimize downtime.
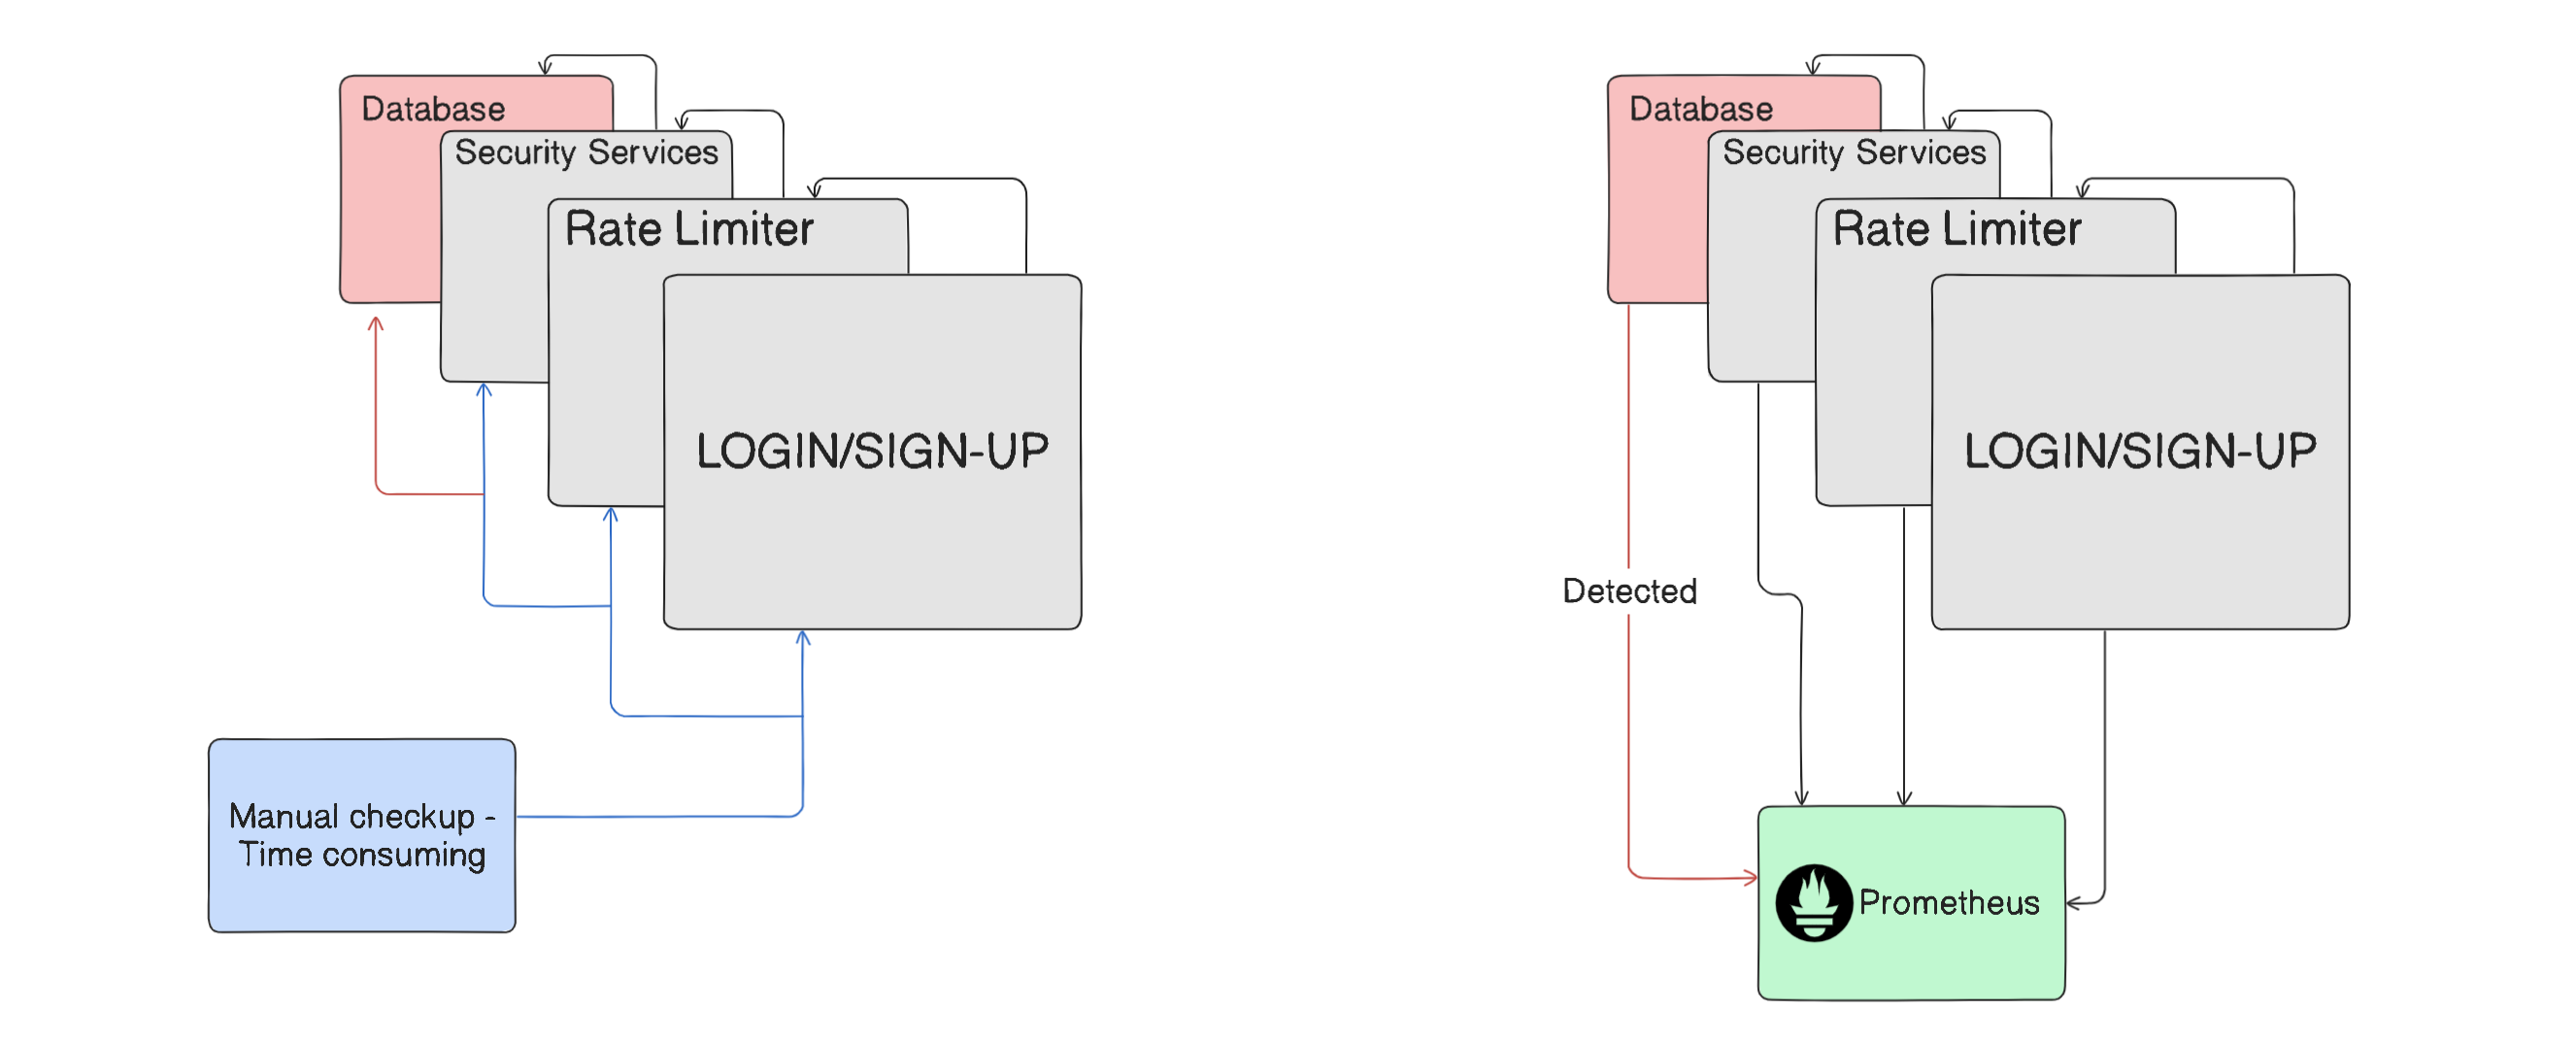
Without monitoring tools, developers would need to examine each event and component causing the problem. Wouldn't it be advantageous to have a tool that could pinpoint the exact point of failure or error? This would save significant time, reduce downtime, and minimize losses.
In distributed systems (microservices applications), numerous components can serve as potential points of failure. Monitoring tools are employed in these environments to oversee each component, enabling the precise identification of failure points either after a failure occurs or before it leads to a failure.
There are numerous monitoring tools available; however, today we will focus on Prometheus.
Prometheus
Prometheus is one the most popular monitoring tools and we will seek the reason for, why is it so popular. So let's get started.
Prometheus Server
Inside Prometheus tool itself we have Prometheus server, where all the monitoring work happens. The Prometheus server itself is comprised of three components -
Data Retrieval Workers
Metrics Database
HTTP server
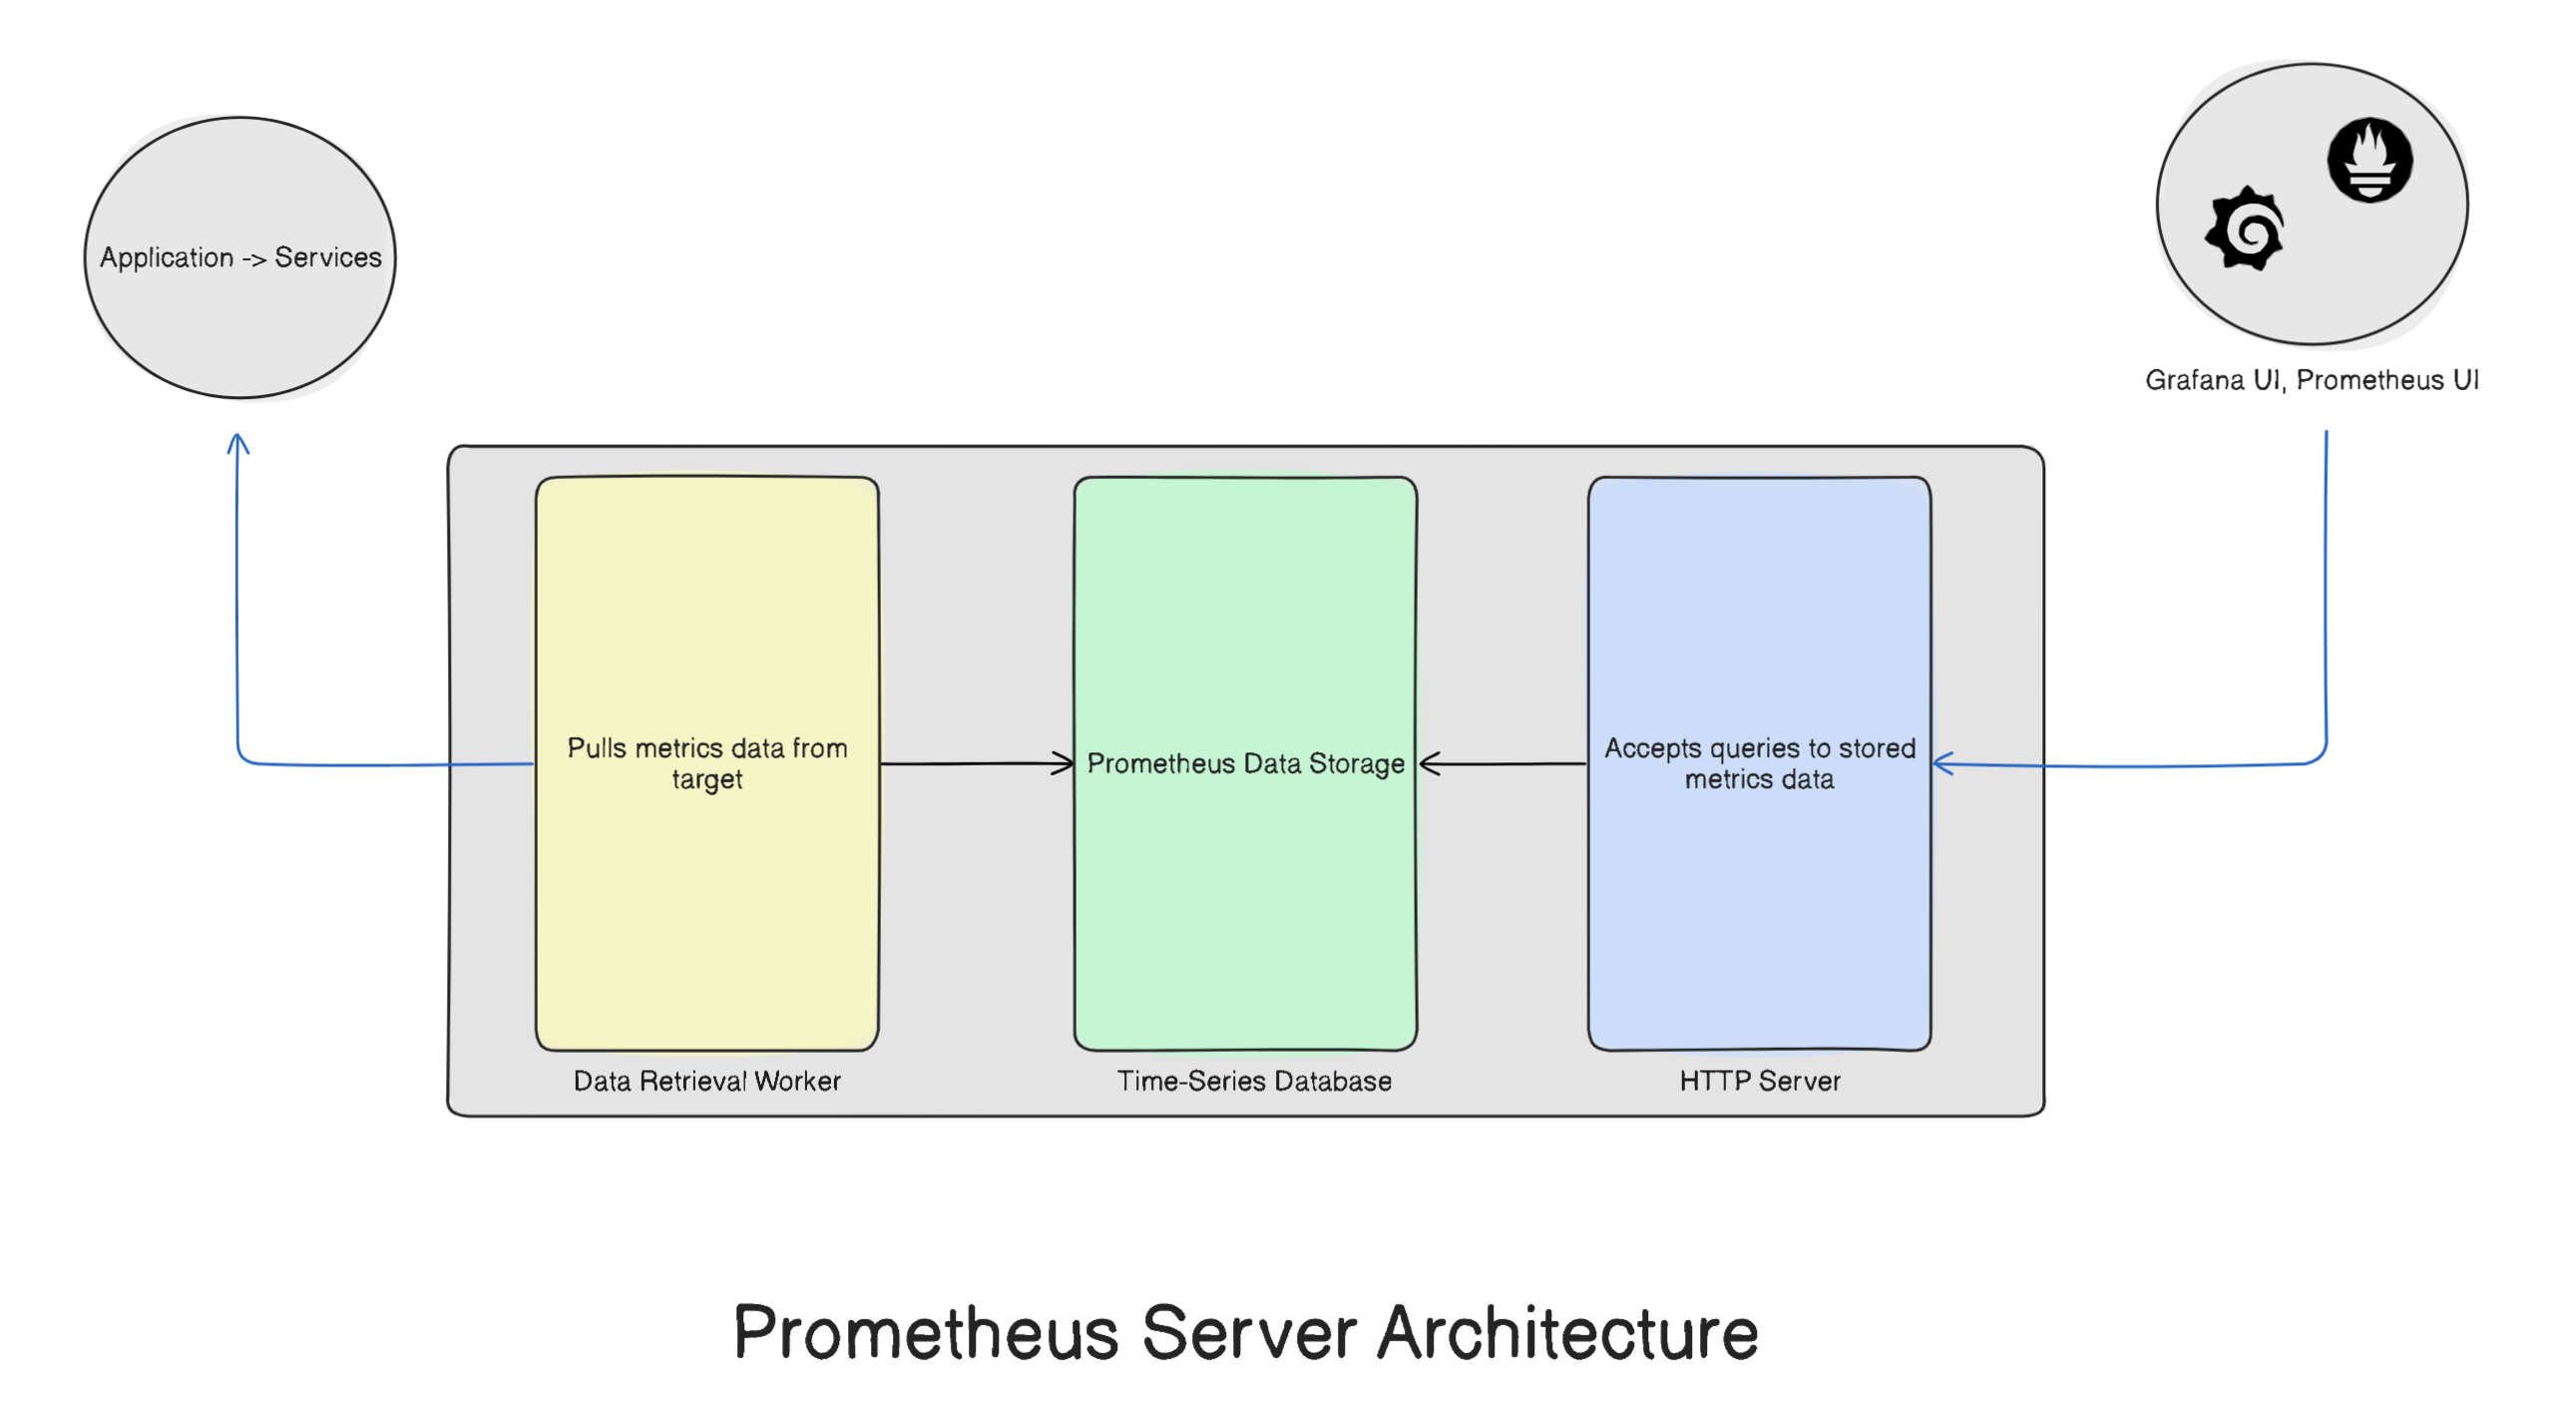
Let us understand each of these components in detail.
Data Retrieval Workers - For monitoring any system we need some units such as- CPU usage, Memory usage, Disk Usage, Network Usage etc.., these units are called metrics. The sources of these metrics or in simple terms the things monitored by Prometheus are called are called Targets. These target can be applications, services or even the server on which they are running.
But how do they collect these metrics from the target ??They do this by pulling metrics using HTTP endpoints. These endpoints are like any other HTTP endpoint for communication and are in format
hostname/metric. The targets will have an HTTP endpoint using which the workers will pull the desired metrics.Almost all the targets of Prometheus have an HTTP endpoint by default. But it might be possible that some targets don't have a default HTTP endpoint, such targets require additional configuration on order to be monitored. These extra configuration are called Exporters.
Exporters - These are scripts or services which pull metrics from the target and provide it in Prometheus understandable format to the workers. Exporters also have their own HTTP endpoints from which the workers pull the metrics collected by the exporter itself.
Metrics Database - Once the data retrieval workers start pulling metrics data they need to be stored somewhere in order to access it. For this purpose the second component of Prometheus is Metrics Storage.
Metrics Storage is Time series database that stores these data. Time series database is a database that store time stamped data e.g. Sensor readings, stock prices, Traffic on a website in a particular time frame etc..
These metrics are stored in a special format that isHELP-TYPE. HELP - It tells the description of metrics e.g. CPU utilization, Disk utilization. TYPE - tells the type of metric.Types of metrics - There are 3-different types if metrics in Prometheus which are as follows :
Counter TYPE - This metric type tells how many times 'x' has happened. 'x' can be an event.
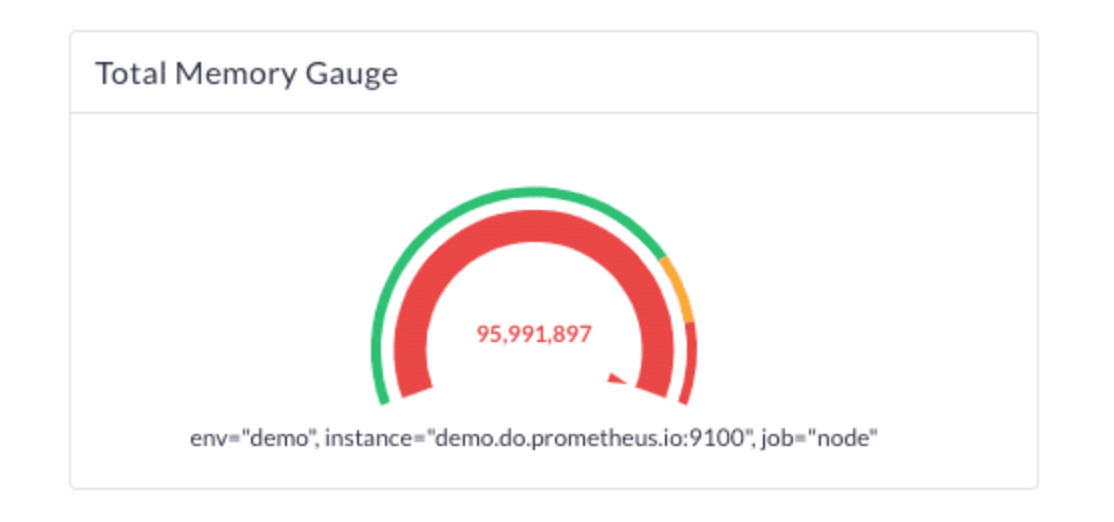
Gauge TYPE - This metric type tells how the current value of 'x'. For example - current value of CPU usage, Disk usage etc.
Histogram TYPE - This metric type tells how long or big 'x' is/was. For example - how long 'x' was online.
HTTP server - In order to access the stored metrics data through Data visualisation tools such as Grafana, Prometheus UI we have HTTP server which allows communication between the metrics database and tools.
PromQL
A query language is necessary to access any database, and similarly, the metrics time series database within the Prometheus server requires its own query language, known as PromQL. Both visualization tools utilize PromQL to function effectively.
Exporters
For Prometheus to collect metrics from target, the target needs to have an endpoint and a lot of them do have by default. Sometimes they don’t, in such case an extra configuration is required to get metrics from such targets. These extra configurations are called exporters.
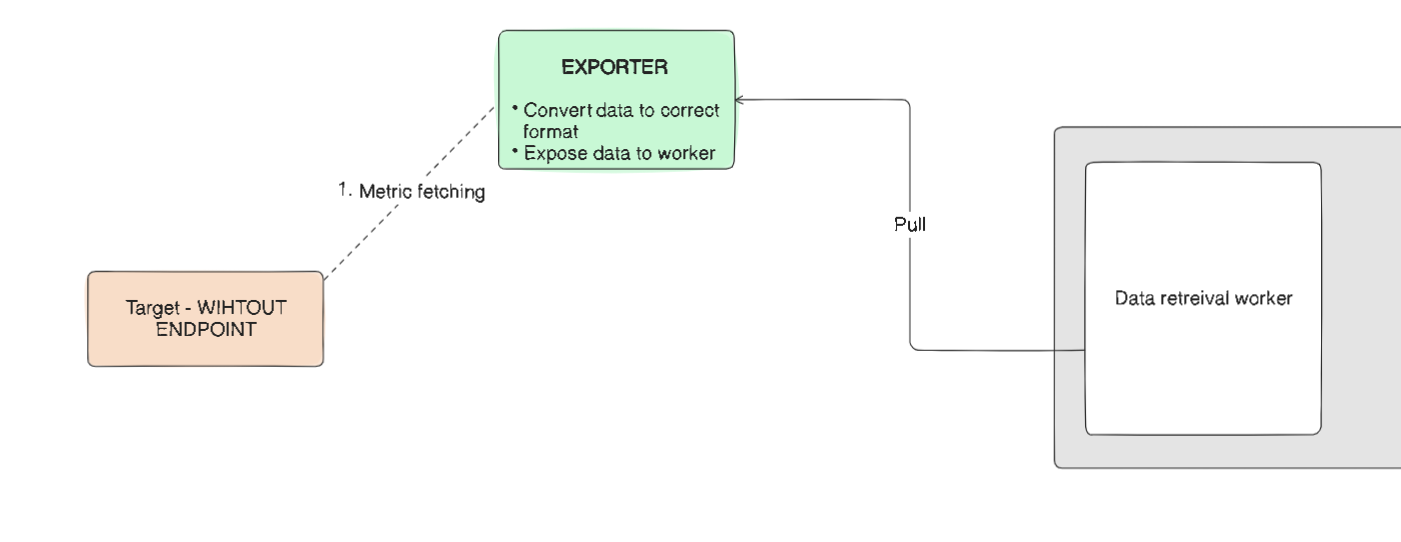
Exporters are scripts/services which pull the metrics from the target and provide to Prometheus in a compatible format.
Why Prometheus is unique ??
Targets can be monitored using two mechanisms:
Push Mechanism - In this method, targets send their metrics data directly to the monitoring tool.
Advantages:
Real-time data: Metrics are sent in real-time, enabling immediate alerts.
Efficient: Reduces the load on the monitoring system as data is sent only when necessary.
Scalable: Capable of handling large volumes of data from multiple targets.
Disadvantages:
Complex setup: Requires a push agent on each target or an API, which can complicate setup.
Data overload: Without proper filtering, it can lead to data overload.
Network hotspots: In highly distributed systems, it can cause network congestion as multiple services continuously push metrics, consuming more network bandwidth. This can make monitoring a bottleneck in system design.
Security issues: There are potential security risks if not properly authenticated.
Pull Mechanism - Here, the monitoring tool retrieves metrics data from the target, addressing many of the push mechanism's shortcomings.
Advantages:
Simple setup: Easy to configure with minimal setup required.
Control: The monitoring system controls when data is collected.
Security: Reduced security risks as data is only retrieved when needed.
Disadvantages:
- Delayed data: Data retrieval can be delayed as it occurs at defined regular intervals.
Prometheus uses pull mechanism making it unique while its alternatives such as Amazon Cloud Watch, Sentry, Datadog, Atera etc. use push mechanism
Pushgateway
In certain situations, some jobs do not need the pull mechanism because it is unnecessary. For these cases, Prometheus offers the Pushgateway. This allows short-lived jobs to push their metrics reports to the gateway, enabling the data retrieval worker within Prometheus to pull the data from there.
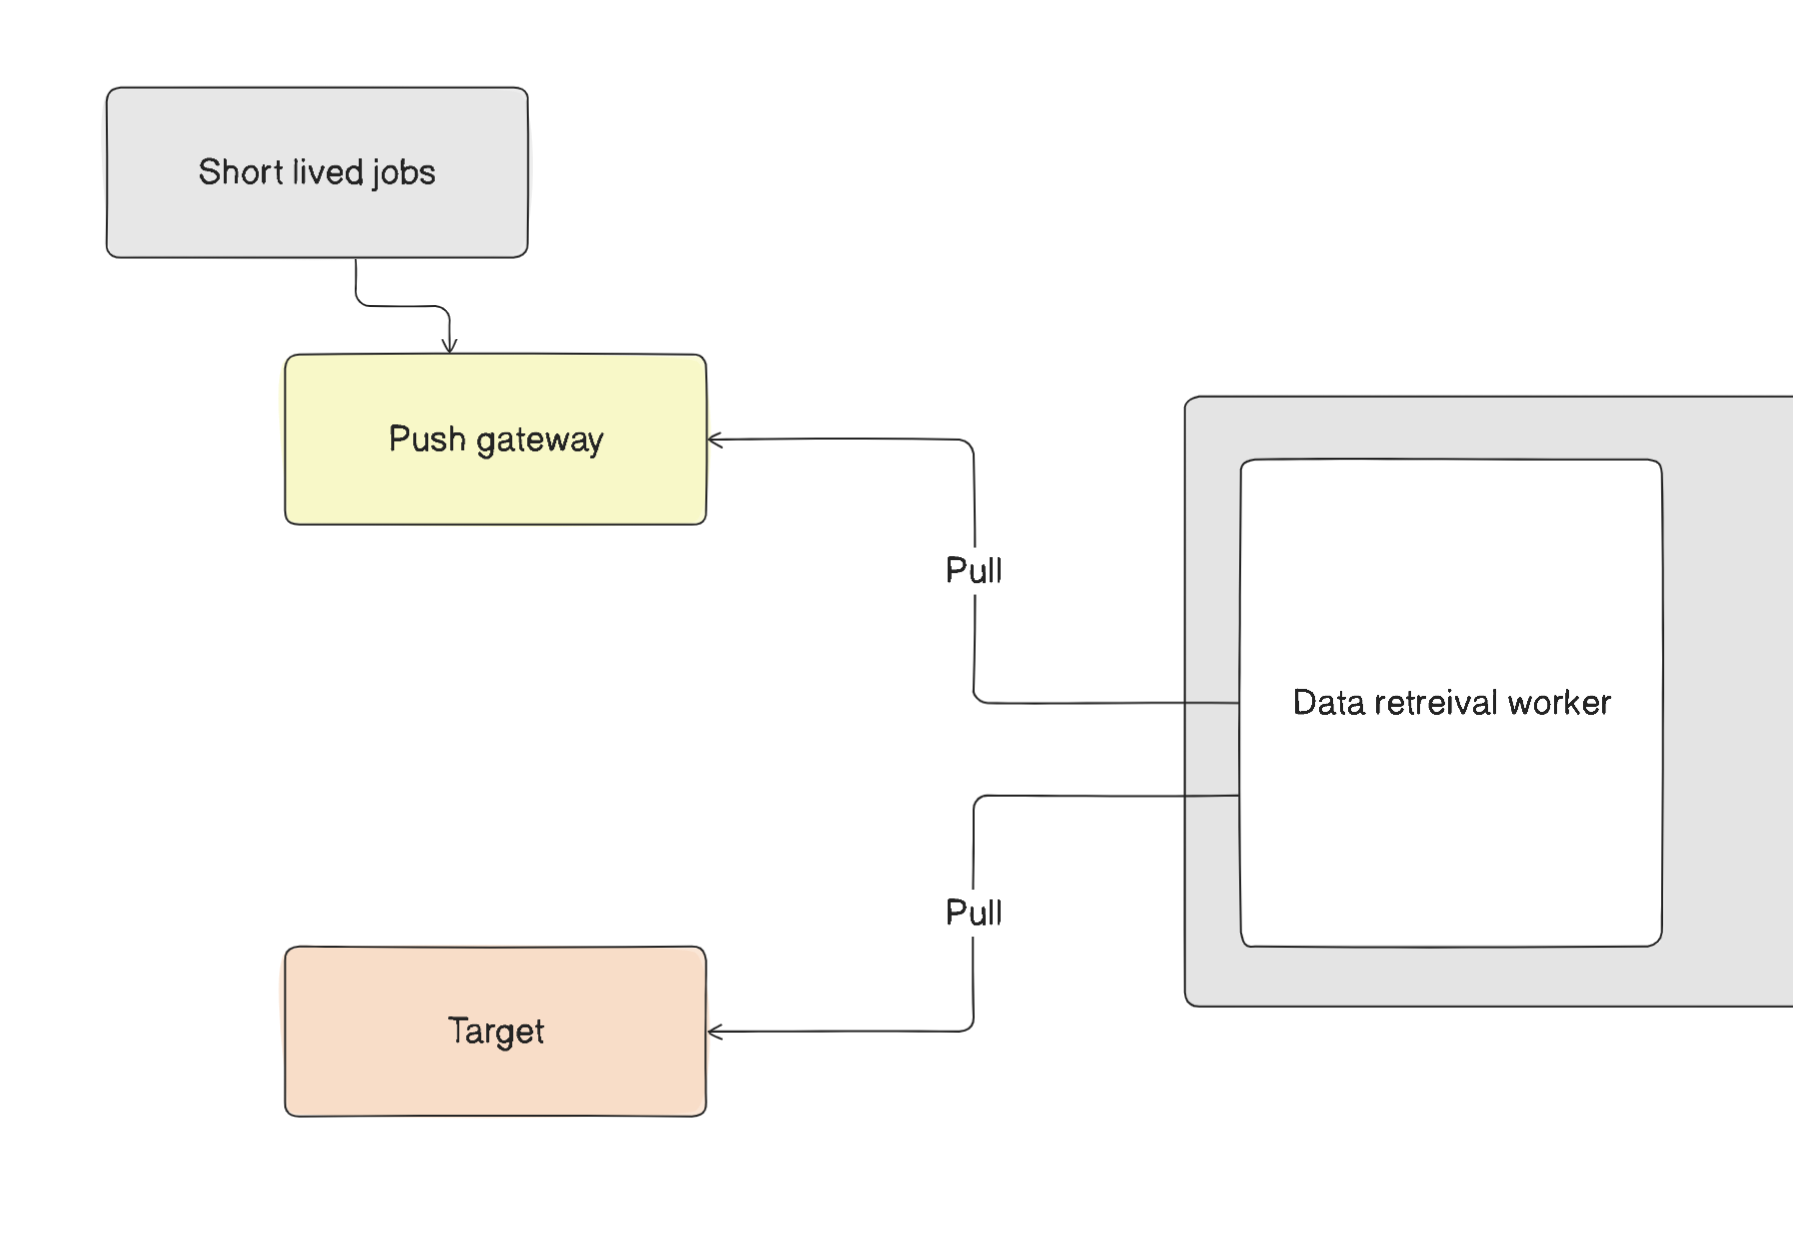
But wait!! How does Prometheus know what to scrape and when??
Prometheus needs a target and a time to scrape the metrics. For this, Prometheus provides users with a configuration yaml file called prometheus.yml. Prometheus uses a service discovery mechanism to find targets. It can automatically discover targets by integrating with various service discovery tools like Consul, DNS, Kubernetes, etc. This allows Prometheus to monitor dynamic infrastructure without manual intervention.
Configuring Prometheus
Now that we have a project to monitor, the question arises: how do you define what Prometheus should monitor and how often? This is where Prometheus configuration comes into play. In this section, we will provide a straightforward overview of how to set up Prometheus in your working environment.
The different configurations—Global, rule_files, and scrape—are sections within the Prometheus configuration file, typically named prometheus.yml. These sections define global settings, rules for alerts and recording, and scrape configurations for data collection targets.
Global configuration: The Global configuration in prometheus.yml sets defaults that apply throughout the file unless explicitly overridden in a specific scrape configuration. This includes settings like the scrape interval, which determines how often Prometheus will collect data from the targets. This interval can be overridden for specific targets in their individual scrape configurations.
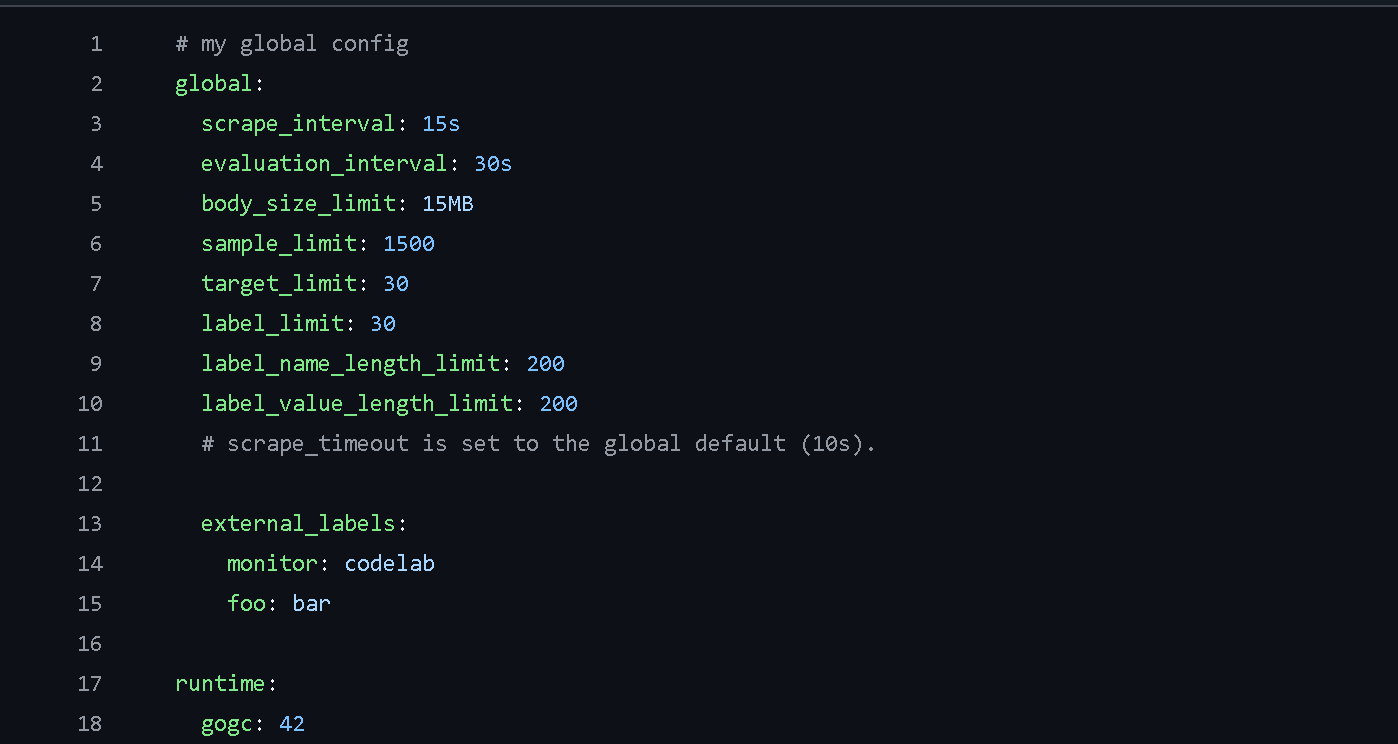
rule_files configuration: The rule_files configuration in Prometheus specifies one or more rule files that Prometheus will load and evaluate. These rules can be used for aggregating metric values or creating alerts based on certain conditions. The evaluation interval for these rules is defined in the Global configuration, determining how often Prometheus will check the rules against the current metric data.
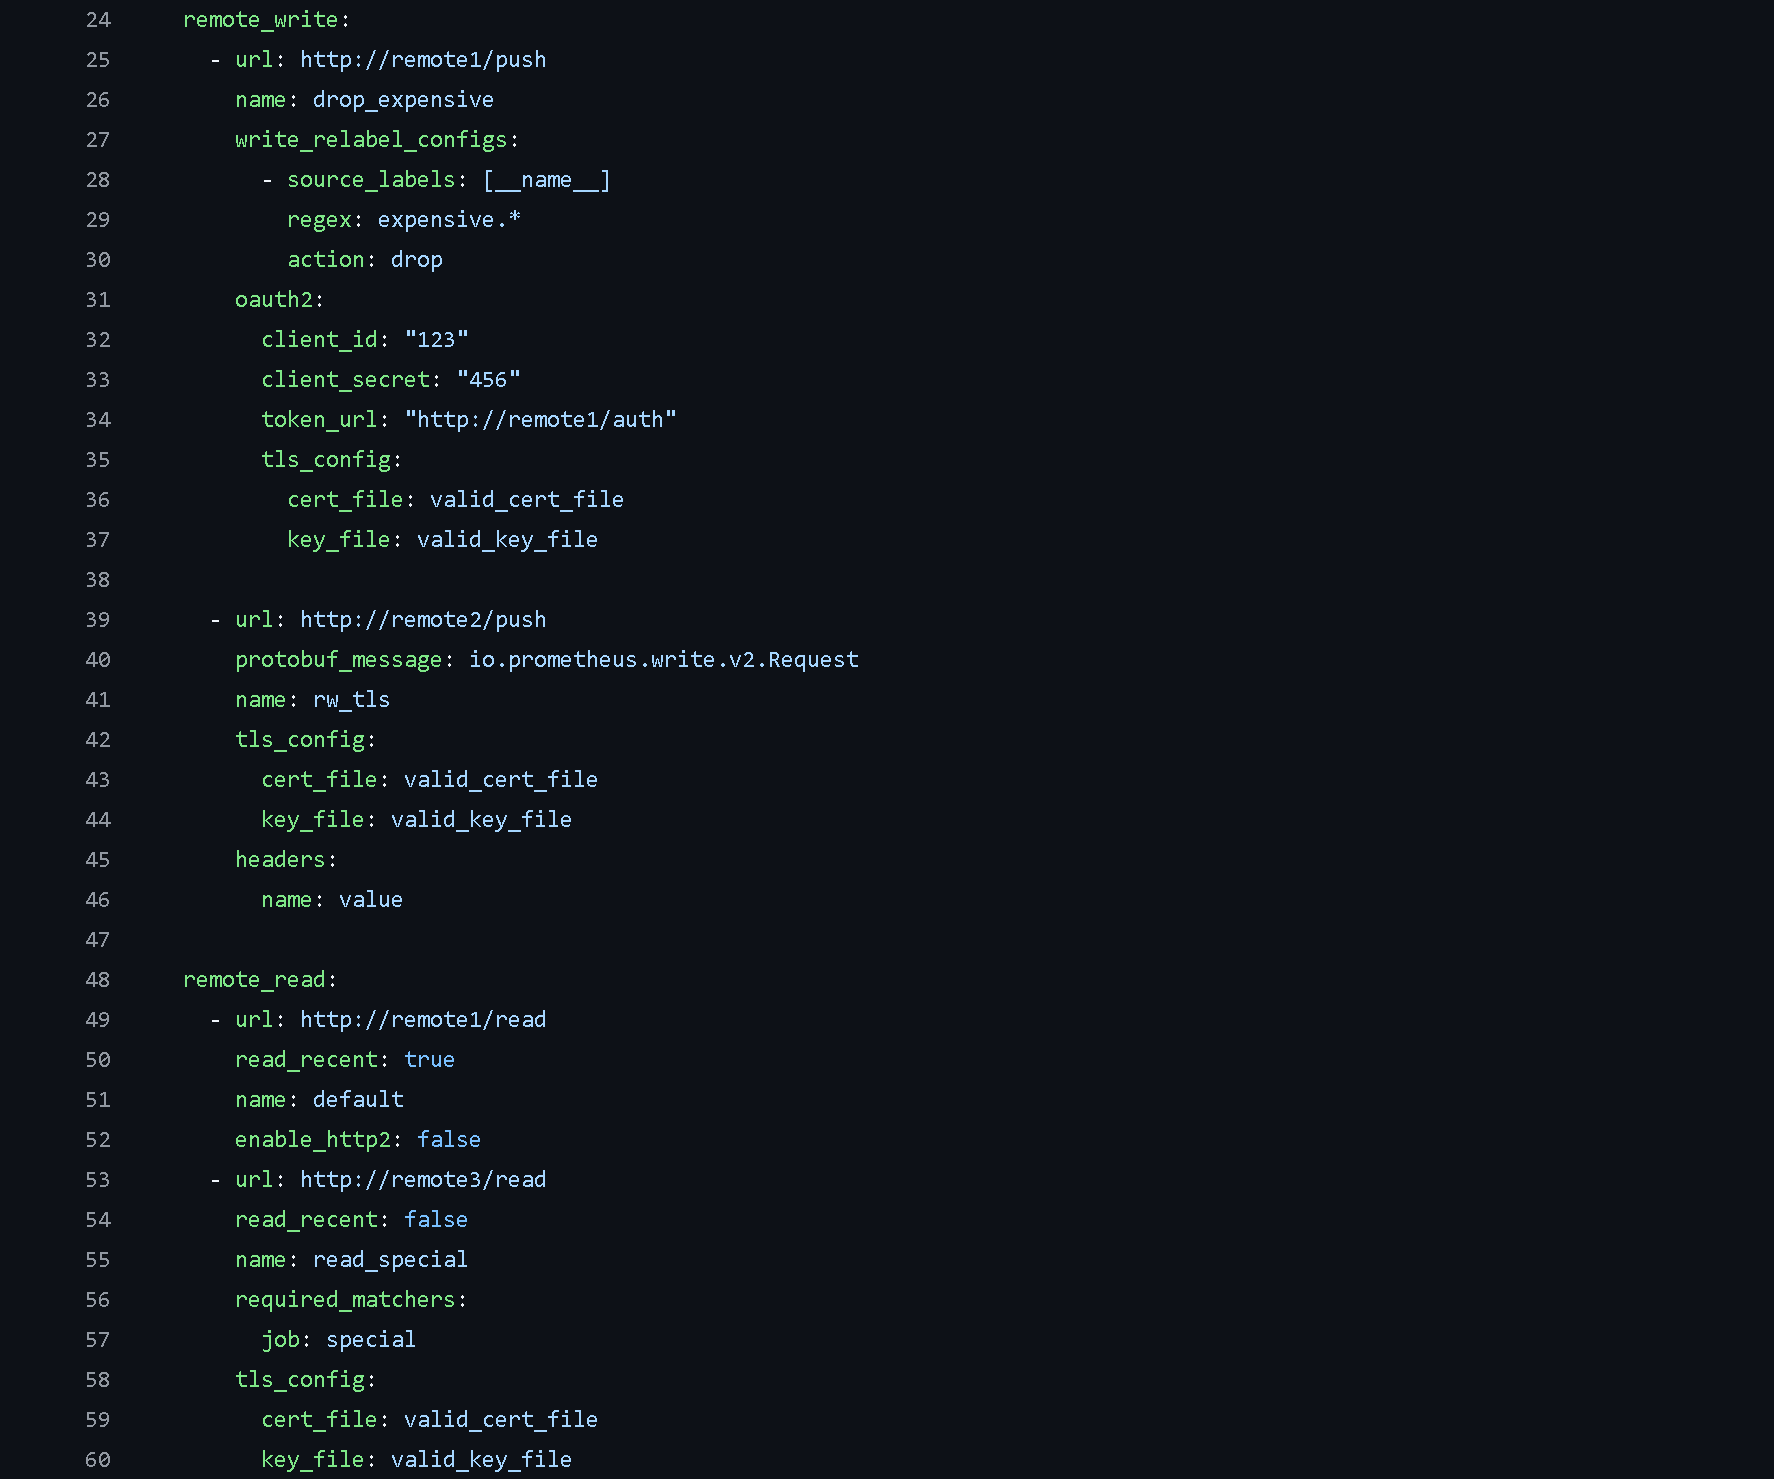
Scrape Configuration - This section specifies the targets that Prometheus needs to collect data from. Prometheus includes its own /metrics endpoints, allowing it to monitor its own performance.
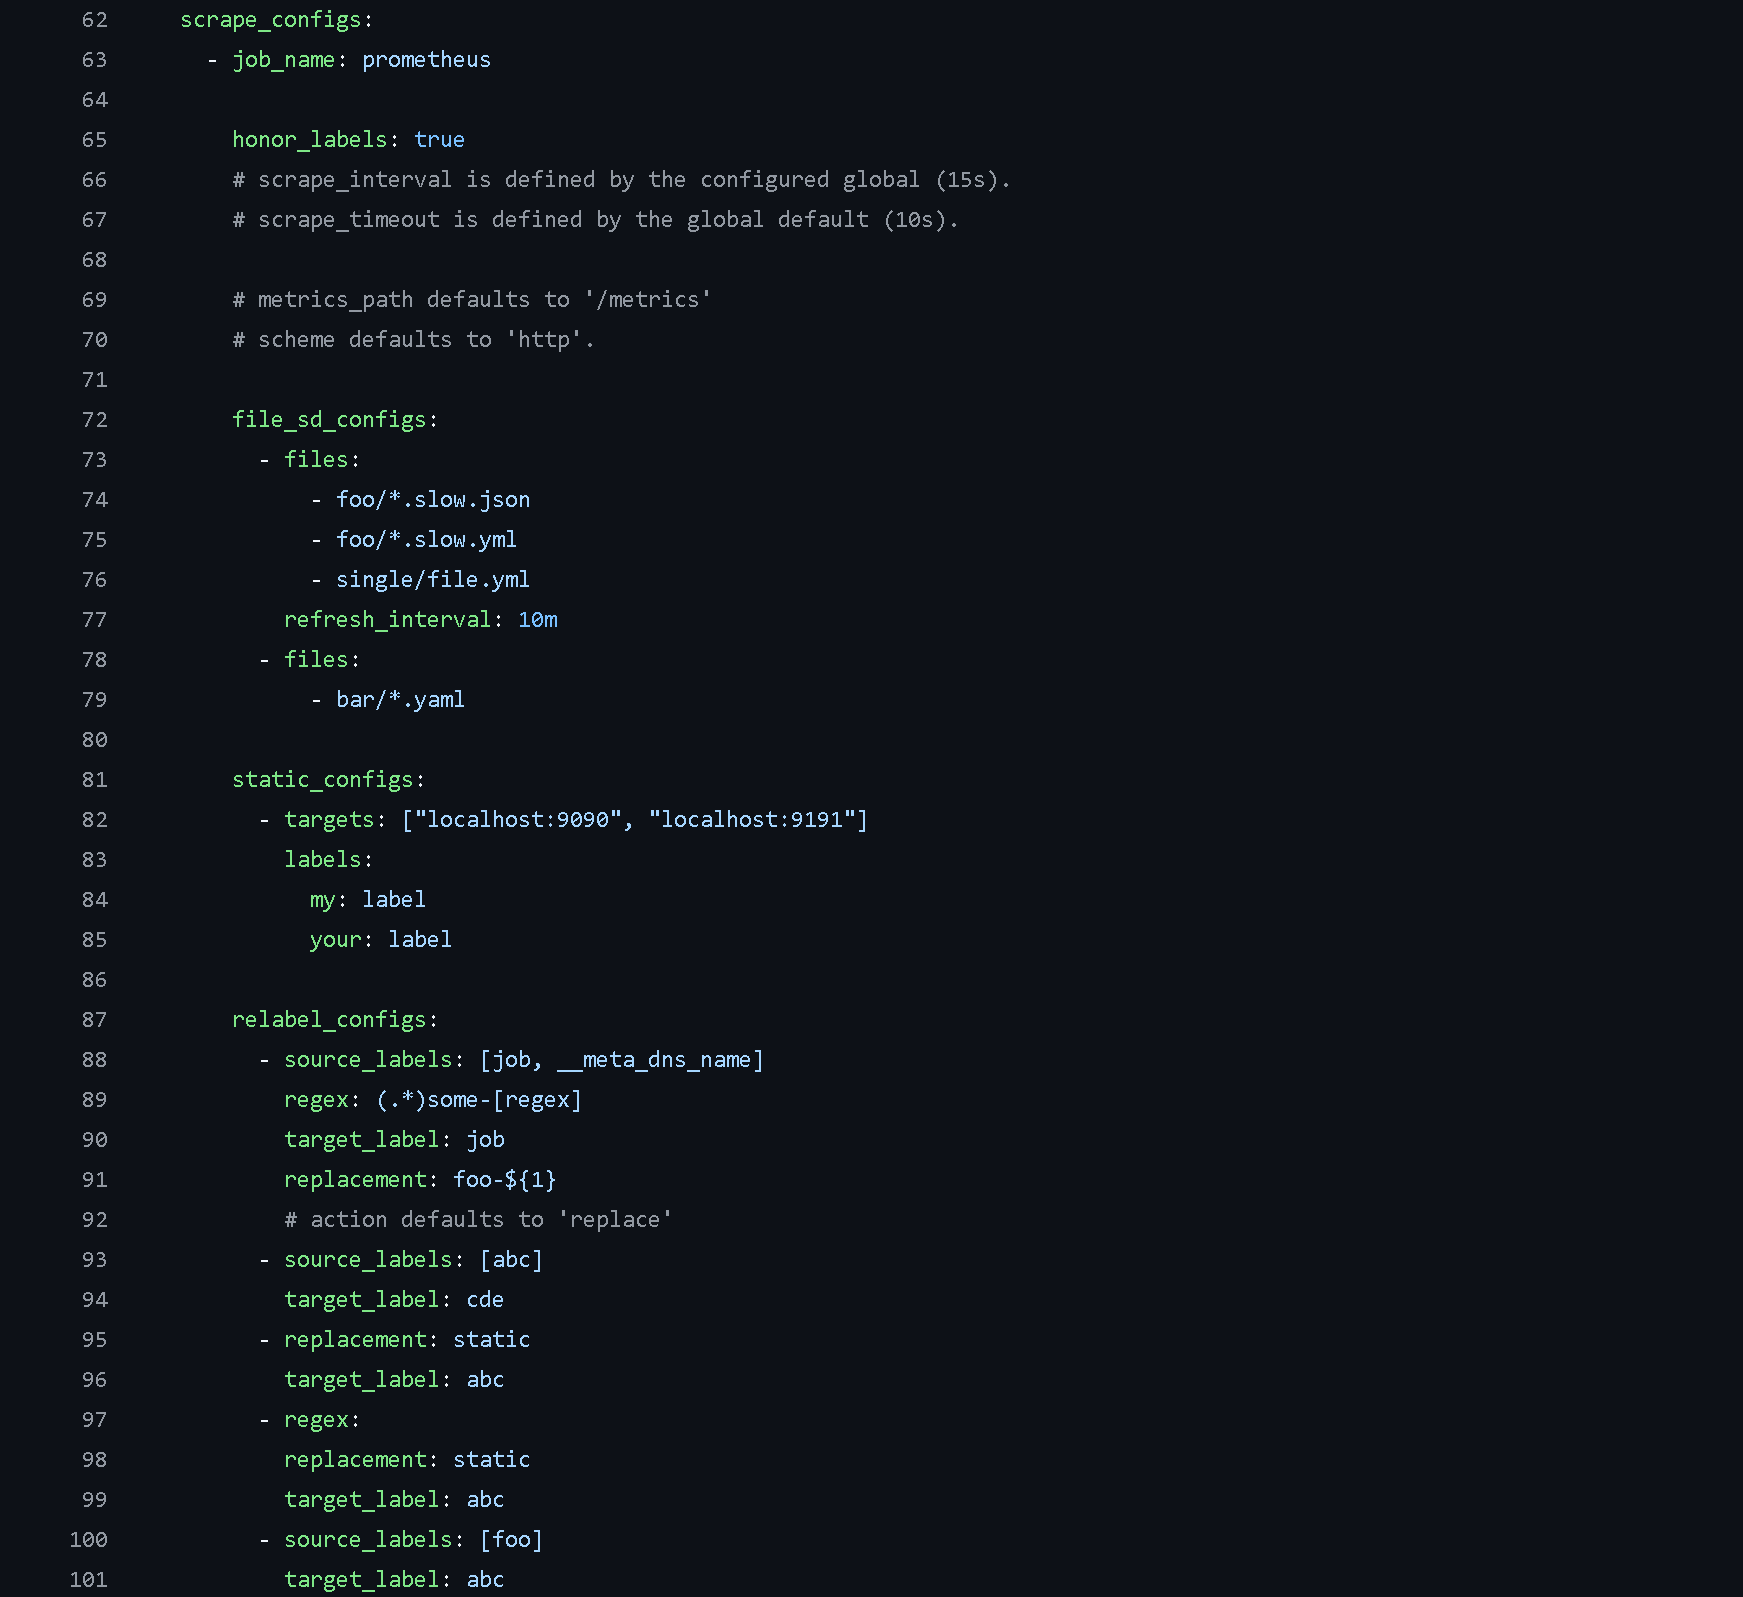
Defining Custom Jobs - In Prometheus, you can define custom jobs to add extra functionality. This involves specifying the job and setting up all the necessary configurations as outlined above.
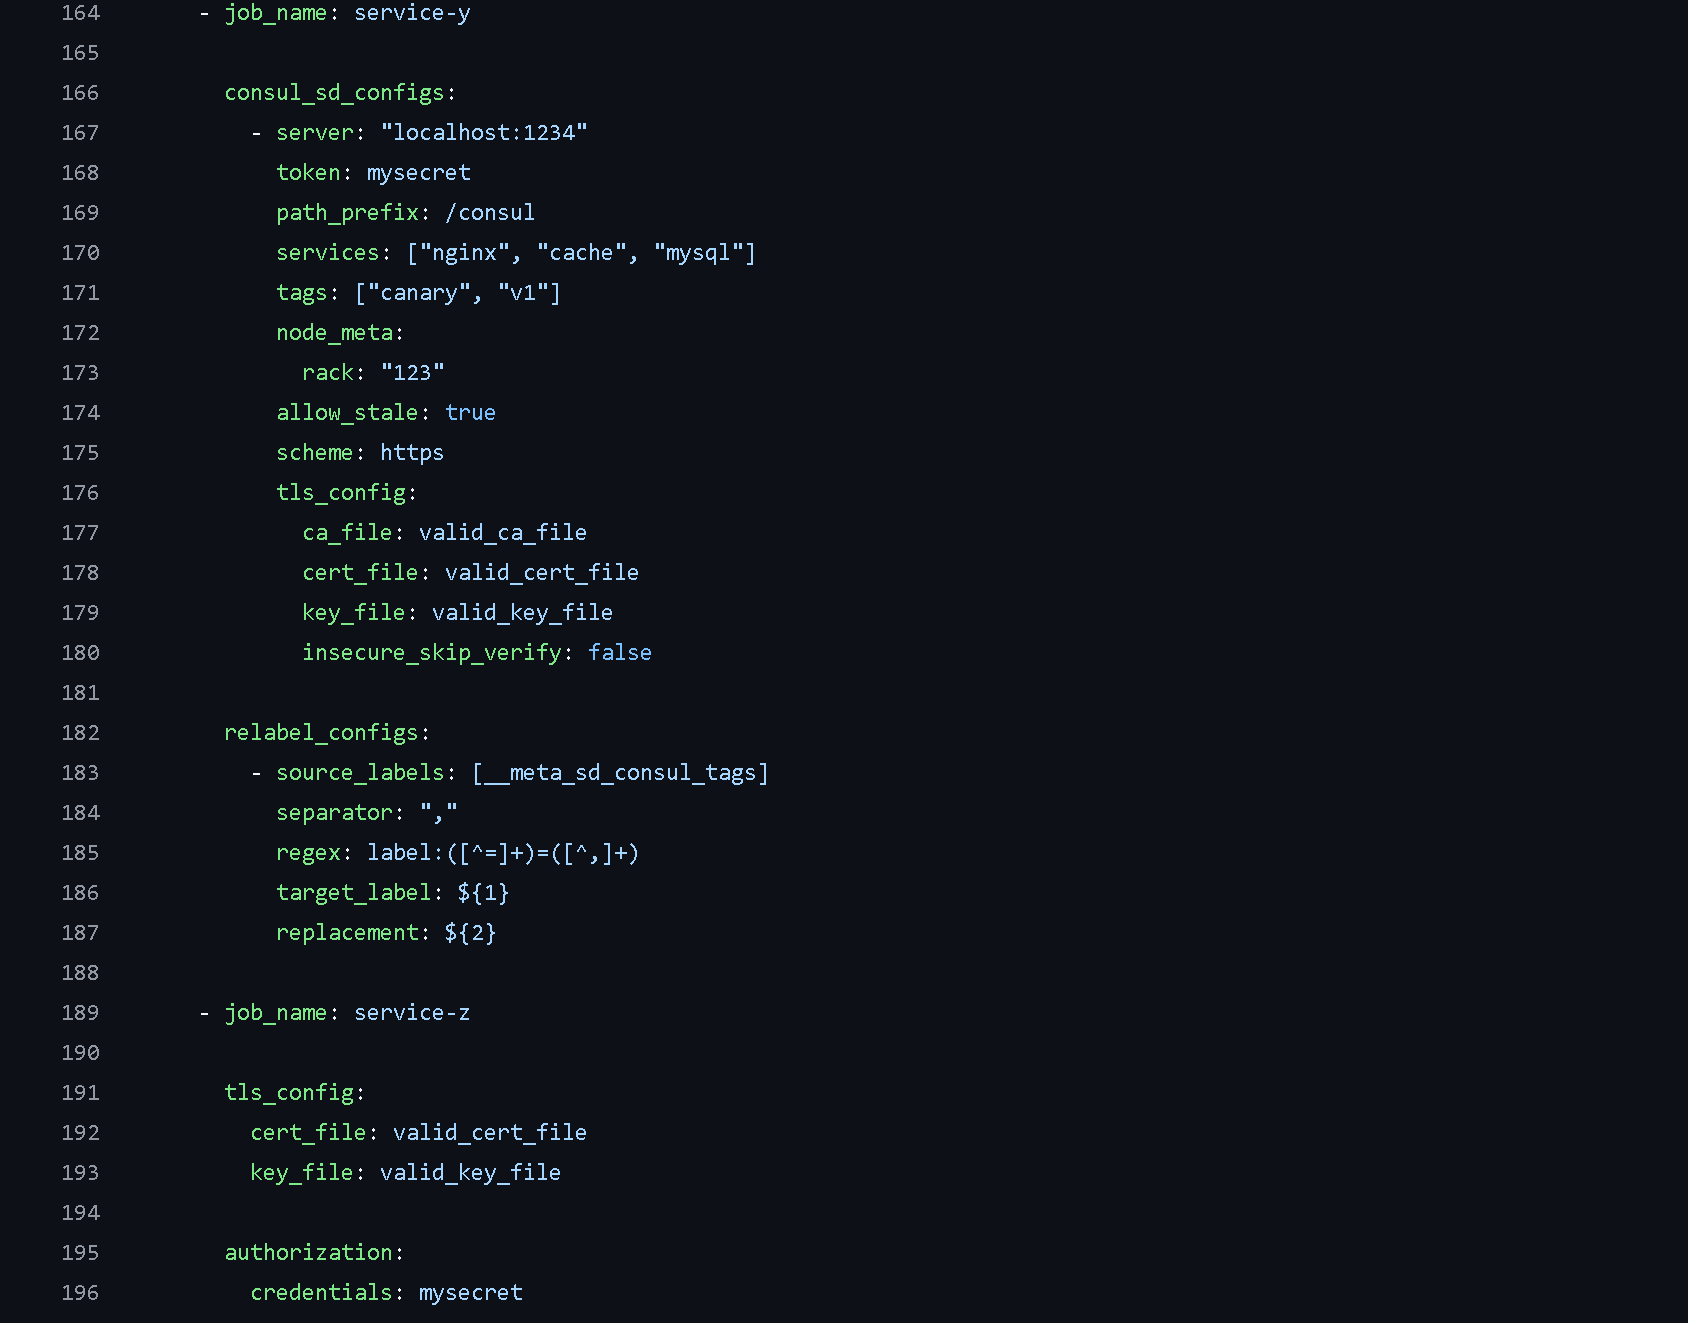
You can view this example configuration from Prometheus’s documentation.
Alert manager
Alert Manager is a component of the Prometheus monitoring system responsible for managing alerts. When Prometheus identifies that specific conditions are met, such as a metric exceeding a defined threshold, it generates an alert. This alert is then forwarded to Alert Manager, which can execute various actions based on the alert, including sending notifications through email, Slack, or other communication channels. Alert Manager also offers features for grouping, silencing, and acknowledging alerts.
Prometheus Data Storage
Once the metrics data is collected it needs to stored somewhere, that is Prometheus data storage. This storage can be local or remote. The collected metrics data is stored in custom Time-Series Format.
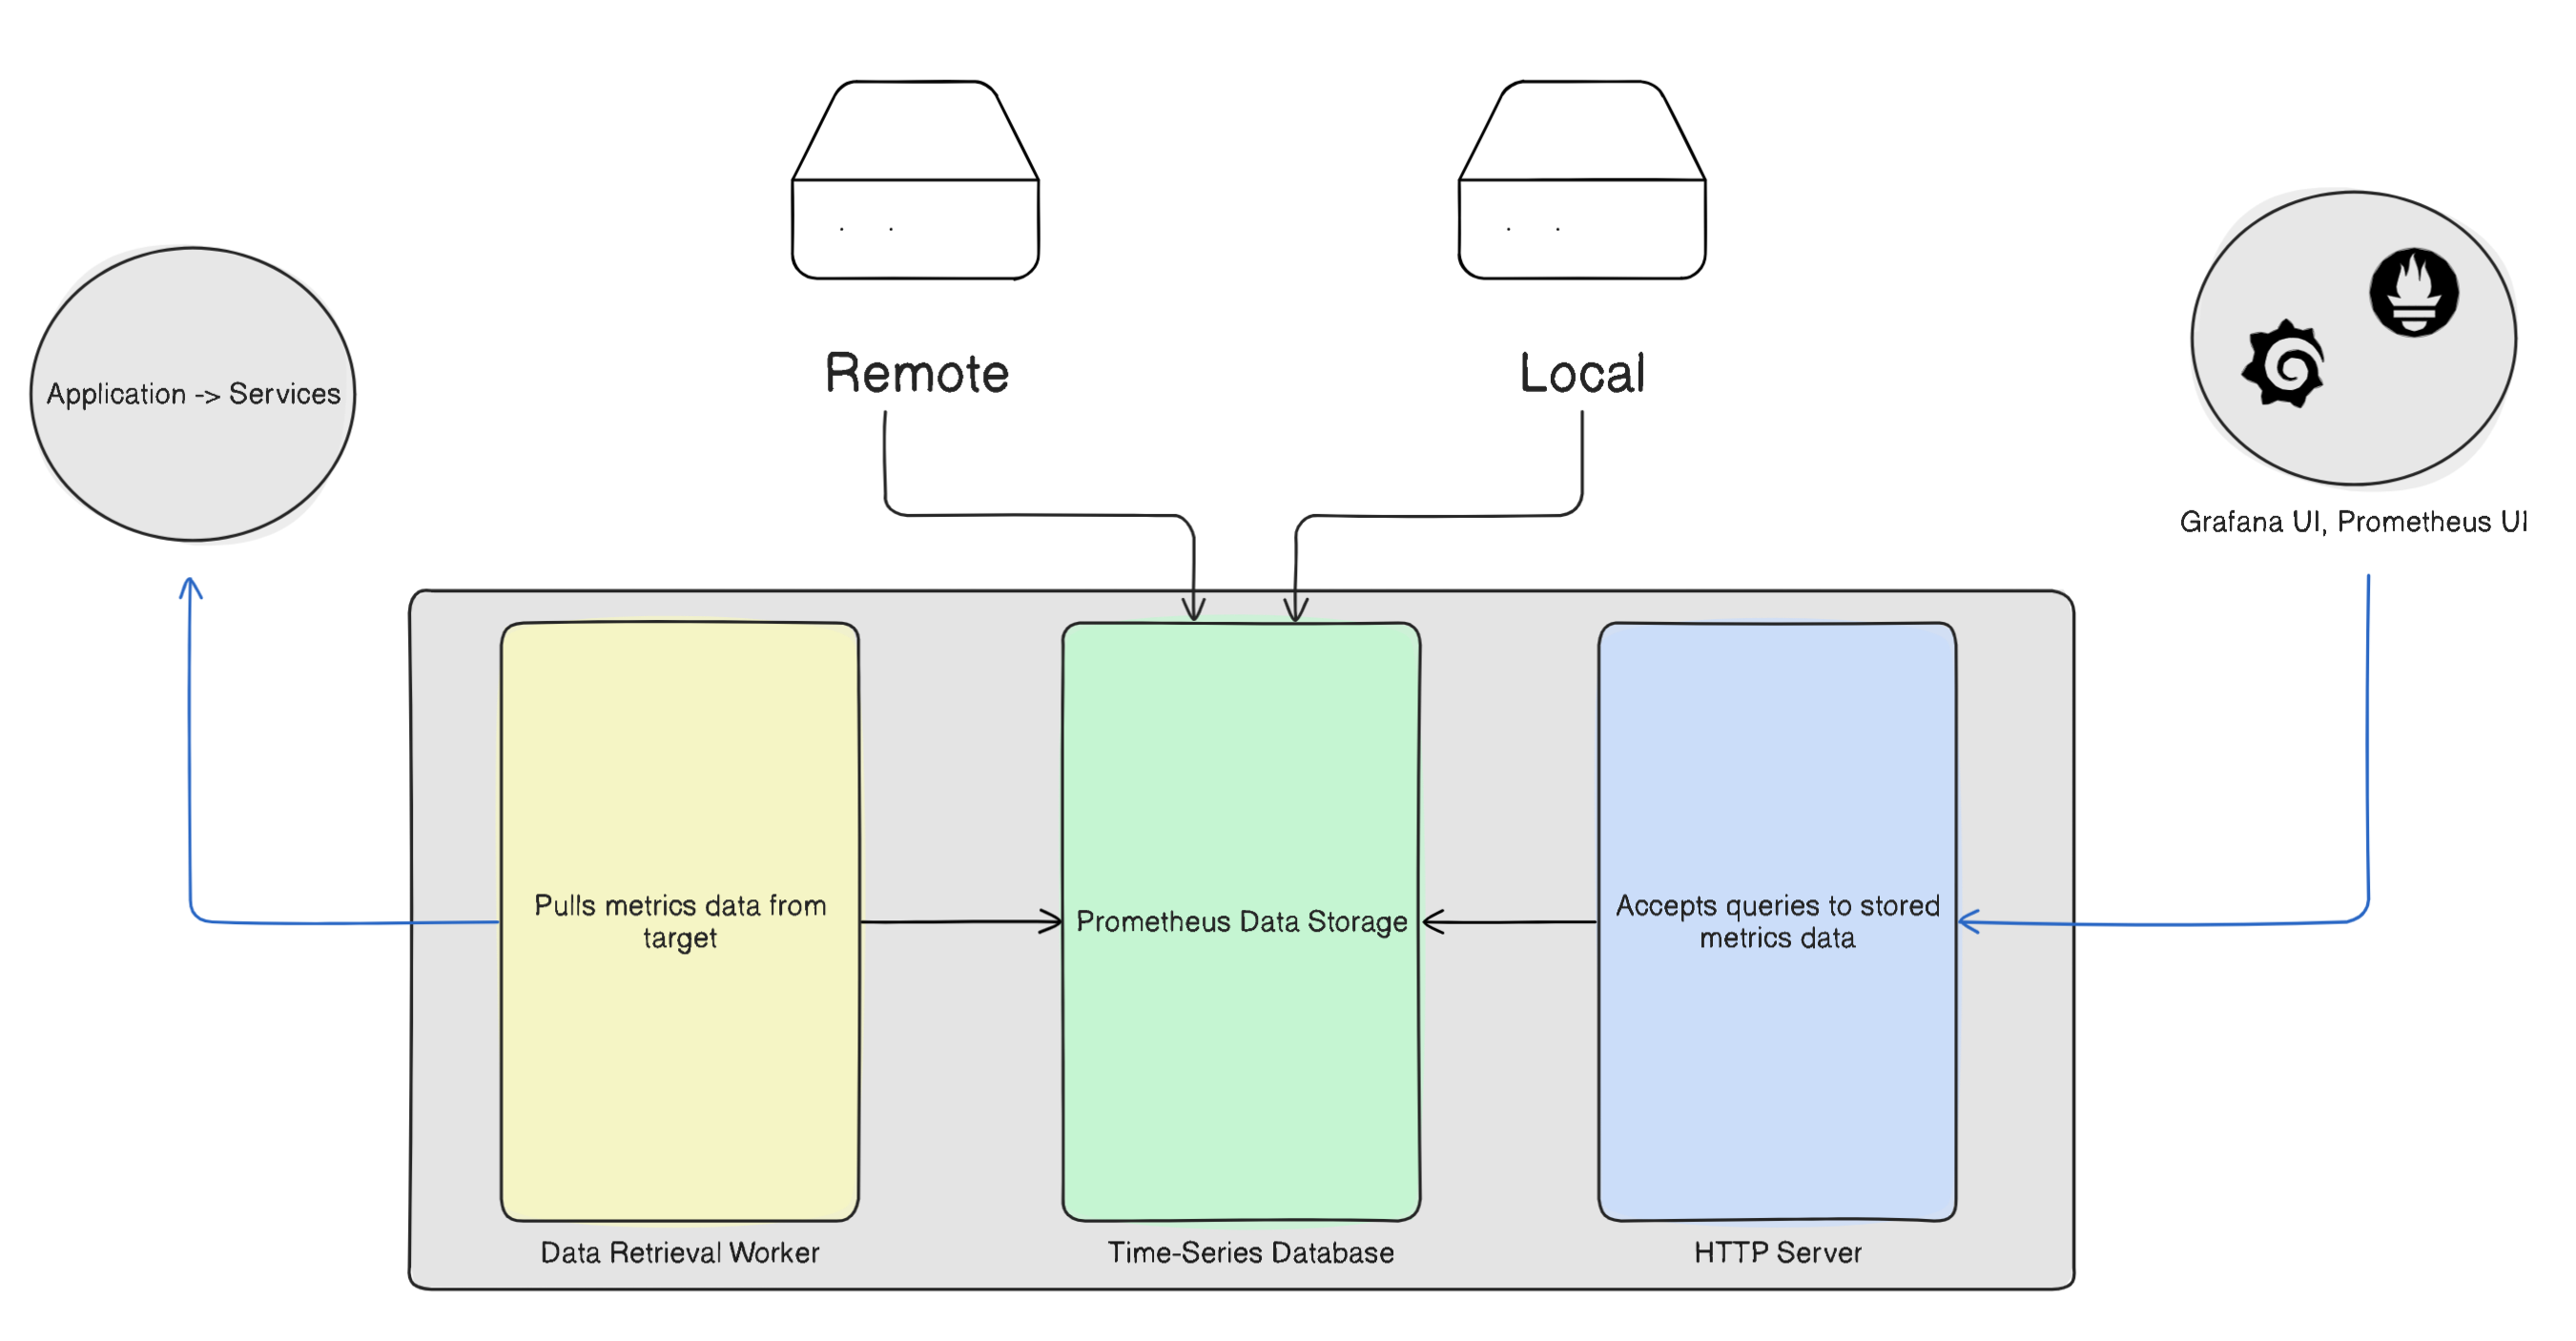
Most of the time a remote storage is preferred as the failure chances are reduced.
So, that's a quick overview of Prometheus! I hope you found this blog helpful. If you did, feel free to follow me—I regularly post content like this. I'd love to hear your thoughts, so please reach out to me on social media or via email. I'm always eager to hear your feedback and improve!
Subscribe to my newsletter
Read articles from Vishwajeet Singh directly inside your inbox. Subscribe to the newsletter, and don't miss out.
Written by

Vishwajeet Singh
Vishwajeet Singh
Sharing my insights in DevOps