Profiling Node.js application with VS Code
 Pavel Romanov
Profiling your Node.js applications could be exhausting, especially when you have to switch between different tools to get a full picture of your app's performance.
The constant switching of contexts can kill your productivity.
What if I tell you that it doesn't have to be that way? What if you could perform all the necessary profiling routine within the same workspace you're already using for coding?
In this article, we'll explore how to use the VS Code built-in debugger to profile and troubleshoot common performance issues in your Node.js application.
You'll be surprised how much you can do in terms of profiling by just using VS Code.
Setup
To illustrate the profiling process, we'll need some code. I've created a GitHub repository that contains common performance issues you might encounter in your Node.js application.
The repository contains a simple Node.js application with three routes, each designed to demonstrate a specific performance issue.
A CPU-intensive task that blocks the main thread.
An asynchronous operation with the waterfall problem, where execution goes sequentially instead of in parallel.
A memory leak.
Each route has two implementations: one with the problem that can be spotted using the VS Code profiler, and the other is an optimized version offering with the same functionality.
I encourage you to clone the repository and explore the code to better understand the topics we're about to discuss.
Profiling
Now that we've set up the project let's explore how profiling in VS Code works.
Before diving into the specific problems, I want to mention that VS Code generates a profiling report after each profiling session. This profiling report can be viewed in 2 different ways:
Table
Flamegraph
While the table view is built-in, the flamegraph view requires a separate flamegrap extension to enable it.
Having multiple ways to visualize your data leads to better understanding. You can catch insights using one type of view that are hard to notice using the other type.
CPU-intensive endpoint
We start with the CPU-intensive endpoint. The main problem behind every CPU-intensive operation in JavaScript is that it blocks the execution thread. Other tasks can hardly make any progress while a CPU-intensive operation is running.
Sure, it can be solved by moving this task into a dedicated thread, but more often than not, you can avoid it by using a more efficient algorithm or data structure.
In our case, there are two implementations of this endpoint: one with a high CPU load and the other without it.
Let's look at implementation with high CPU consumption first.
function runCpuIntensiveTask(cb) {
  function fibonacciRecursive(n) {
    if (n <= 1) {
      return n;
    }
    return fibonacciRecursive(n - 1) + fibonacciRecursive(n - 2);
   }
  fibonacciRecursive(45);
  cb();
}
Here is the code that does the same thing in terms of functionality but consumes way less CPU resources.
function runSmartCpuIntensiveTask(cb) {
  function fibonacciIterative(n) {
    if (n <= 1) {
      return n;
    }
    let prev = 0, curr = 1;
    for (let i = 2; i <= n; i++) {
      const next = prev + curr;
      prev = curr;
      curr = next;
    }
    return curr;
  }
  fibonacciIterative(45)
  cb();
}
Both versions calculate the 45th Fibonacci number. The first implementation uses a recursive, CPU-intensive approach, while the second one employs an iterative, more efficient approach.
To start the profiling session in VS Code, you should follow these steps:
- Open the Debugger tab, typically located on the left panel.

Choose the script you want to execute in the "Run and Debug" section.
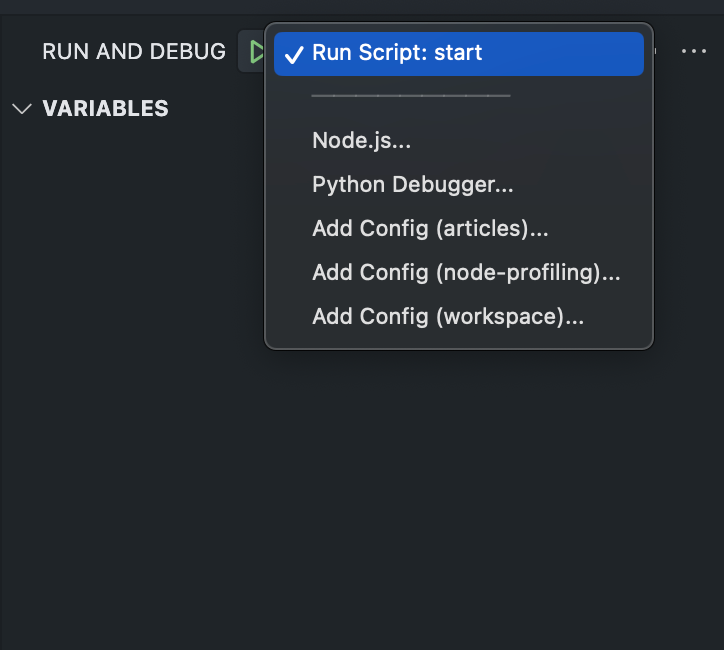
Choose the appropriate profiling option. For CPU-intensive endpoint, we select "CPU profile".
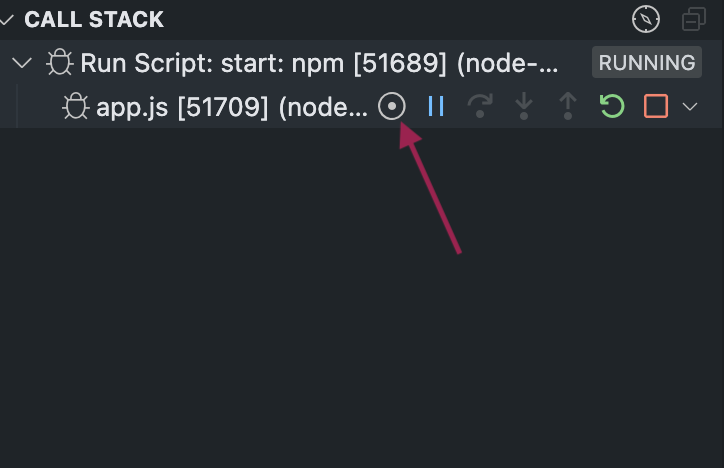
Navigate to the "Call stack" section and click the "Take performance profile" button.

Choose the run option. For simplicity, we'll use the "Manual" option.

After going through all these steps, we're ready to start profiling.
Since the Node.js server is already running we only have to send a request to the CPU-intensive endpoint. We'll start with the implementation that consumes a lot of CPU resources and see if we can identify the problem just by looking at the profiling report.
Here are the profiler entries after sending the request:

As you can see, it is pretty easy to identify the bottleneck, it is the fibonacci function.
The results are presented in the table view. If you prefer a visual representation, you can switch to the flamegraph by clicking the flame button.

Remember, this button is only available after installing the flamegrap extension.
After clicking this button, you will see a picture similar to the timeline and entries.
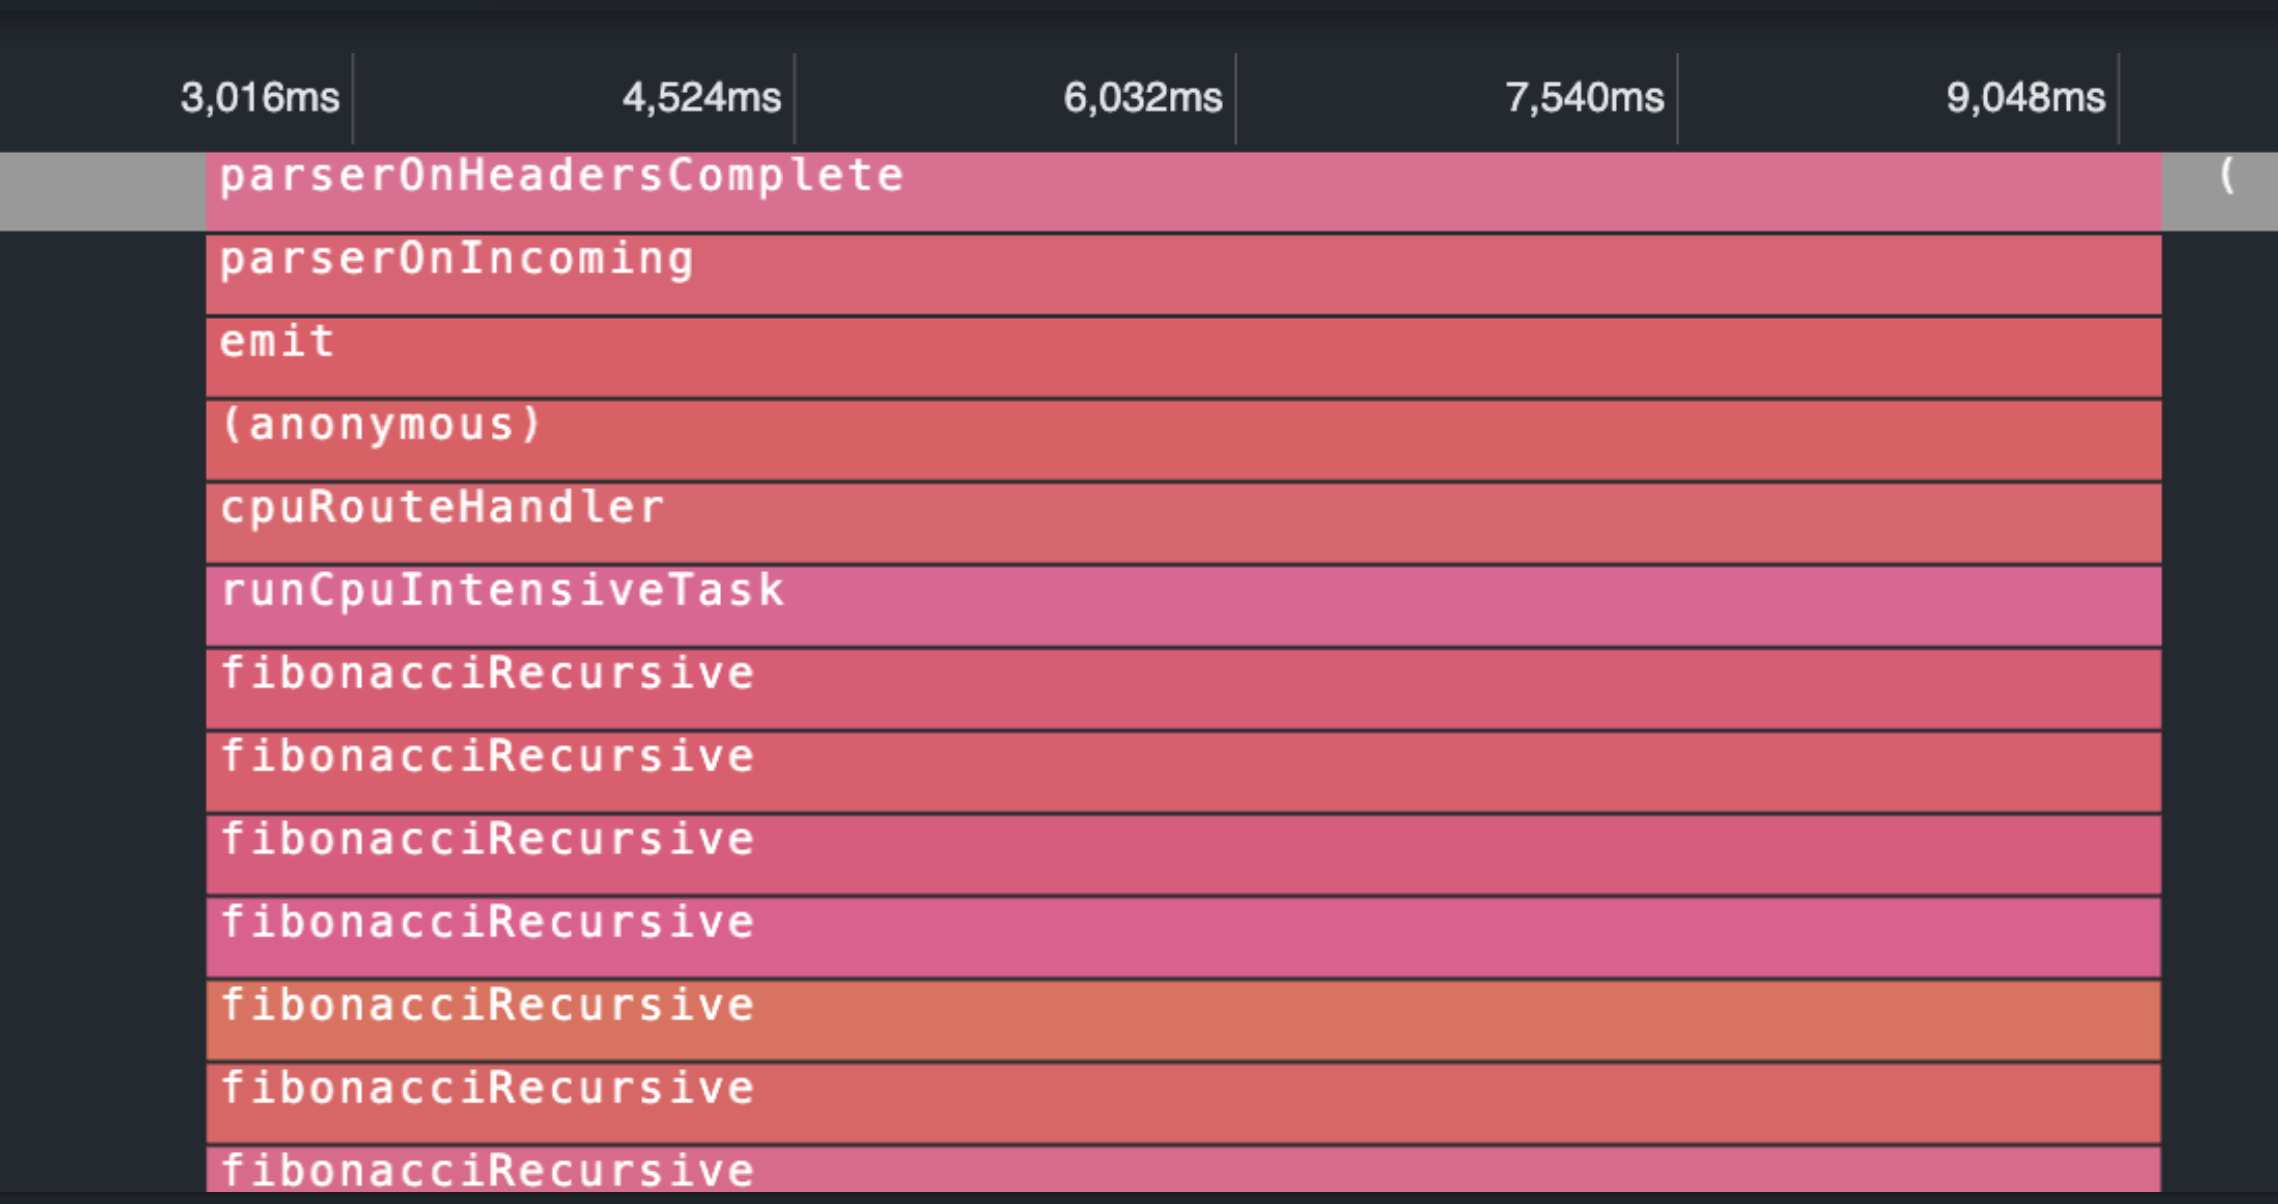
Now that we've identified the problem, let's replace the recursive implementation with an iterative one and profile the improved version of the CPU-intensive endpoint.
After sending the request to the endpoint with the improved fibonacci function we see the following results:
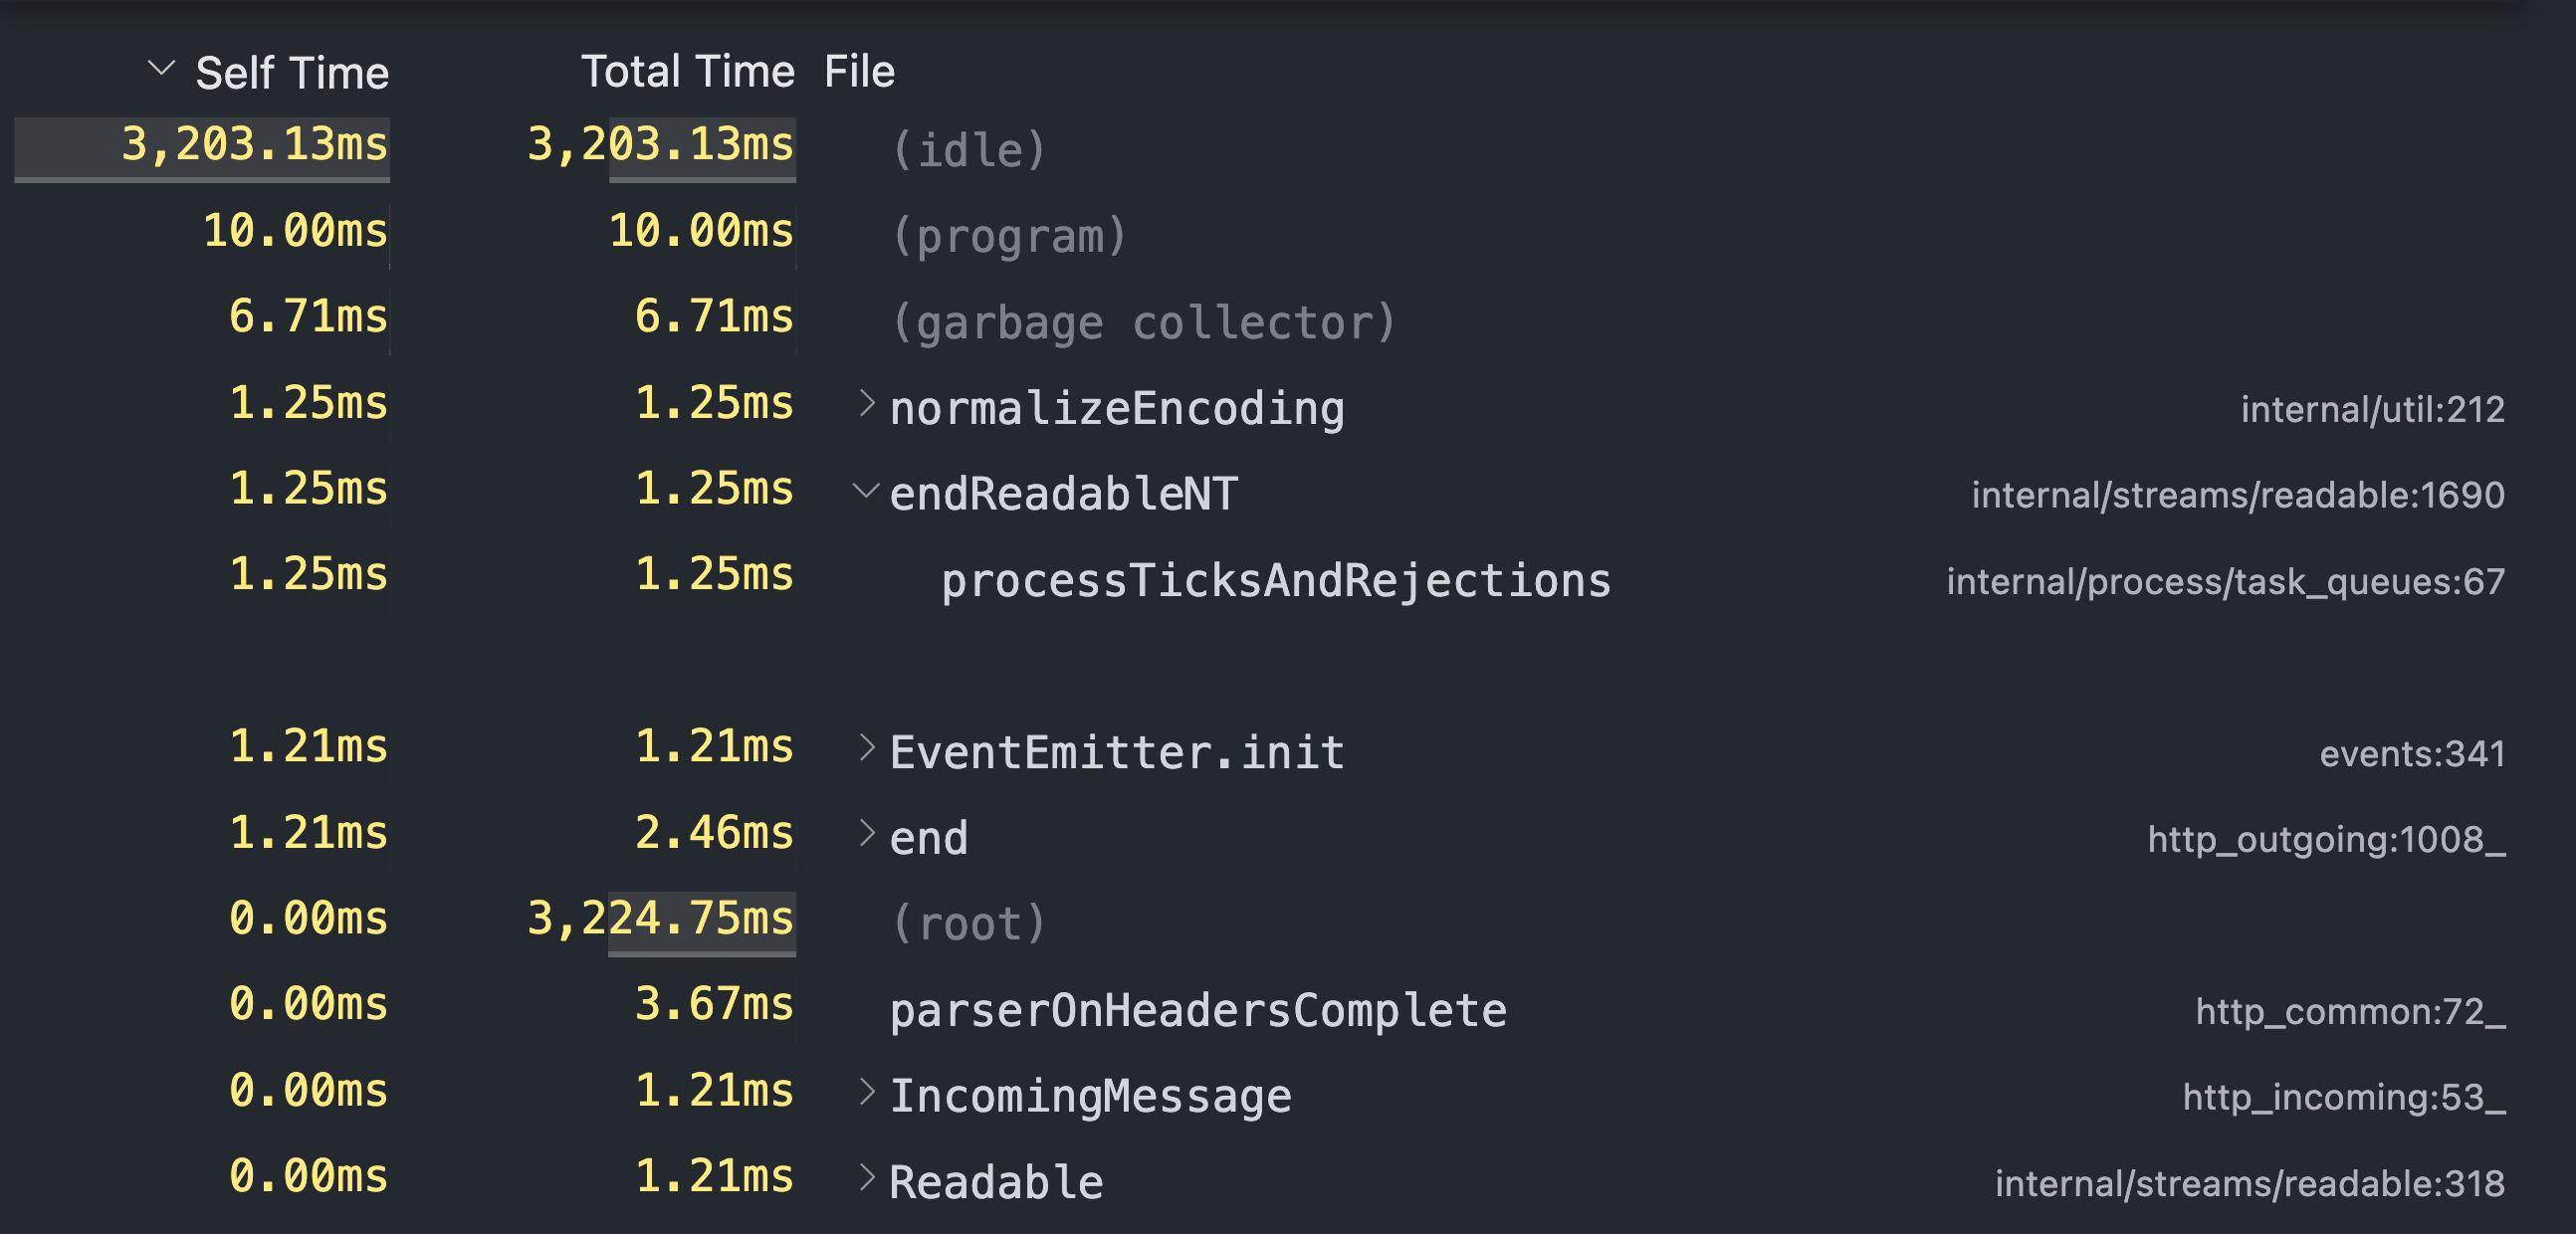
The fibonacci function is not even close to the top 10 profiling entries. If we open the same profiling report in the flamegrap view you'll see that now it takes less than 10ms to execute.
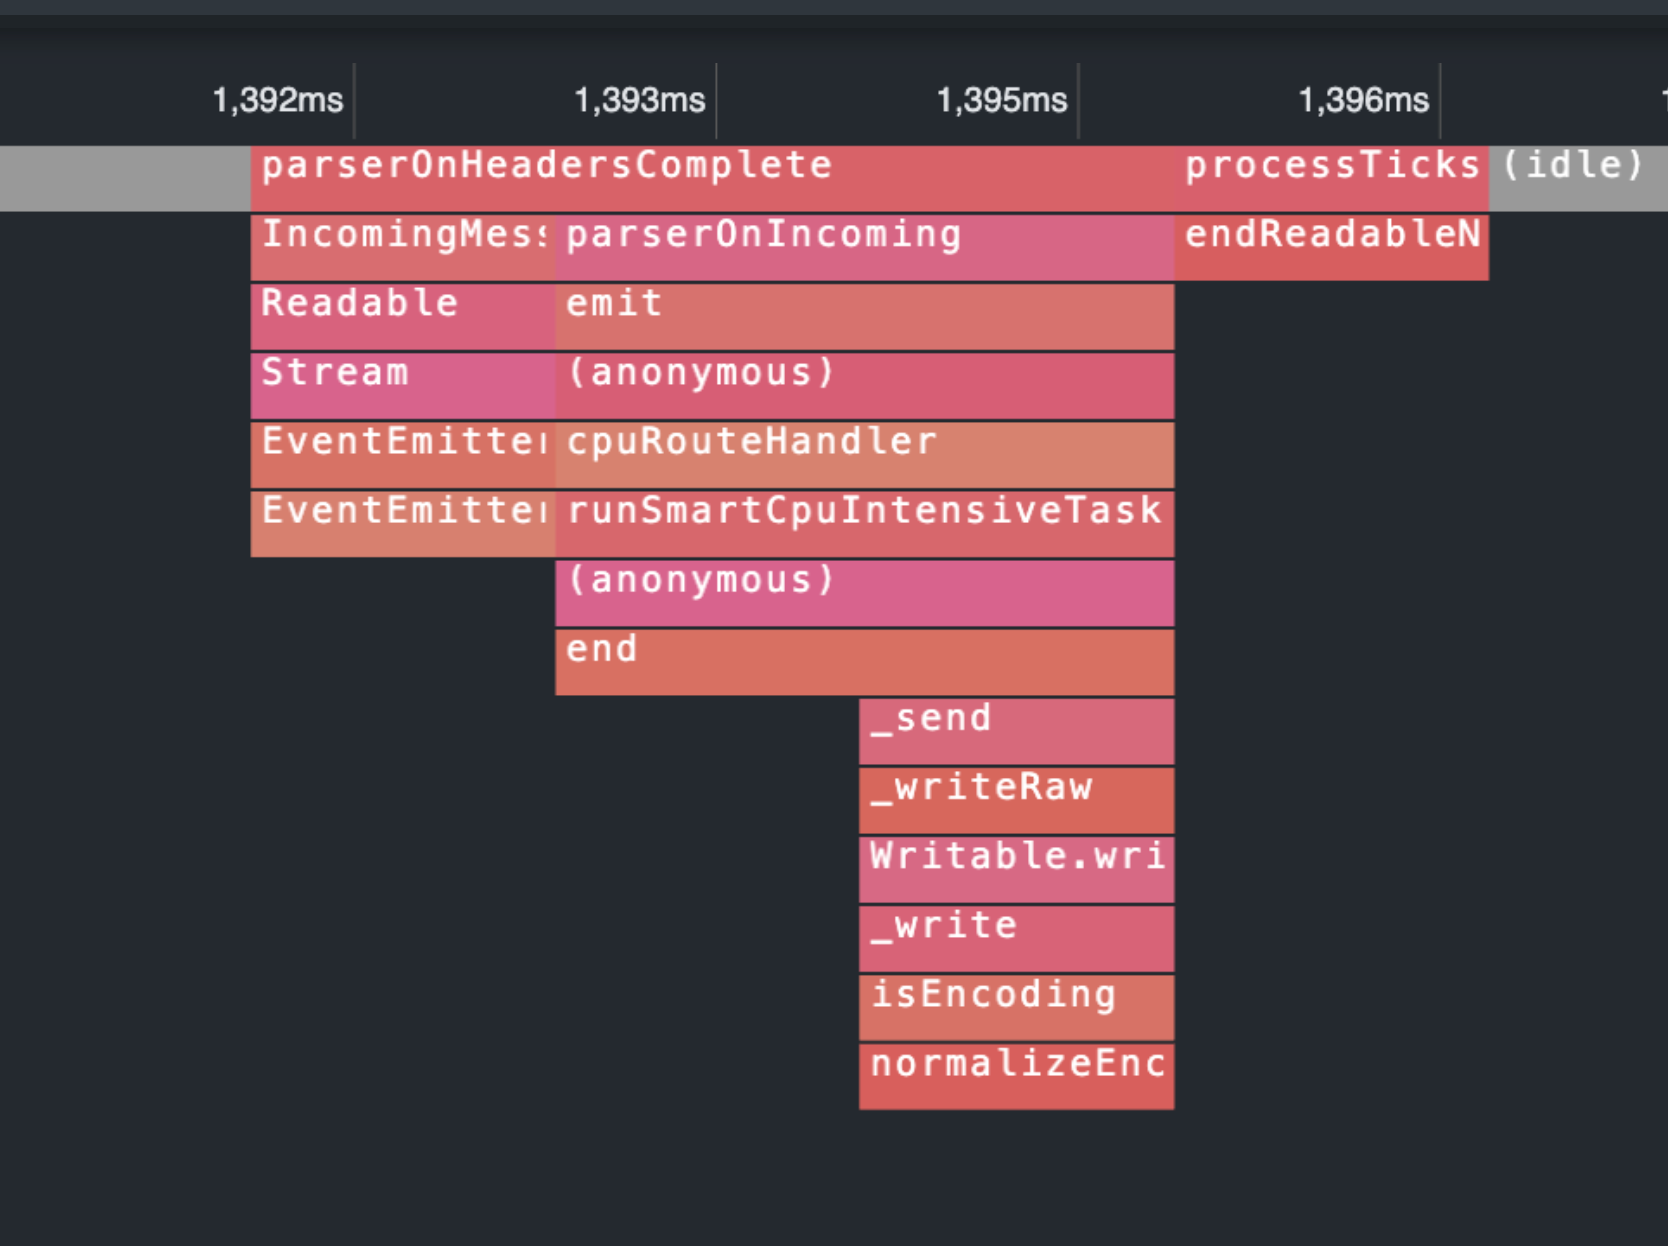
Compare this 10ms of execution time to the previous 6.5sec. We can clearly see performance gains.
Async endpoint
Next, let's explore how to use VS Code's profiler to identify and resolve issues with asynchronous code execution.
Here's an asynchronous function that simulates a time-consuming operation:
function generateAsyncOperation() {
 return new Promise(resolve => {
   setTimeout(() => {
     // Simulate a time-consuming asynchronous operation
     for (let i = 0; i < 50000000; i++) { }
       resolve();
   }, 1000);
  });
}
For the sake of the example, we're running the for loop inside of the setTimeout callback just to make things easier to see in the profiler report.
First implementation of the asynchronous endpoint suffer from the waterfall problem where independent asynchronous functions are executed sequentially, causing details as each function waits for the previous one to complete.
export async function runAsyncTask(cb) {
 await generateAsyncOperation();
 await generateAsyncOperation();
 await generateAsyncOperation();
 cb();
}
Since these asynchronous functions are independent, we don't need to run them sequentially. Instead, we can run them concurrently.
export async function runSmartAsyncTask(cb) {
 await Promise.all(new Array(3).fill().map(() => generateAsyncOperation()));
 cb();
}
By using Promise.all we can run all 3 functions simultaneously.
Now that we've explored the code let's see how profiling can help us identify and address the waterfall problem. You start the debugging session in the same way as we did it for the CPU-intensive endpoint:
Open the Debugger tab
In the "Run and Debug" section, choose the script you want to execute.
Navigate to the "Call stack" section and click the "Take performance profile" button.
Select the "CPU profile" as a profiling option.
Choose the "Manual" run option.
Let's start by profiling the asynchronous endpoint with the sequential implementation. After sending a request and generating the profiling report, we see the following picture:
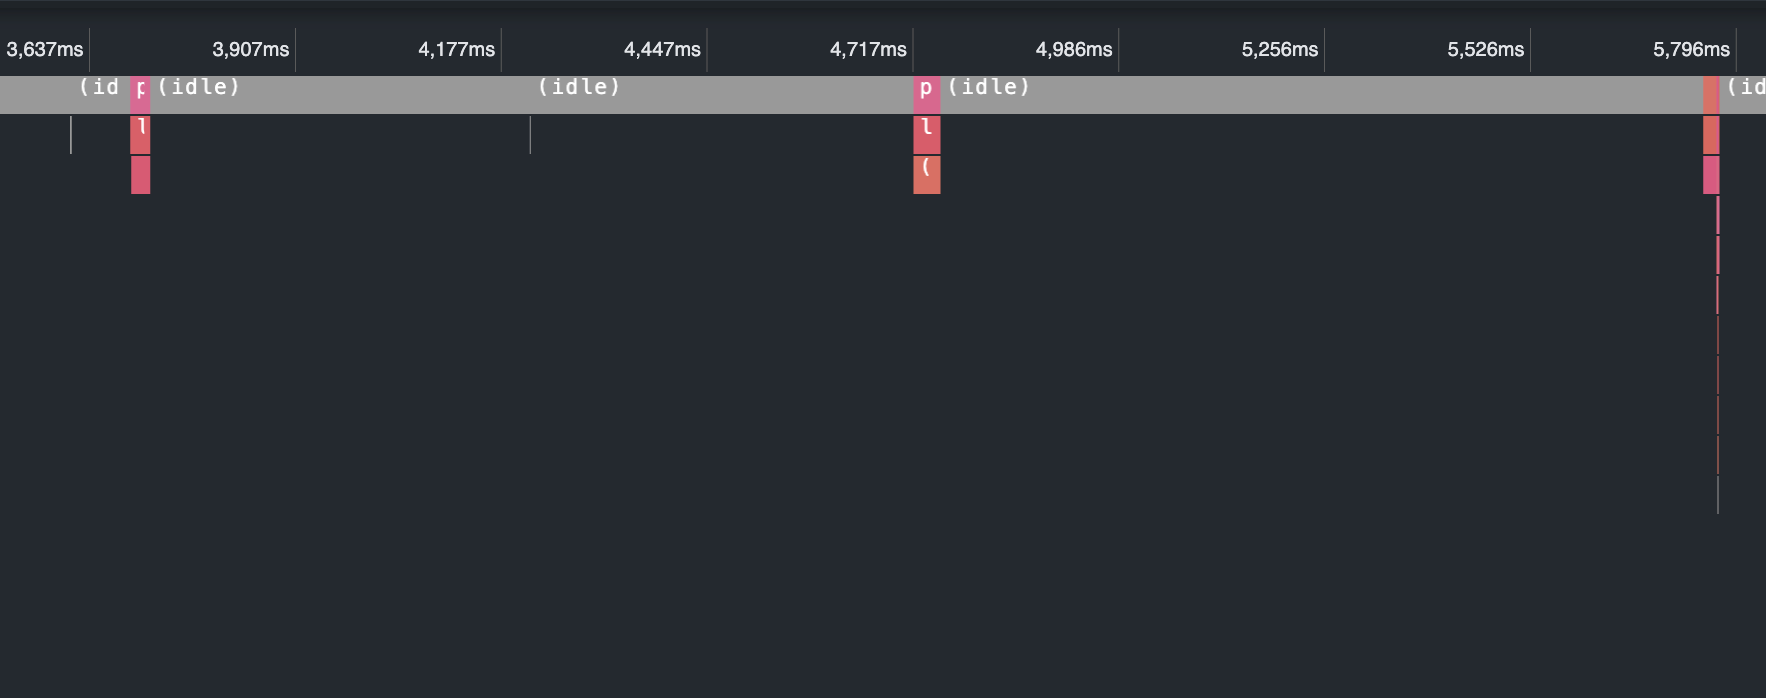
Notice those 3 pink entries on the flamegraph. Each one of those entries represents the execution of the generateAsyncOperation function.
The time span from the first entry to the last one is almost 2 seconds.
It takes almost 2 seconds from the first entry to the last one. Only after the last entry completes its executed we can get the response from the server.
After identifying the problem we can replace the sequential implementation with the optimized parallel version.
When you finish profiling the new endpoint implementation, the generated profiling report will surprise you.
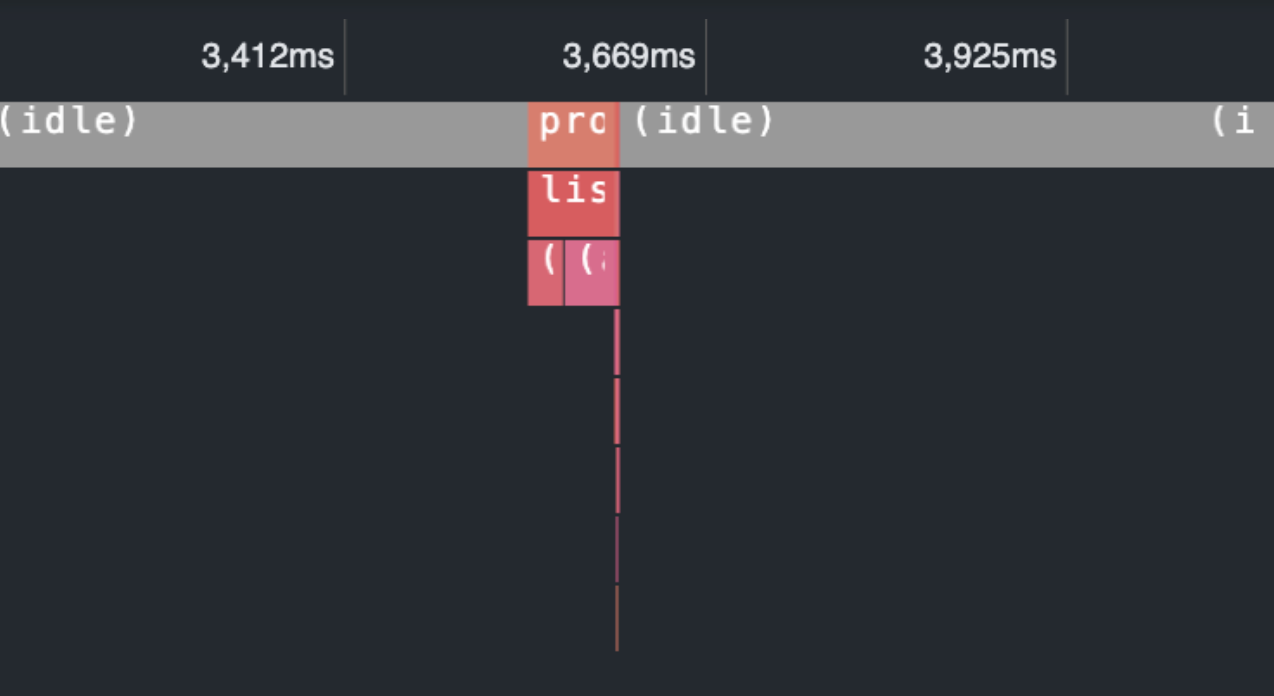
Instead of 3 distinct entries there is only 1 representing the concurrent execution of all three asynchronous operations. It takes less than 100ms to complete the requests and return the result.
Memory leak endpoint
The last type of problems that we'll look into is memory leaks.
Here is how code containing memory leak looks like:
const memoryLeak = new Map();

// Function with a memory leak
export function runMemoryLeakTask(cb) {
 for (let i = 0; i < 10000; i++) {
   const person = {
     name: `Person number ${i}`,
     age: i,
   };
   memoryLeak.set(person, `I am a person number ${i}`);
 }
 cb();
}
In this case we assume that data from one request is not required for subsequent requests. Therefore, if any data persists between requests we consider it a memory leak.
Here's a modified version of the code without the memory leak:
const smartMemoryLeak = new WeakMap();

// Function without a memory leak
export function runSmartMemoryLeakTask(cb) {
 for (let i = 0; i < 10000; i++) {
   const person = {
     name: `Person number ${i}`,
     age: i,
   };
   smartMemoryLeak.set(person, `I am a person number ${i}`);
 }
 cb();
}
The main difference between these 2 implementations is the type of data used to store the objects. The Map in the first example keeps strong references to the object preventing garbage collection even when the object are no longer needed.
In contrast, the WeakMap in the second example uses weak references making objects available for garbage collection if the objects themselves are no longer referenced anywhere except the WeakMap itself.
We're ready to start profiling. The steps are the same except for the type of profiling we're running. The only difference is that instead of "CPU profile" we use "Heap Profile" option.

To clearly demonstrate the memory leak, let's send 4 requests to both endpoint implementations and compare the results.
Here is the profiling report after sending 4 requests to the endpoint that uses Map to store objects.

After the 4 requests, the program using Map occupies around 6mb of memory. While it might not seem like much, let's compare it to the implementation which uses WeakMap.

The program that uses WeakMap occupies only 350kb of memory after 4 requests. This is less than half a megabyte. The result is that the program occupies 16 times less memory space.
Conclusion
While VS Code might not have all the advanced features of dedicated profiling tools like DevTools or is not as smart as Clinic.js, it is still a solid option for profiling your Node.js applications.
Especially because you don't need to download any external libraries or connect to external tools and systems. Everything just works within your coding environment, so you stay focused on the goal.
If you want to learn more about other profiling options, I highly recommend reading the previous articles about how to profile Node.js apps using Chrome DevTools and how smart Clinic.js can help you understand profiling reports better.
Subscribe to my newsletter
Read articles from Pavel Romanov directly inside your inbox. Subscribe to the newsletter, and don't miss out.
Written by

Pavel Romanov
Pavel Romanov
Software Engineer. Focused on Node.js and JavaScript. Here to share my learnings and to learn something new.