First eBPF program
 prateek singh
Anatomy of an eBPF program
When working with eBPF programs, there are a few parts to it, namely:
When the program will run.
What it will do.
How will it share information with the user space.
When the program will run
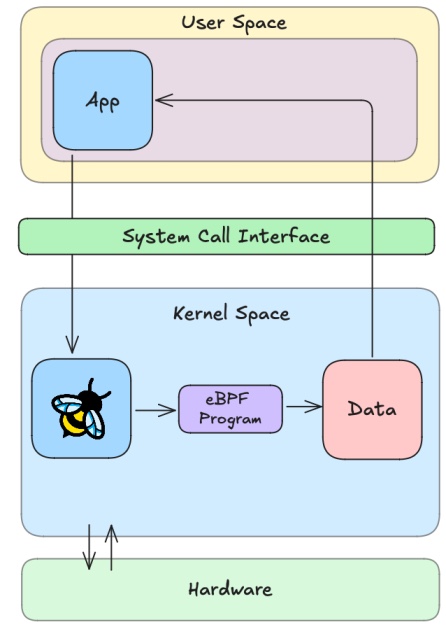
As mentioned in our previous article Introduction to eBPF, eBPF programs run by attaching them to various types of kernel events, when those events are triggered, eBPF code attached to them is also run.
The one which we will be using in this article are KProbes (Kernel probes), which are hooks in the kernel program.
Brief introduction to KProbes
Since Kernel is also a piece of software that is written in a programming language, comprised of individual functions and logic which are run depending on what action is to be performed.
Probes allow you to attach a custom logic (eBPF program) to a specific kernel function (let’s say A). When the kernel executes the function A, KProbe intercepts it and executes the custom eBPF code, when that returns, the kernel continues the execution of the function A as if nothing happened.
What it will do
The capabilities of the program depends on what kernel event it is attached to, some of the very simple use-cases can be:
An eBPF program attached to a network socket can inspect each packet and decide whether to drop or forward it, enabling fine-grained firewall logic or custom filtering based on content, IP, or protocol.
Attach eBPF to a system call (e.g.,
open()) and log whenever a file is opened. This can help track file access patterns.An eBPF program attached to TCP events can measure the time it takes to send and receive packets, helping to identify latency bottlenecks.
Attach eBPF to file I/O events to inspect read/write actions, allowing specific access control to sensitive files.
and many more use-cases which we will progressively build and test in the future.
How will it share the information with the user space
Why to share the information
As mentioned in Introduction to eBPF, most of the applications we interact with run in the user space, so if we have eBPF programs performing some actions in the kernel space, the user may want to know what they are doing.
It can be simple information like:
How many times a user interacted with files in the system.
How many packets were dropped and why were they dropped.
How much time was taken by each packet to be sent or received.
and everyone loves beautiful Dashboards to look at instead of numbers and plain text. Programs for such dashboards run in User space, they are written in high level programming languages like JavaScript. These dashboards read data from a store and render them in beautiful UI/UX.

How to share the information
There are countless ways of storing information and we will talk about them extensively. They are Data Structures which include but are not limited to:
BPF maps: Depending on the use-case and the type of data you want to store, there are different types of BPF maps available. Some of them are listed here uapi/linux/bpf.h and they range from arrays, Key value pairs and so on.
Ring Buffers: These are more flexible data structures that allow you to write different size/type of data and are efficient with how they store information. We will talk extensively about them later.
Now we understand the three building blocks of an eBPF program, so let’s write our first program.
First Program
from bcc import BPF

program = r"""
int hello(void *ctx) {
    bpf_trace_printk("Hello World!");
    return 0;
}
"""

b = BPF(text=program)
syscall = b.get_syscall_fnname("execve")
b.attach_kprobe(event=syscall, fn_name="hello")

b.trace_print()
Above we have our “Hello world” equivalent of an eBPF program. It has two major parts.
The eBPF program that will run in the kernel which is the string stored in variable
program.The user space code (python) that will load the eBPF program into the kernel and read out the information generated.
Let’s understand the program line by line.
from bcc import BPF
BCC is a Python framework that provides us with various utility functions to write and run eBPF programs. It provides utilities for IO, networking or monitoring related programs.
program = r"""
int hello(void *ctx) {
    bpf_trace_printk("Hello World!");
    return 0;
}
"""
program is a python variable that stores a string, which is our eBPF program itself, this is the program that is loaded in the kernel and runs.
The program is a C function named hello which does nothing special, it uses a utility function from BCC named bpf_trace_printk() which takes the argument passed to it and writes them in a pseudo file location: /sys/kernel/debug/tracing/trace_pipe.
In our case, we are writing Hello world into the file.
b = BPF(text=program)
BPF is a utility function that will take our eBPF program (stored in program as a string) and compile it before it gets executed.
syscall = b.get_syscall_fnname("execve")
get_syscall_fnname is a BCC utility function to get the name of the function associated with the given system call. In our case, we are using execve system call which is called whenever a new program starts executing.
We are using the utility function instead of hard-coding the function name because the execve is a standard interface in linux kernel, but the implementing function name differs on the basis of the chip architecture. Our utility function does all the heavy lifting for us to find the function name.
b.attach_kprobe(event=syscall, fn_name="hello")
attach_kprobe utility function loads the program into the kernel and attaches it to the provided event. In our case, function named hello is attached to the system call execve.
b.trace_print()
trace_print() is a BCC utility function that reads indefinitely (until program execution is stopped with ctrl+c) from the pseudofile /sys/kernel/debug/tracing/trace_pipe.
The output

Summary
We have a python program that compiles and loads the eBPF program into the kernel and attaches it to the execve system call. The eBPF program then writes “Hello World” to a fixed file /sys/kernel/debug/tracing/trace_pipe every time execve system call gets triggered. Finally our Python program reads whatever is written into that file and prints it on the terminal.
What next
In the upcoming articles, we will build on top of the concepts we learnt here and check other ways of writing eBPF programs, we will start moving away from BCC's utility functions and handle everything on our own to better understand what is happening under the hood.
We will also look into other more efficient ways of sharing information between user and kernel space and we will learn how to efficiently run eBPF programs. So yes, a lot of amazing topics are yet to be discussed 🚀
The example in this article is taken from the book Learning eBPF by Liz Rice, to read more check out the book itself.
Subscribe to my newsletter
Read articles from prateek singh directly inside your inbox. Subscribe to the newsletter, and don't miss out.
Written by

prateek singh
prateek singh
I am a Full stack Software engineer, majoring in Computer science. I have strong foundational skills in multiple domains including Frontend, Backend engineering as well as Kubernetes administration. I am an active Open Source contributor, with contributions in major Open source projects including Cilium, Dapr etc. I also love to build products in general so I am trying out new tech regularly. I am also founder of Senseii, a SaaS product that helps people in their fitness journey by creating workout and meal plans for them. It also helps them follow their plan by regular updates and real time data processing.