Monitoring Docker Logs with Grafana and Loki: Leveraging Docker Logging Driver, Alerts, and Slack Notifications
 Aditya Jaishi
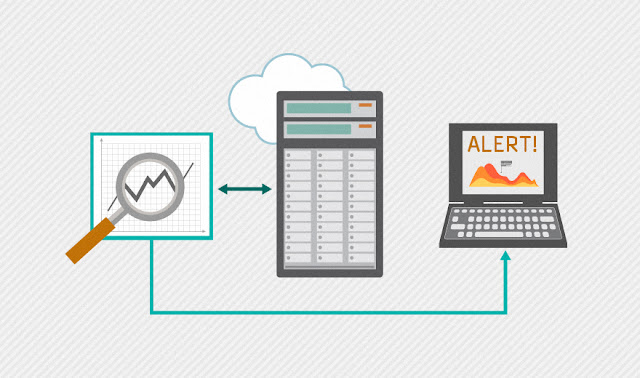
In my previous blog 👍 here i have monitored logs using promtail as agent but wait we have Loki Logging Driver which will give more option to choose container name and watch logs of it Lets go through this.
I have made few changes here as i don’t use promtail here instead use Grafana Loki Docker logging driver plugin . It is a Docker plugin designed to send container logs directly to a Loki instance for centralized log aggregation and monitoring
Compose file:
services:
  laravel-app:
    image: laravel-app
    container_name: laravel-cont
    build:
      context: /home/aditya/laravel/helloworld
    ports:
      - "8555:80"
    networks:
      - monitoring  # Use the monitoring network

  prometheus:
    image: prom/prometheus
    container_name: aditya-prometheus
    volumes:
      - ./prometheus.yml:/etc/prometheus/prometheus.yml
    ports:
      - "8556:9090"
    command:
      - --config.file=/etc/prometheus/prometheus.yml
    networks:
      - monitoring  # Use the monitoring network

  grafana:
    image: grafana/grafana
    container_name: aditya-grafana
    ports:
      - "8557:3000"
    environment:
      - GF_SECURITY_ADMIN_USER=admin
      - GF_SECURITY_ADMIN_PASSWORD=admin
    networks:
      - monitoring  # Use the monitoring network
    depends_on:
      - prometheus
      - loki

  loki:
    image: grafana/loki
    container_name: aditya-loki
    ports:
      - "8558:3100"
    networks:
      - monitoring  # Use the monitoring network

volumes:
  postgres_data:
  grafana_data:
  loki-data:

networks:
  monitoring:
    driver: bridge
This is the same compose file i have used in my previous blog but instead of promtail as log agent i used Grafana Loki Docker logging driver plugin.
So, only change compose-file and follow same step as in previous blog.
Now follow these steps
Step 1: Install a docker driver to send logs to Loki
docker plugin install grafana/loki-docker-driver:latest --alias loki --grant-all-permissions
Step 2: Add the following file in /etc/docker
daemon.json
{
    "debug" : true,
    "log-driver": "loki",
    "log-opts": {
        "loki-url": "http://localhost:8558/loki/api/v1/push",
        "loki-batch-size": "400"
    }
}
Now run the containers and access grafana
Access Grafana
Grafana: http://server-ip:8557
Add datasource as Loki:
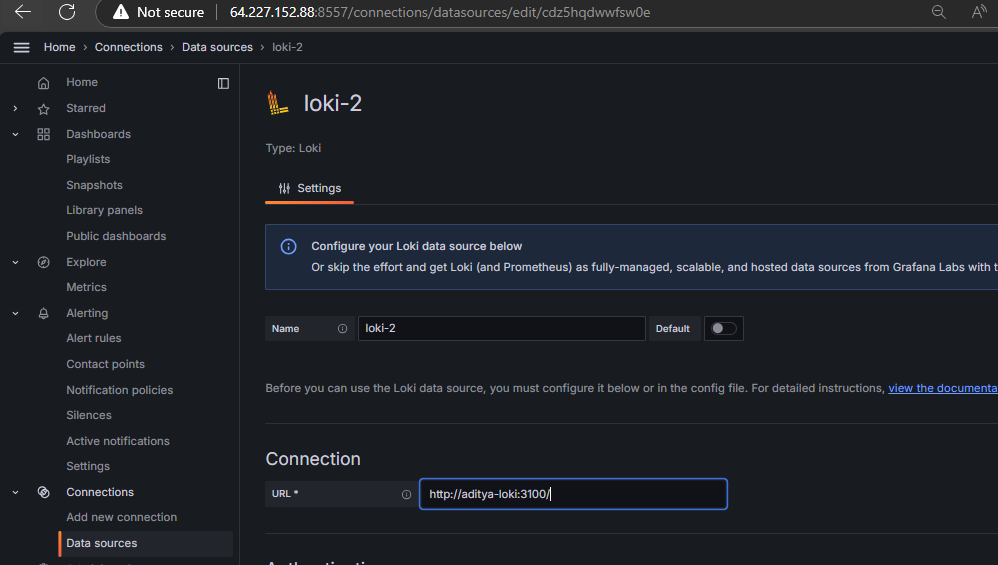
now look at the option provided here
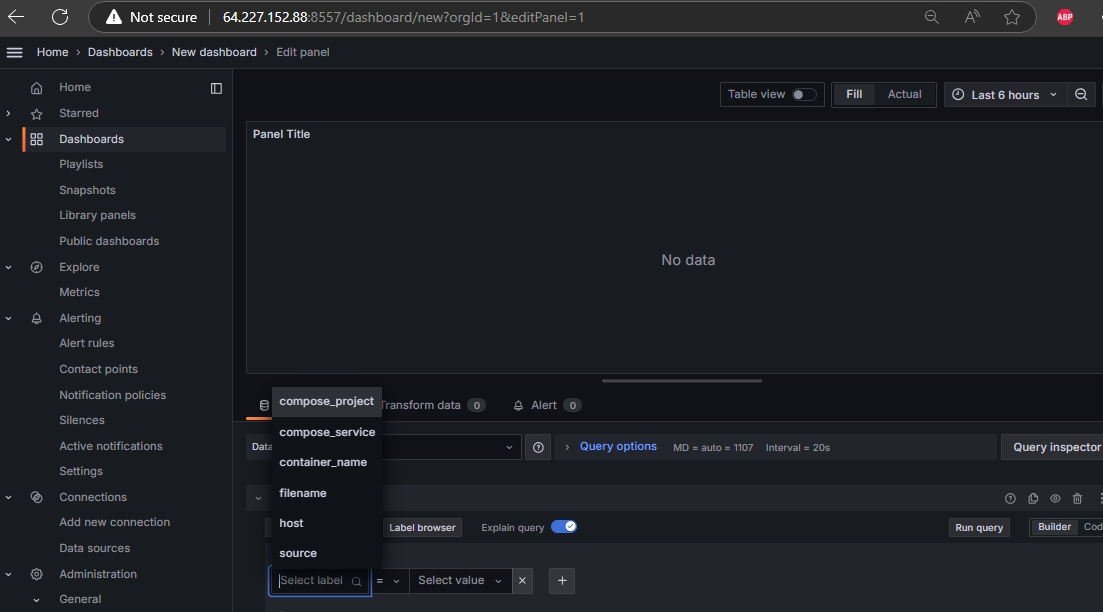
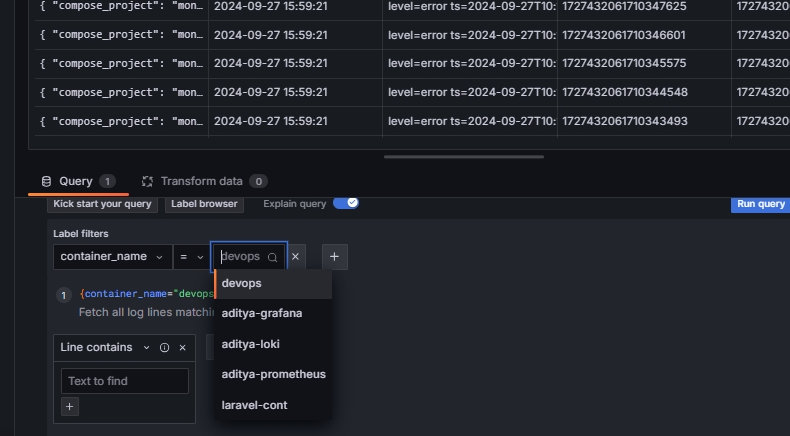
Now, i want to setup alerting rules for CPU usage on node .
Setting Up Alert rules:
To get started, navigate to the New Alert Rule section in your monitoring system.
Enter Alert Name: Choose a descriptive name for your alert rule.
Run the Query: Input the query that monitors CPU usage. This could be a query that checks for CPU utilization above a specific threshold.
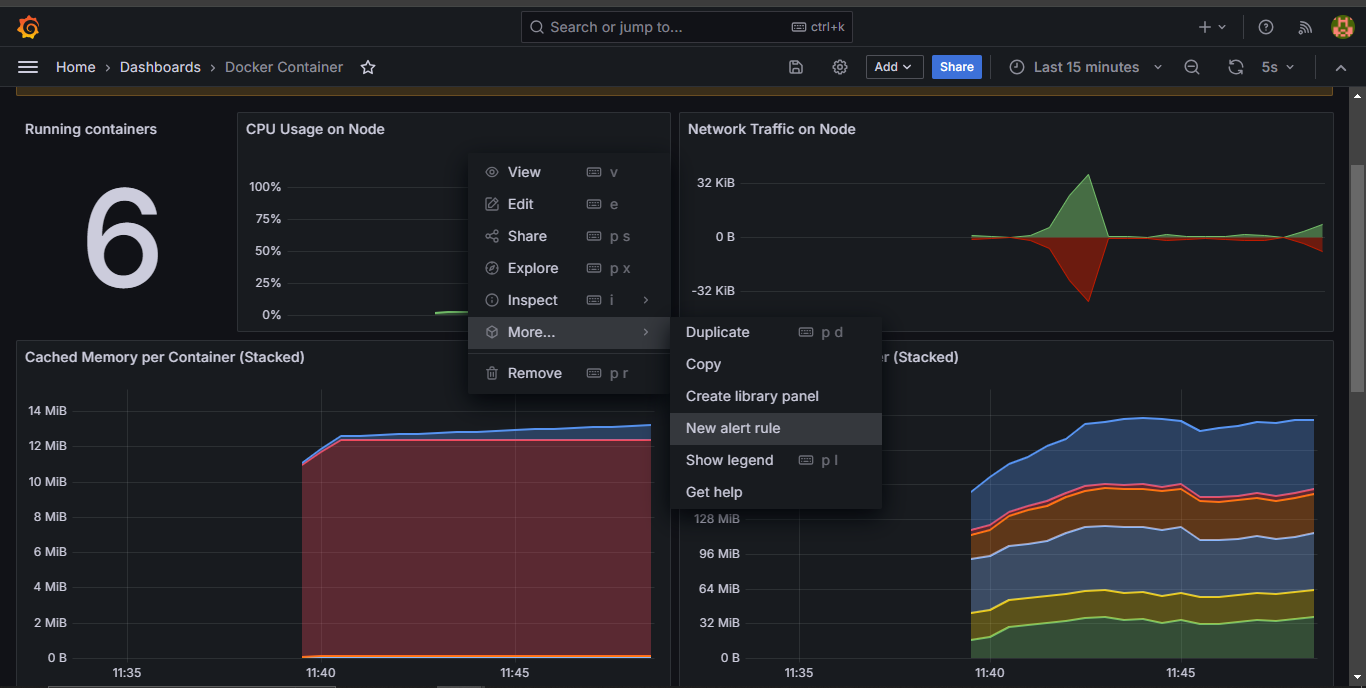
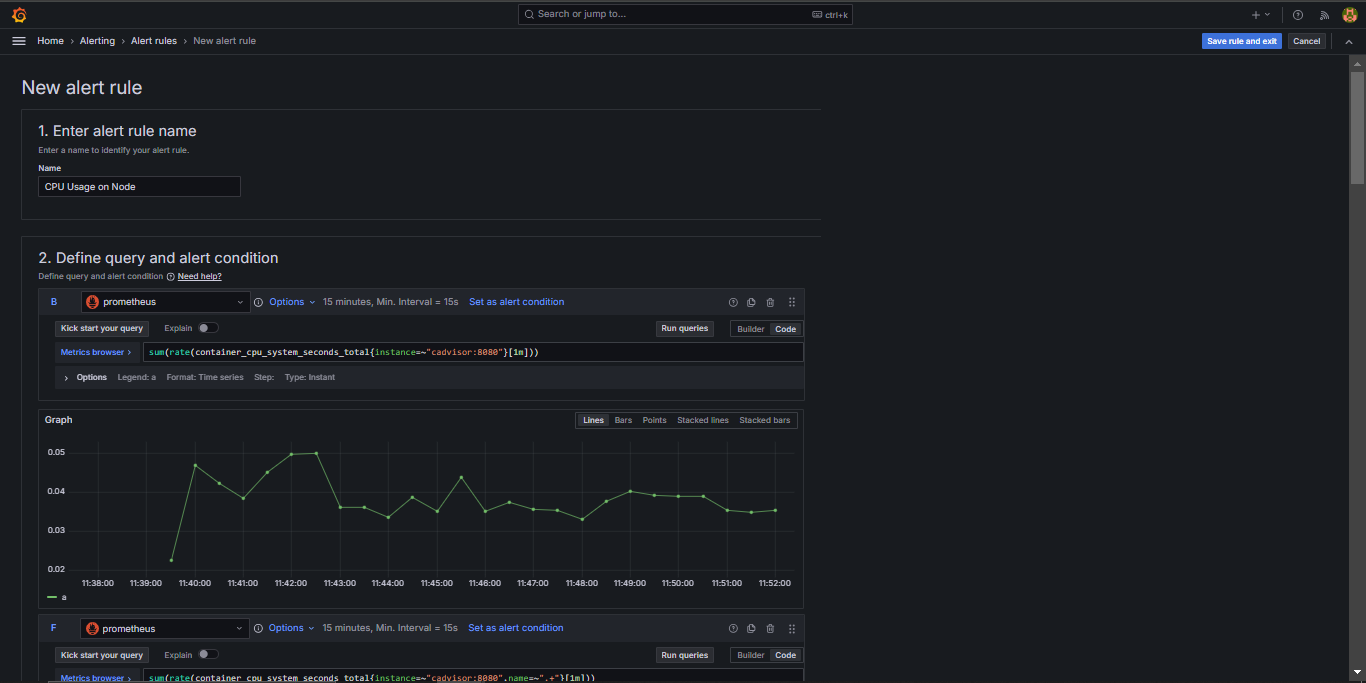
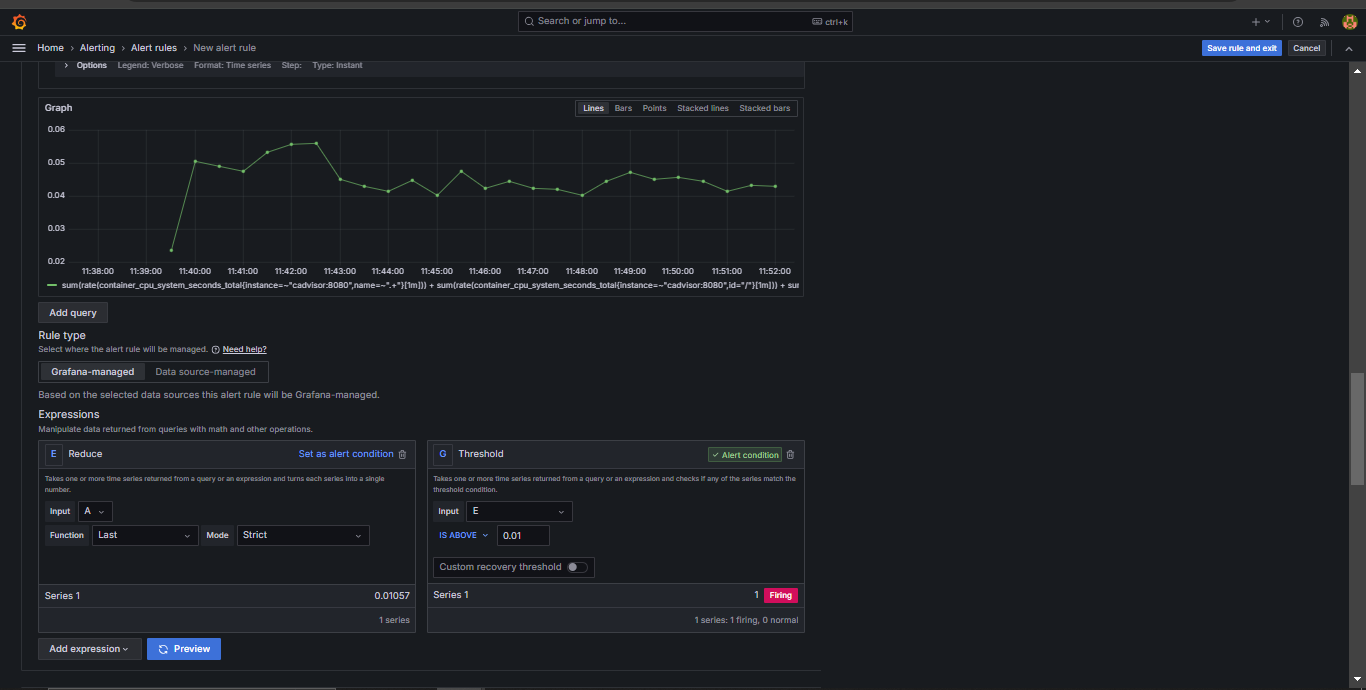
Next, you’ll need to configure the alert condition. Define when the alert should be triggered based on CPU usage metrics. Set parameters such as:
Condition: CPU usage percentage.
Threshold: Define the limit at which the alert should fire.
Once you've set this up, you can visualize if the conditions are met. Below is an example image where the alert condition is triggered because CPU usage exceeded the defined threshold.
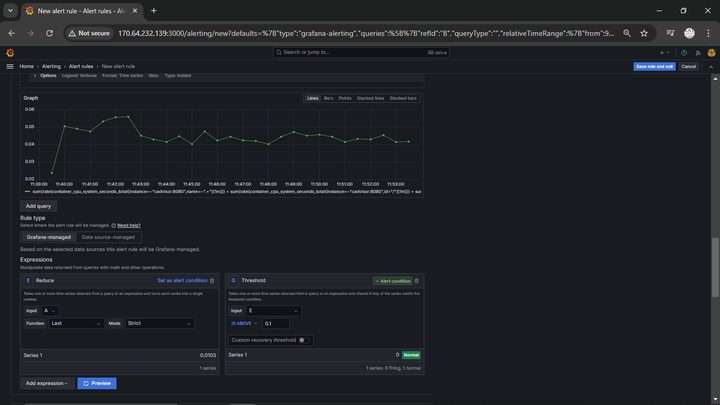
When the CPU usage condition is not met, no alert is fired as it remains within normal limits.
Set Up Notification Channels
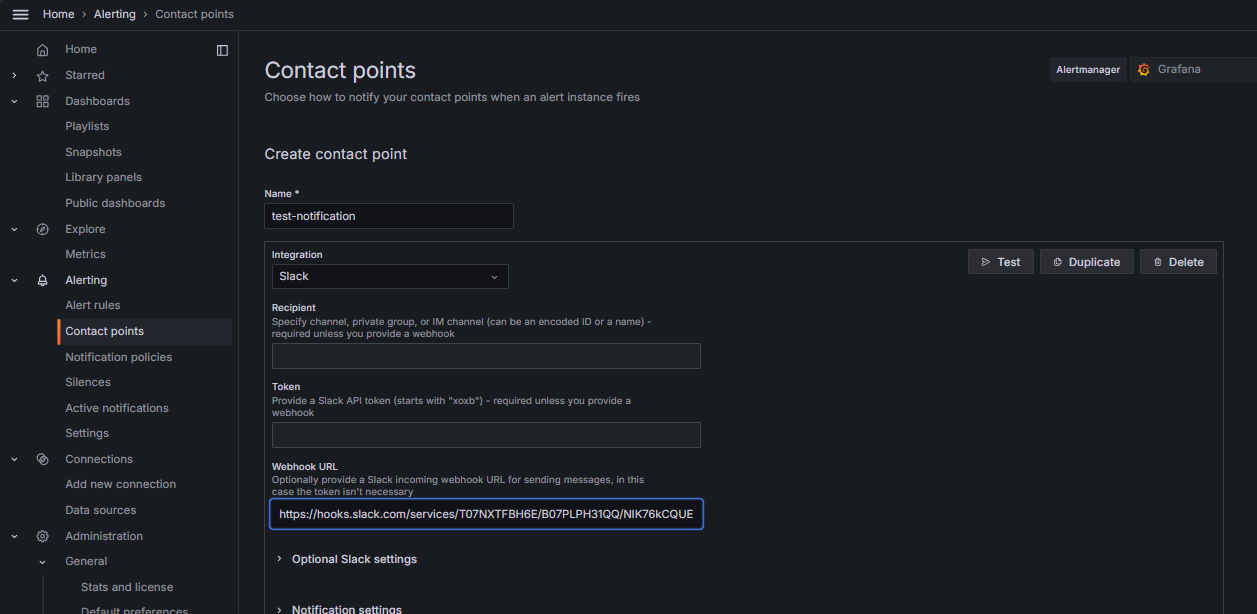
To make sure you're notified when an alert fires, you'll need to set up Contact Points. In this blog, I’ll use Slack as the notification channel.
Configure Slack: Start by setting up a Slack integration with your alerting system. You can do this by creating a Webhook URL from Slack. Follow these steps:
In Slack, go to Apps and search for "Incoming Webhooks".
Select Incoming Webhooks, and click Add to Slack.
Choose the desired Slack channel where you want to receive notifications.
After selecting the channel, Slack will generate a Webhook URL for you.
Webhook URL: Copy the Webhook URL provided by Slack and add it to your alerting system’s configuration under the contact points for Slack notifications.
Desired Channel: While setting up the Webhook, you'll have already selected the specific Slack channel where notifications will be sent. Ensure this channel is actively monitored so your team is instantly informed when an alert is triggered.
With the Webhook properly configured, every time the alert condition is met, you'll receive a message in the specified Slack channel.
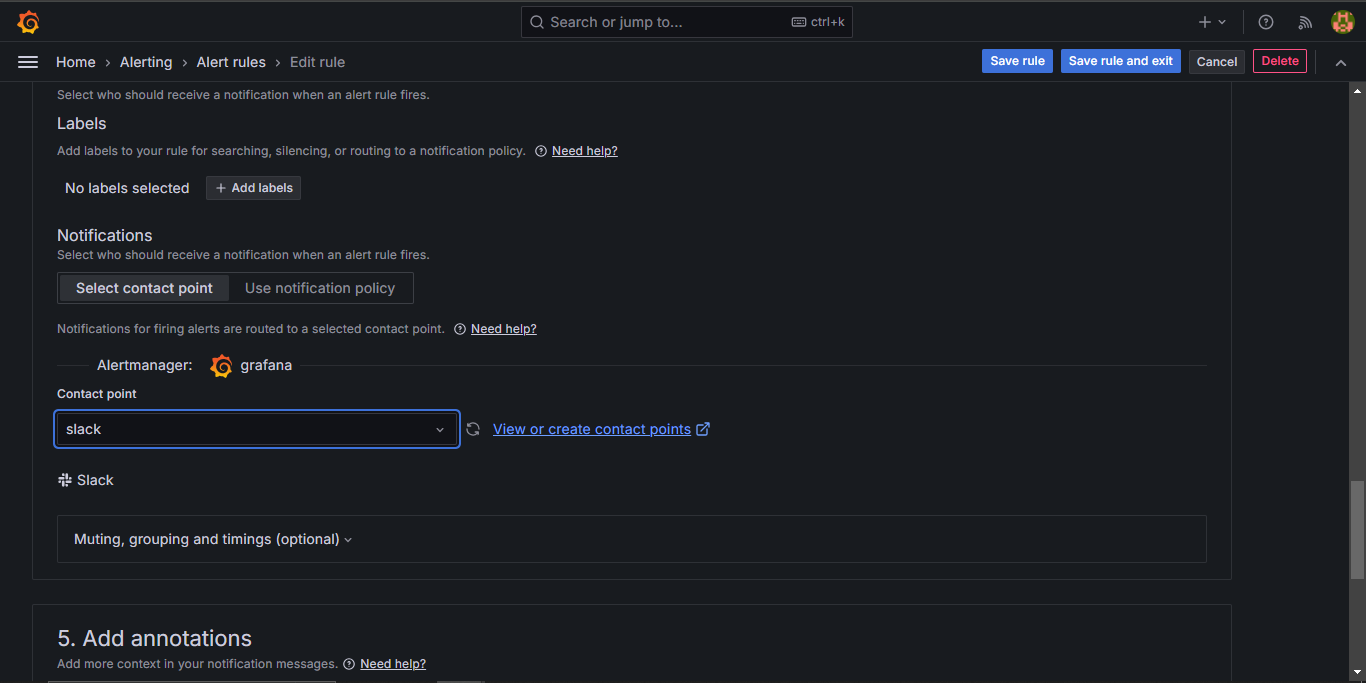

And that's it! You've successfully set up an alert rule for CPU usage and configured Slack notifications to keep you updated in real-time.
Subscribe to my newsletter
Read articles from Aditya Jaishi directly inside your inbox. Subscribe to the newsletter, and don't miss out.
Written by
