Instrumenting FastAPI Services with OpenTelemetry, Grafana, and Tempo
 Aditya Dubey
Github: https://github.com/adityawdubey/Instrumenting-FastAPI-using-OpenTelemetry
In today’s cloud-native environments, end-to-end observability is essential for understanding the behavior and performance of your microservices. As applications become more distributed, it becomes crucial to monitor them comprehensively, across infrastructure, networks, databases, and more. This is where Application Performance Monitoring (APM) comes in, providing deep insights to help you quickly detect, troubleshoot, and resolve performance issues.
To understand our FastAPI application better, we can use OpenTelemetry for tracing and observability, while Grafana and Tempo will help visualize and store traces. In this blog post, we’ll go through how to instrument FastAPI microservices. I’ll also show you how to deploy and visualize the collected traces using Grafana and Tempo, whether on Kubernetes or local setups.
Let's dive into the details.
Introduction to Observability with OpenTelemetry, Grafana, and Tempo
What is Observability?
Observability is the ability to understand what’s happening inside your system by looking at the data it produces, such as logs, metrics, and traces. It’s like having a window into your system’s health and behavior, helping you quickly spot and fix issues. In modern software, especially when using microservices, observability is key to keeping things running smoothly. It gives you the tools to monitor, troubleshoot, and improve performance by collecting and analyzing data from different parts of your application.
Logs: Text-based data about events that happen in a system, useful for post-mortem analysis.
Metrics: These are numerical data points, like response times or memory usage, collected over time. Metrics help you track the performance and health of your system.
Tracing: Tracing tracks the flow of a request as it moves through your system, especially across multiple microservices. It provides a detailed, step-by-step view of how different parts of the system work together and helps identify bottlenecks or failures.
Logs and metrics alone aren't always enough to fully understand what's happening in a complex, distributed system. Tracing helps fill in the gaps by showing how requests travel across microservices and where they might encounter issues like latency or failures.
Now that we understand why observability is critical, let’s explore how we can achieve it effectively using OpenTelemetry.
Why OpenTelemetry?
OpenTelemetry is an open-source project that standardizes the collection of telemetry data and supports multiple programming languages and systems. With OpenTelemetry, you can collect logs, metrics, and traces in a consistent format. This makes it easier to integrate with observability tools like Grafana, Jaeger, Prometheus, Dynatrace, and Datadog.
OpenTelemetry provides:
APIs for generating telemetry data.
SDKs for various programming languages, including Python, Java, JavaScript, Go, etc.
Collectors to process and export data to multiple observability backends.
This makes OpenTelemetry a flexible and cost-effective choice for observability, as it is open-source and vendor-agnostic.
Now that we’ve established why OpenTelemetry is a great choice, let’s discuss what instrumentation is. Instrumentation involves adding code to your application to collect telemetry data, such as logs, metrics, and traces. This data helps you understand the performance and behavior of your application.
Let’s see how we can instrument your FastAPI microservices.
Types of Instrumentation
You can instrument your application using automatic, manual, or programmatic methods. Each approach offers different levels of control over how telemetry data is captured and processed.
Automatic Instrumentation
Automatic instrumentation allows you to collect telemetry data without changing your application code. This is done using monkey-patching, where OpenTelemetry dynamically rewrites methods and classes at runtime through instrumentation libraries. It offers a plug-and-play approach, reducing development effort while ensuring you can still trace and monitor your system.
Steps for Automatic Instrumentation:
Set up a virtual environment: First, create a dedicated virtual environment for your FastAPI app to keep dependencies isolated.
Install OpenTelemetry: Next, install the OpenTelemetry distribution along with any specific instrumentation packages your application needs, like those for FastAPI and HTTPx.
Run the Bootstrap Command: Use the OpenTelemetry bootstrap command, which will automatically install all necessary instrumentation libraries for you.
Launch Your Application: Finally, start your FastAPI app using the
opentelemetry-instrumentcommand. This will enable automatic instrumentation right out of the box, capturing traces from your application without any additional configuration.
Refer to this link for more detailed info: https://opentelemetry.io/docs/zero-code/python/example/
from fastapi import FastAPI

app = FastAPI()

@app.get("/server_request")
async def server_request(param: str):
    return {"message": "served", "param": param}
In this example, telemetry data (e.g., traces and spans) will be automatically captured for the /server_request route without needing to modify the code further. You can extend this with various instrumentation libraries for supported frameworks like FastAPI, HTTPx, SQLAlchemy, and more.
Automatic instrumentation via opentelemetry-instrument is limited to the options exposed by environment variables or the command line. If you require further customization of telemetry pipelines, consider using programmatic or manual instrumentation.
Automatic instrumentation is best when you want quick and easy integration with minimal code changes. It is ideal for out-of-the-box instrumentation of common libraries like FastAPI and HTTP.
Manual Instrumentation
Manual instrumentation gives you complete control over which parts of your application are instrumented. This approach requires you to explicitly define tracers, spans, and attributes in your code, making it ideal for capturing custom telemetry data with fine granularity in critical parts of your application (e.g., database queries, complex computations).
Example - Manually Instrumented FastAPI Route
from fastapi import FastAPI
from opentelemetry import trace
from opentelemetry.propagate import extract
from opentelemetry.instrumentation.wsgi import collect_request_attributes

app = FastAPI()
tracer = trace.get_tracer(__name__)

@app.get("/server_request")
async def server_request(param: str):
    with tracer.start_as_current_span(
        "server_request",
        context=extract({}),  # In a real scenario, extract from headers
        kind=trace.SpanKind.SERVER,
        attributes={"param": param}
    ):
        return {"message": "served", "param": param}
In this example:
Tracer: Creates spans to represent units of work in the application.
Span: Tracks the time and metadata (e.g., attributes) of an operation, such as the server_request route.
Attributes: Custom metadata added to spans for richer tracing information.
Programmatic instrumentation
Programmatic instrumentation is a hybrid approach, sitting between automatic and manual methods. It requires minimal code changes and uses OpenTelemetry’s instrumentors to trace supported libraries (e.g., Flask, FastAPI, HTTPx). This method offers more flexibility than the automatic approach, allowing you to control specific settings, such as excluding certain routes from tracing.
Example - Programmatically Instrumented FastAPI Route:
from fastapi import FastAPI
from opentelemetry.instrumentation.fastapi import FastAPIInstrumentor

app = FastAPI()

# Programmatically instrument the FastAPI app
FastAPIInstrumentor.instrument_app(app)

@app.get("/server_request")
async def server_request(param: str):
    return {"message": "served", "param": param}
In this case, we are using the FastAPIInstrumentor from OpenTelemetry’s instrumentation library to instrument the FastAPI application. This automatically captures traces for incoming requests while still giving us the flexibility to exclude certain routes or endpoints.
Function-Level Instrumentation
In complex systems, simply tracing HTTP requests may not provide enough granularity. Function-level instrumentation allows you to trace specific function calls, such as database queries or external API calls, providing deep visibility into performance bottlenecks.
Example: Instrumenting a Function
from opentelemetry import trace

tracer = trace.get_tracer(__name__)

def expensive_operation():
    with tracer.start_as_current_span("expensive_operation") as span:
        # Perform expensive work here
        result = "expensive result"
        span.set_attribute("result", result)
        return result

@app.get("/expensive")
async def expensive_route():
    result = expensive_operation()
    return {"result": result}
By tracing at the function level, you can check the performance of specific tasks and find bottlenecks. To keep your function's logic unchanged, you can use a decorator. This way, you capture detailed trace data without altering the function's main logic.
OpenTelemetry, Tempo, Loki, Prometheus and Grafana: The Open-Source Observability Stack
After collecting your traces with OpenTelemetry, you need a way to store and visualize them. This is where Grafana and Tempo come in. Grafana provides an easy-to-use dashboard interface, while Tempo is a scalable, distributed tracing backend that can store and retrieve traces efficiently.
Tempo is built for high-throughput systems, systems that generate massive amounts of trace data, and organizations looking for a low-cost, scalable tracing solution.
Grafana is one of the most popular open-source tools for visualizing telemetry data. It supports a wide range of data sources, including Tempo, Prometheus, InfluxDB, Loki (for logs), and more. With Grafana, you can visualize traces alongside logs and metrics, allowing for a more unified and comprehensive monitoring experience.
Setting Up FastAPI Microservices
To demonstrate OpenTelemetry tracing in FastAPI, we’ll set up two FastAPI microservices. You can run these on separate ports locally, or better yet, deploy them using Kubernetes.
Basic FastAPI Service Setup
Here is a simple example of two FastAPI services: Service A and Service B. These services will communicate asynchronously using the httpx library for making HTTP requests.
❏ /service_a/main.py
from fastapi import FastAPI
import requests
from otel_config import configure_instrumentation, instrument_fastapi_app

# Configure OpenTelemetry instrumentation
configure_instrumentation()

app = FastAPI()

# Instrument FastAPI for OpenTelemetry
instrument_fastapi_app(app)

@app.get("/call-service-b")
def call_service_b():
    # Make a request to Service B (running on port 8001)
    response = requests.get("http://localhost:8001/service_b")
    return {"response_from_service_b": response.json()}
In this example, Service A makes an asynchronous HTTP call to Service B using the httpx.AsyncClient. Both services are instrumented with OpenTelemetry, enabling the collection of traces.
❏ /service_a/otel_config.py
import os

from opentelemetry import trace
from opentelemetry.sdk.resources import Resource
from opentelemetry.sdk.trace import TracerProvider
from opentelemetry.sdk.trace.export import BatchSpanProcessor
from opentelemetry.sdk.resources import SERVICE_NAME
from opentelemetry.exporter.otlp.proto.grpc.trace_exporter import OTLPSpanExporter
from opentelemetry.instrumentation.requests import RequestsInstrumentor
from opentelemetry.instrumentation.fastapi import FastAPIInstrumentor
from opentelemetry.instrumentation.httpx import HTTPXClientInstrumentor
from opentelemetry.instrumentation.kafka import KafkaInstrumentor


class OTLPProvider:
    """
    Configures OpenTelemetry with OTLP Exporter.
    """
    def __init__(
            self,
            service_name: str,
            exporter_endpoint: str,
    ) -> None:

        self._provider = TracerProvider(
            resource=Resource(attributes={SERVICE_NAME: service_name}),
            active_span_processor=BatchSpanProcessor(
                OTLPSpanExporter(
                    endpoint=exporter_endpoint,
                )
            ),
        )

    @property
    def provider(self) -> TracerProvider:
        return self._provider


def configure_instrumentation():
    """
    Configures OpenTelemetry instrumentation for requests and FastAPI.
    """
    tempo_endpoint = os.getenv('TEMPO_ENDPOINT', 'http://localhost:4317')
    provider = OTLPProvider("service_a", tempo_endpoint)
    trace.set_tracer_provider(provider.provider)

# Instrument HTTP requests, HTTPX client, and Kafka to enable tracing
    RequestsInstrumentor().instrument()
    HTTPXClientInstrumentor().instrument()
    KafkaInstrumentor().instrument()


def instrument_fastapi_app(app):
    # This will automatically create spans for incoming HTTP requests and other FastAPI-specific operations
    FastAPIInstrumentor.instrument_app(app)
The FastAPIInstrumentor helps us to automatically instrument all incoming requests. The httpx.AsyncClient() is used for making asynchronous requests between the services, and HTTPXClientInstrumentor instruments these outgoing requests, capturing the span data and linking it to the original trace. To export the trace data, we configure the OTLPSpanExporter to send traces to Tempo through the OpenTelemetry protocol (OTLP).
Now that you understand the benefits of using Grafana and Tempo for monitoring and tracing, let's go through the detailed steps required to deploy these tools alongside your FastAPI microservices.
Deploying FastAPI services, OpenTelemetry, Grafana, and Tempo
Deployment files

Build Docker Images for Your FastAPI Services
You’ll need to containerize your FastAPI applications so that they can be deployed in a consistent and reproducible environment, whether locally or in Kubernetes. To do this, navigate to each service’s directory and run the following Docker build commands:
docker build -t service_a -f service_a/Dockerfile docker tag service_a aniketdubey/service_a:latest docker push adityadubey/service_a:latest
docker build -t service_b -f service_b/Dockerfile docker tag service_b adityadubey/service_b:latest docker push aniketdubey/service_b:latest
These commands create Docker images for both service_a and service_b. The -t flag assigns a tag (name) to each image, which is essential for identifying and deploying the containers later on.
Deploy FastAPI Services on k8s
We’ll begin by creating a dedicated namespace for the FastAPI microservices to organize resources more effectively:
kubectl create namespace fastapi
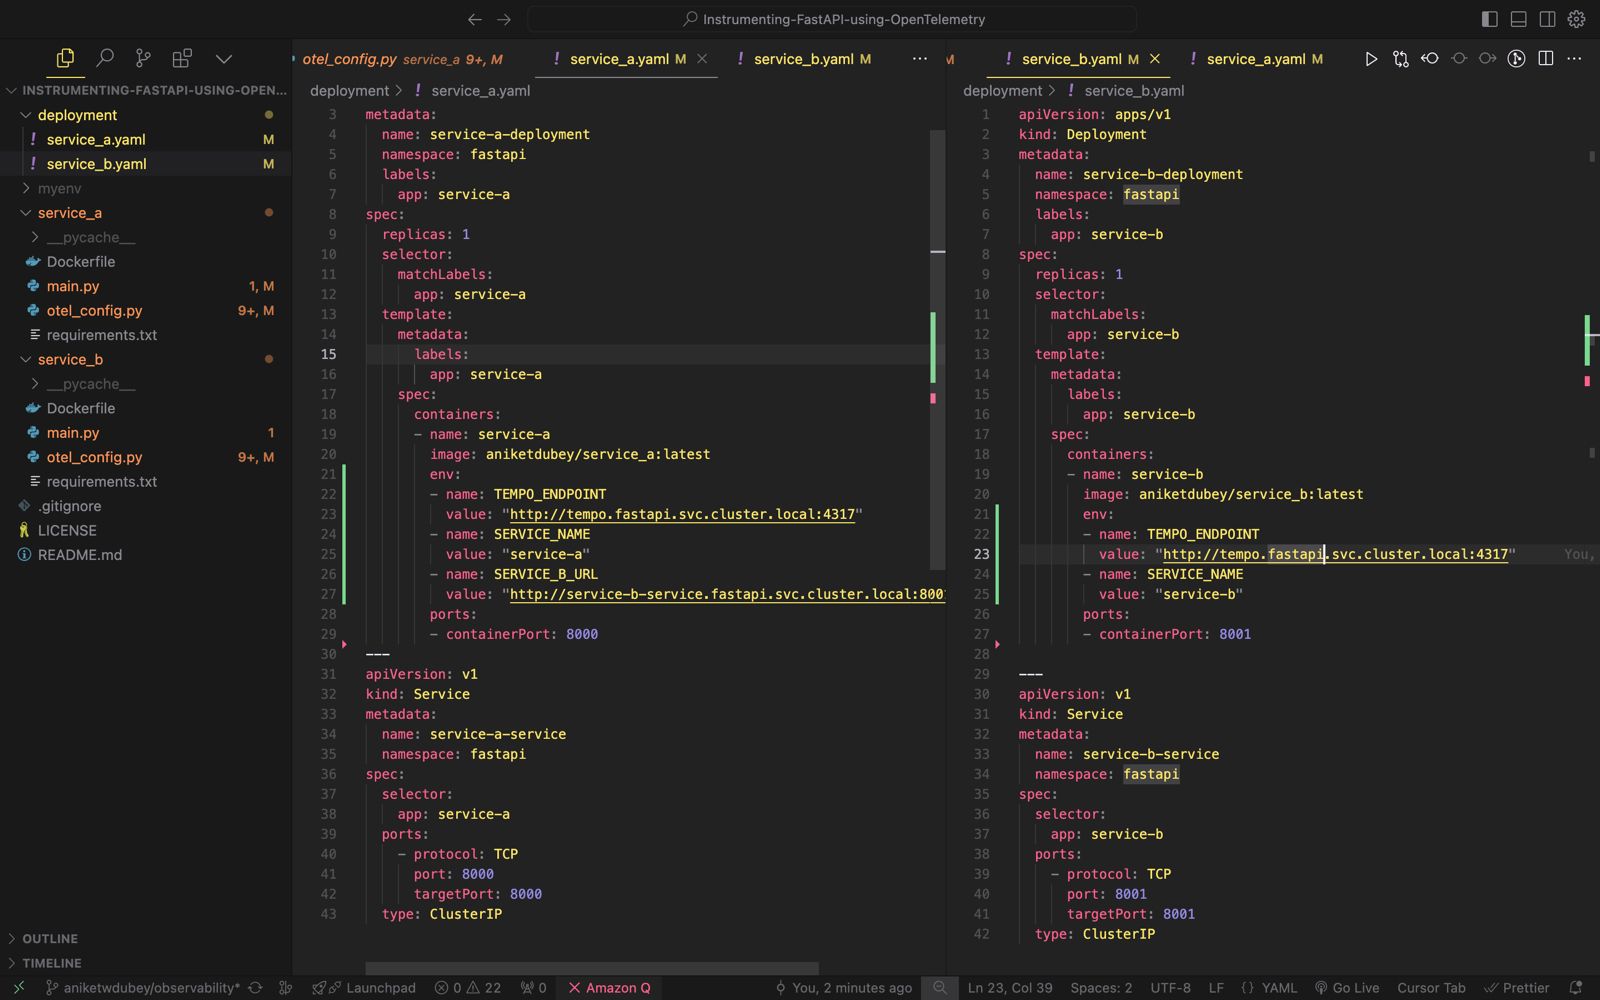
Once the namespace is created, you can deploy service_a and service_b by applying their respective YAML files (which should define the necessary Kubernetes configurations like deployments, services, etc.)
kubectl apply -f service_a.yamlkubectl apply -f service_b.yaml
Install Grafana and Tempo
To monitor and trace the behavior of your microservices, you’ll need to install Grafana (for visualization) and Tempo (for storing and querying traces).
helm repo add grafanahttps://grafana.github.io/helm-chartshelm install grafana grafana/grafana -n fastapihelm install tempo grafana/tempo -n fastapi
These commands will set up Grafana and Tempo in your Kubernetes environment, preparing them to receive and visualize traces from your FastAPI services.
Port forward to access services
Once your services and observability stack are deployed, you'll need to access them. In a typical Kubernetes setup, you can use port forwarding to expose your services locally.
kubectl port-forward svc/grafana 3000:80
You can now access Grafana by opening your browser and navigating to http://localhost:3000
Similarly,
kubectl port-forward svc/service-a-service 8000:8000
kubectl port-forward svc/service-b-service 8001:8001
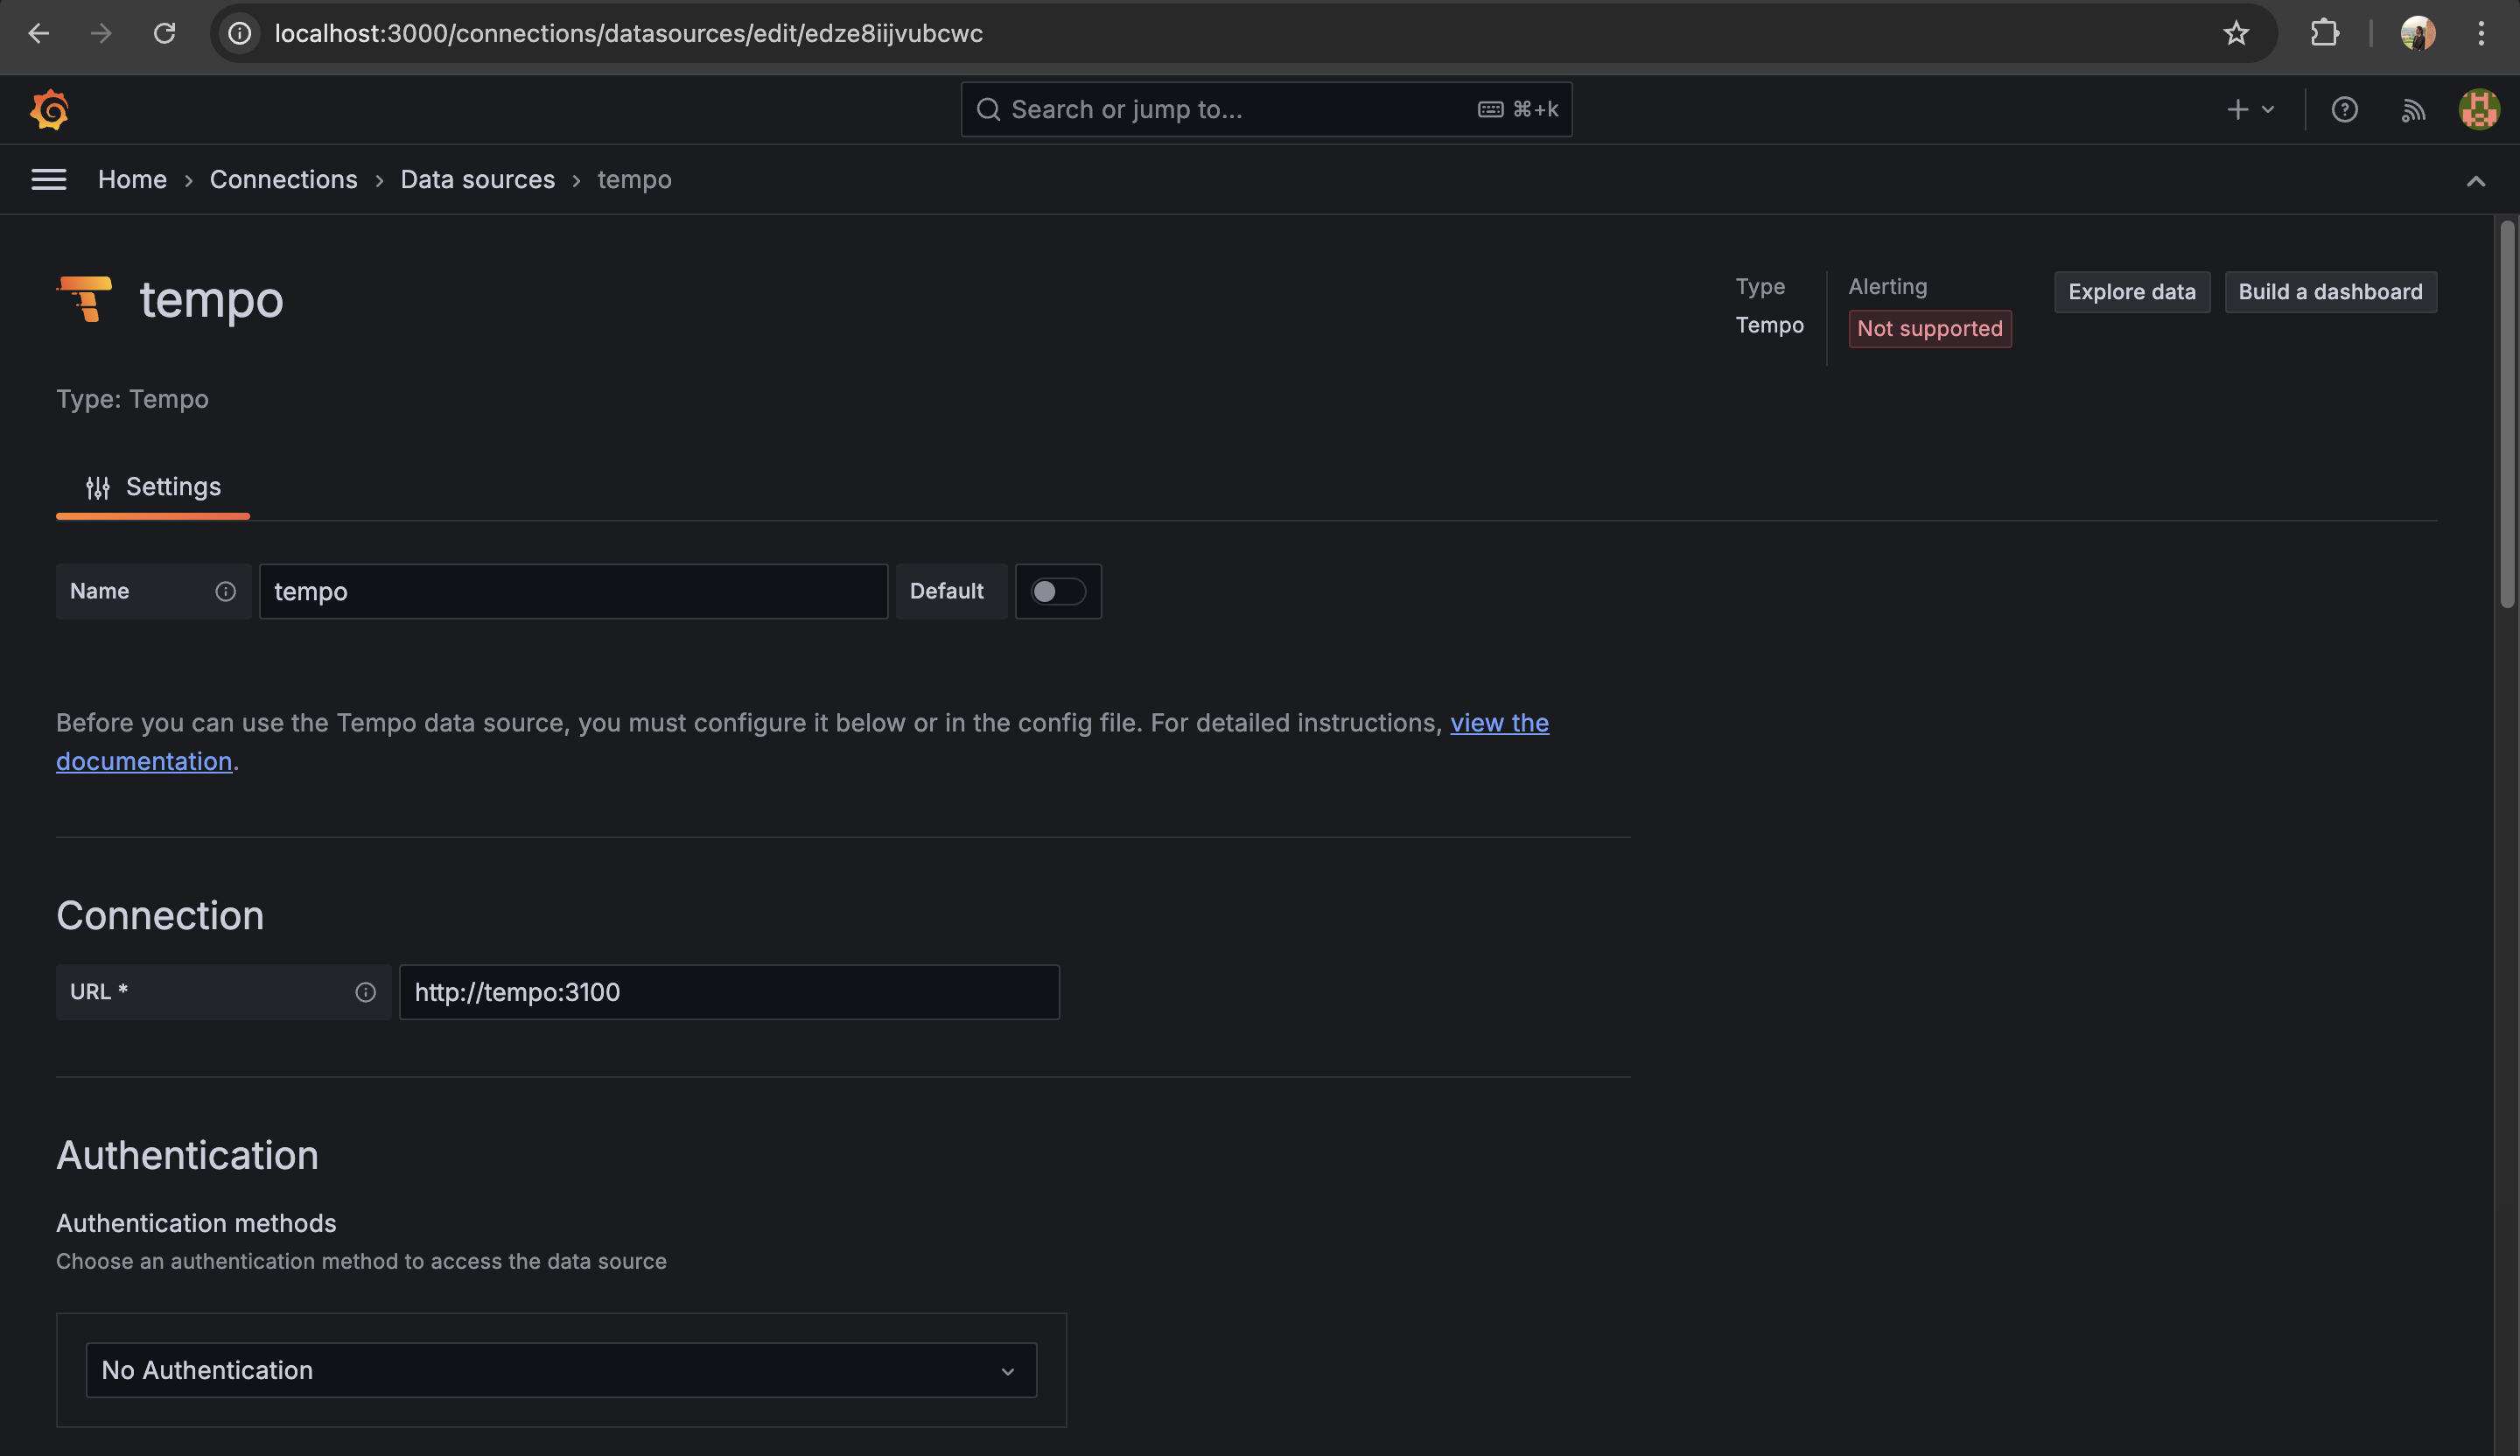
Add temp data source
With Grafana running, it’s time to integrate Tempo to visualize the traces collected from your FastAPI services. To do this:
Get grafana password
kubectl get secret --namespace fastapi grafana -o jsonpath="{.data.admin-password}" | base64 --decode ; echoOpen Grafana in your browser (
http://localhost:3000) and log in (default credentials are usuallyadmin/admin).Navigate to Configuration > Data Sources.
Click on Add Data Source and select Tempo from the list.
Enter the necessary details for Tempo (usually the default settings should work if Tempo is installed correctly).
Save the configuration.

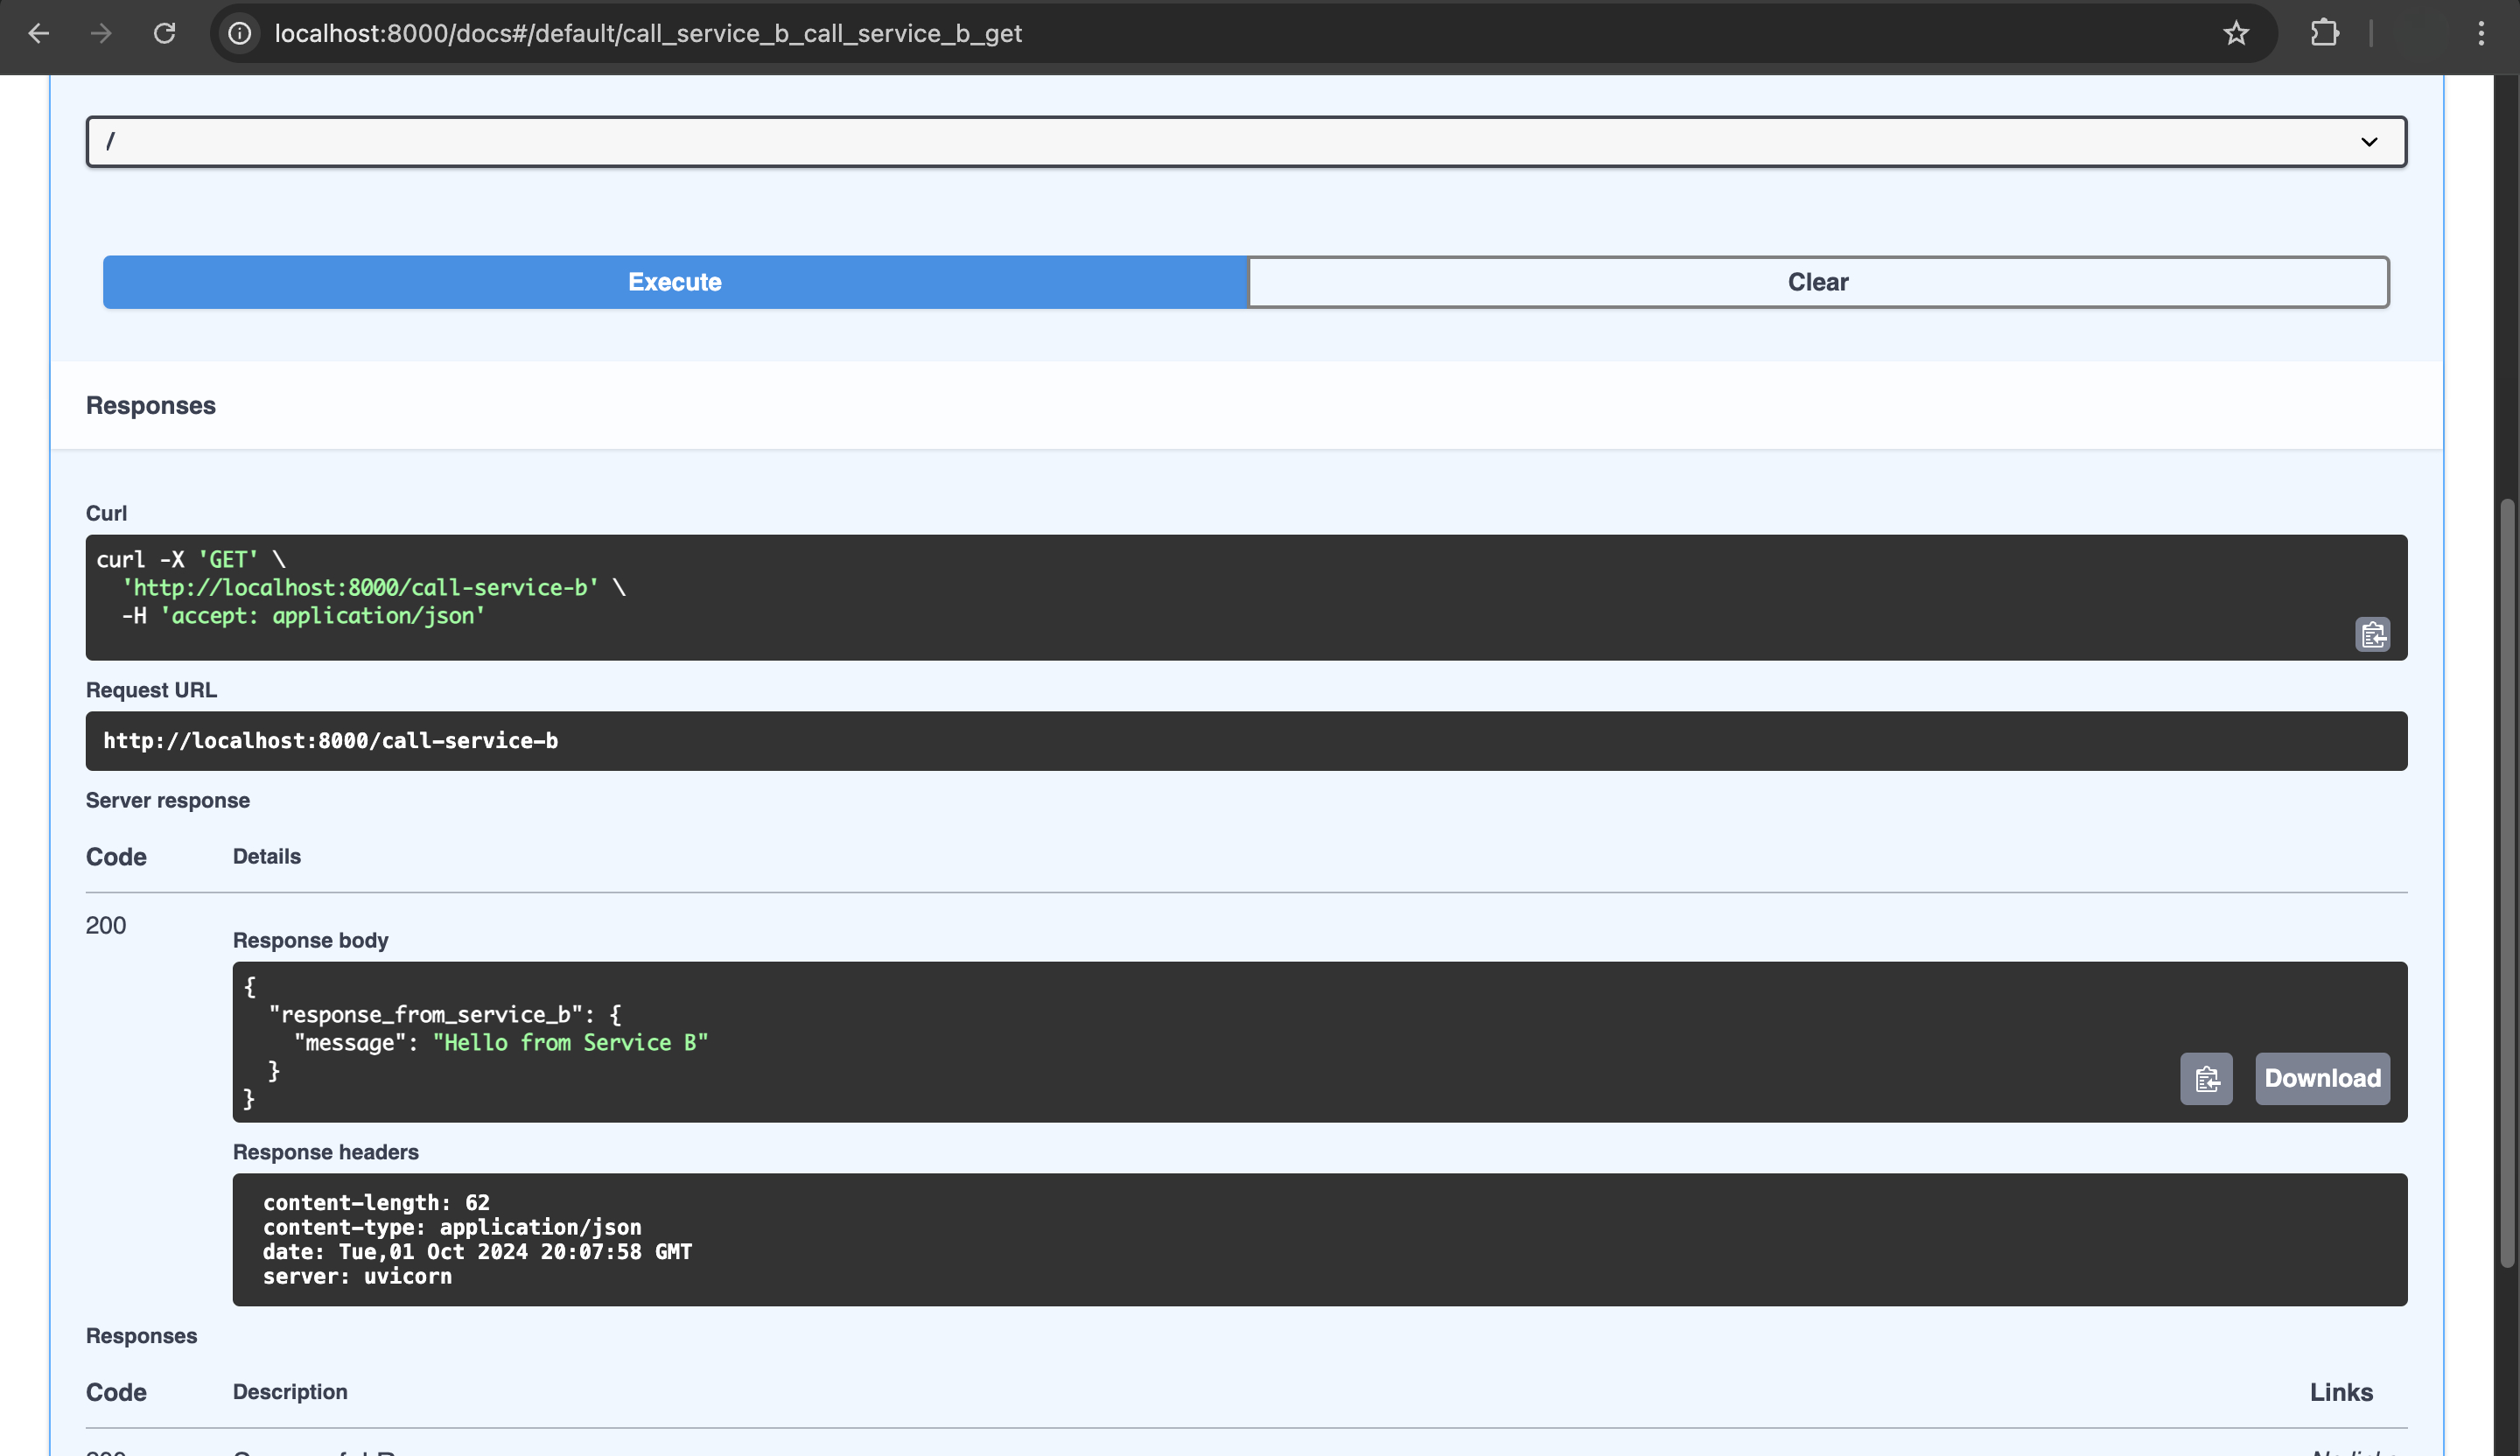
Open service_a docs and send req to service b

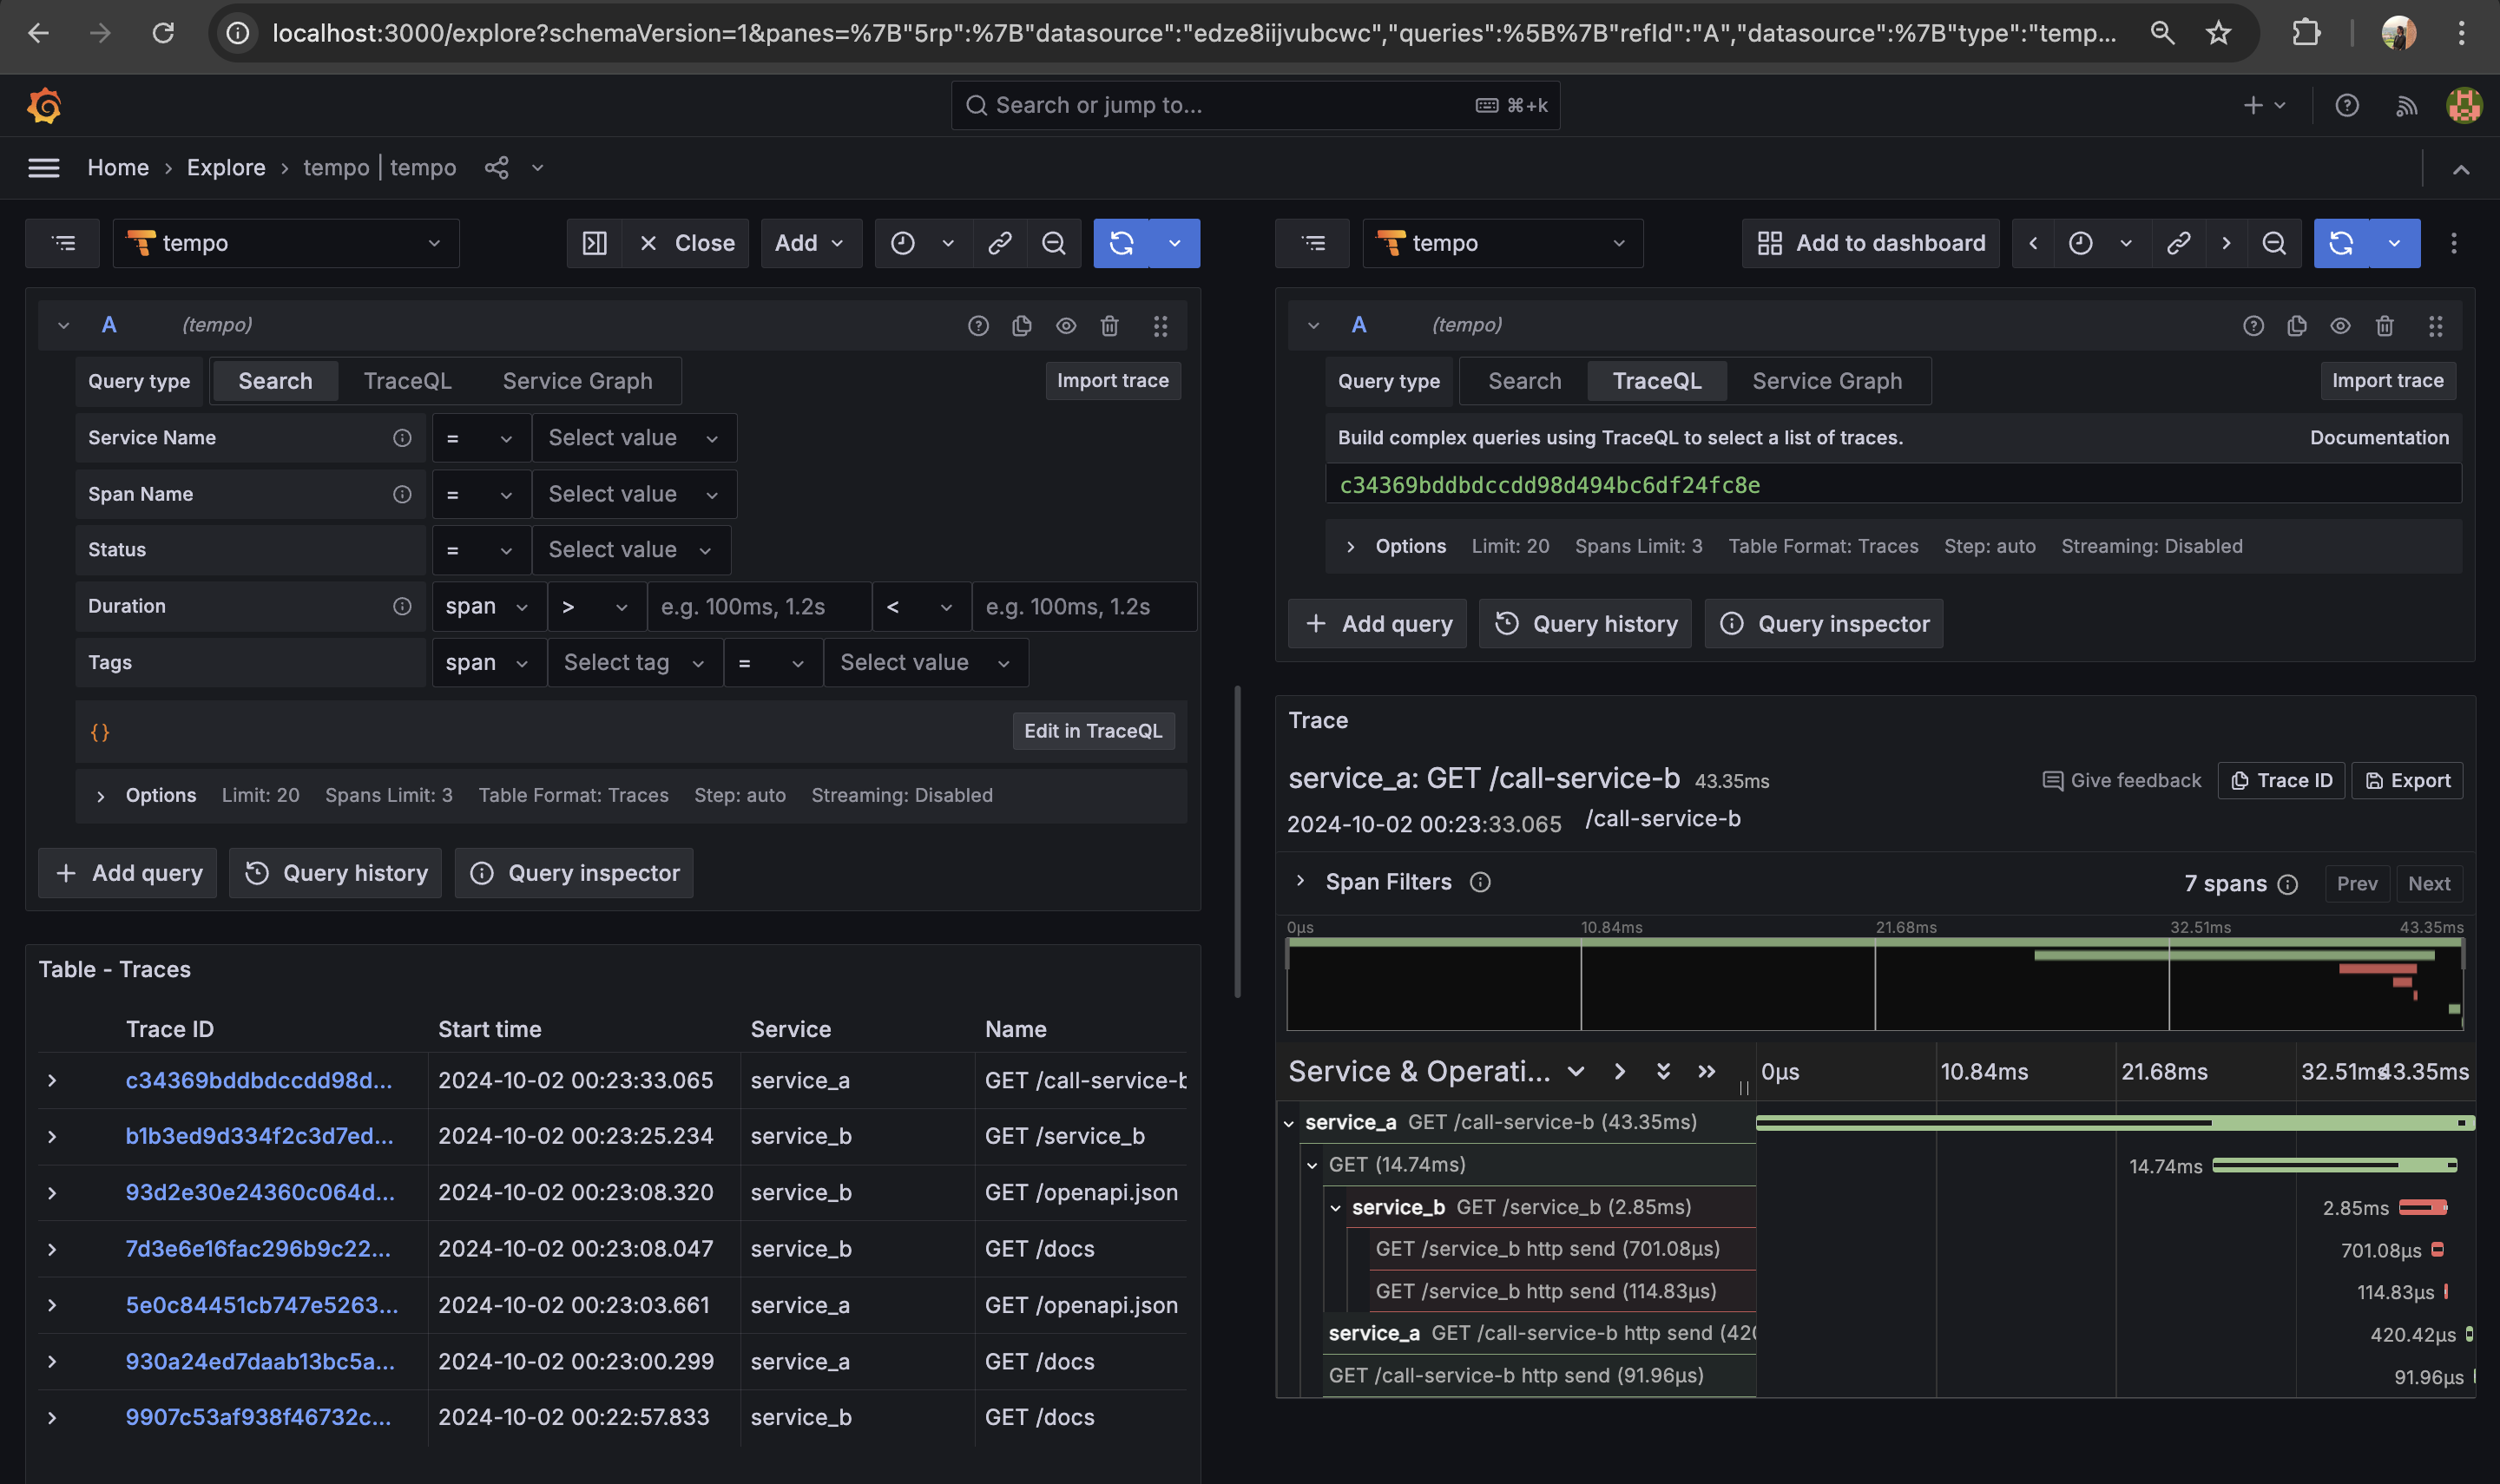
Check tempo explore
Once Tempo is integrated, you can explore your trace data in Grafana using the Explore tab. Traces from Service A to Service B will be displayed.

By instrumenting FastAPI services with OpenTelemetry, you gain deep insight into the lifecycle of requests across services. Using Grafana and Tempo, you can visualize and monitor the performance and health of your microservices, which is especially beneficial in distributed systems. This setup enables you to trace requests end-to-end, making it easier to debug and optimize asynchronous services running in cloud-native environments.
FAQs
What is the difference between monitoring and observability?
Monitoring is the process of collecting and analyzing data, like logs and metrics, to ensure that systems are operating correctly. It’s more about keeping track of known issues and checking if things are running smoothly.
Observability, on the other hand, is a broader concept. It helps you understand what’s happening inside a system by looking at its outputs—such as logs, metrics, and traces. Observability focuses on gaining deeper insights into the system’s internal workings, especially when problems arise that you didn’t expect.
Why should I choose OpenTelemetry over other tracing systems?
OpenTelemetry is vendor-agnostic, supports multiple programming languages, and integrates easily with many backends like Jaeger, Tempo, and Datadog. It unifies metrics, logs, and tracing in one framework.
Can OpenTelemetry integrate with paid solutions like Datadog or Dynatrace?
Yes! OpenTelemetry can export telemetry data (like traces, metrics, and logs) to paid observability platforms such as Datadog or Dynatrace.
How does distributed tracing help in debugging?
Distributed tracing allows you to track the journey of a request as it moves through different parts of your system, especially in a microservices architecture where multiple services work together. It provides a clear view of how a request flows across different services, showing you where it slows down or where errors might occur.
By visualizing the entire path of a request, you can easily pinpoint where issues like latency (slow response times) or failures happen, making it much simpler to identify and fix the root cause of problems.
Conclusion
In this blog post, we’ve explored how to instrument FastAPI services using OpenTelemetry and visualize traces with Grafana and Tempo. We’ve also discussed alternative paid solutions like Dynatrace and Datadog and provided an overview of other observability stacks.
As microservices architectures continue to evolve, having a robust observability stack is crucial for maintaining system reliability, reducing downtime, and ensuring quick identification of performance bottlenecks. Whether you choose open-source solutions like Grafana/Tempo or paid platforms like Datadog and Dynatrace, the key is to integrate observability into your workflow for a more resilient system.
References and Resources
Further Exploration
Beyond server-side metrics, incorporating Real-User Monitoring (RUM) tools can help you understand the performance from the end-user’s perspective, offering a more complete observability stack by tying client-side data with backend traces.
Set up automated alerting for system anomalies and integrate them with incident response platforms like PagerDuty or Opsgenie. This will help you respond faster when issues occur and ensure your system’s observability is directly tied to action.
eBPF (Extended Berkeley Packet Filter)enables deep observability into kernel-level operations without modifying your application code. It allows tracing of system calls, monitoring of network packets, and collection of granular system performance data. eBPF programs can attach to various kernel hooks to gather insights into real-time system activities. check: https://middleware.io/blog/ebpf-observability/ and https://isovalent.com/blog/post/next-generation-observability-with-ebpf/
Subscribe to my newsletter
Read articles from Aditya Dubey directly inside your inbox. Subscribe to the newsletter, and don't miss out.
Written by

Aditya Dubey
Aditya Dubey
I am passionate about cloud computing and infrastructure automation. I have experience working with a range of tools and technologies including AWS- Cloud Development Kit (CDK), GitHub CLI, GitHub Actions, Container-based deployments, and programmatic workflows. I am excited about the potential of the cloud to transform industries and am keen on contributing to innovative projects.