Excel-erate Your Finance Analysis: From Sales to P&L
 Limesh Mahial
Introduction
Hey, data enthusiasts! 👋 Remember my previous article on sales analysis? Well, we're taking it up a notch today. We're diving into the world of finance analytics, building on our existing data model to uncover some juicy financial insights. Don't worry if you missed the sales analysis post - you can still follow along, but I'd recommend checking it out for some extra context.
P&L 101: The Basics You Need to Know
Before we jump into the data, let's break down some key concepts:
P&L (Profit and Loss) Statement: This is the MVP of financial reports. It gives you a snapshot of a company's financial performance over a specific period - could be a month, quarter, or year.
Key Metrics: We're talking about the heavy hitters here - Net Sales, Cost of Goods Sold (COGS), Gross Margin, and Gross Margin %. These bad boys are crucial for evaluating a company's financial health, profitability, and pricing strategies.
Let's Get Our Hands Dirty: Adding Financial Data
First things first, we need to import our
fact_sales_monthly_with_costCSV file. This is where the ETL magic happens!After loading the file, I noticed it's pretty similar to our existing
fact_sales_monthlydata, but with two new columns:freight_costandmanufacturing_cost. Jackpot! 💰Instead of doing a full-on join (which crossed my mind), I decided to simply add these two columns to our existing
fact_sales_monthlytable. Work smarter, not harder, right?Time for some Power Query acrobatics:
Renamed
fact_sales_monthly_with_costtofinance refUpdated the source of
fact_sales_monthlyto=#"finance ref"Cleaned up unnecessary steps (source, navigation, and imported CSV) steps!
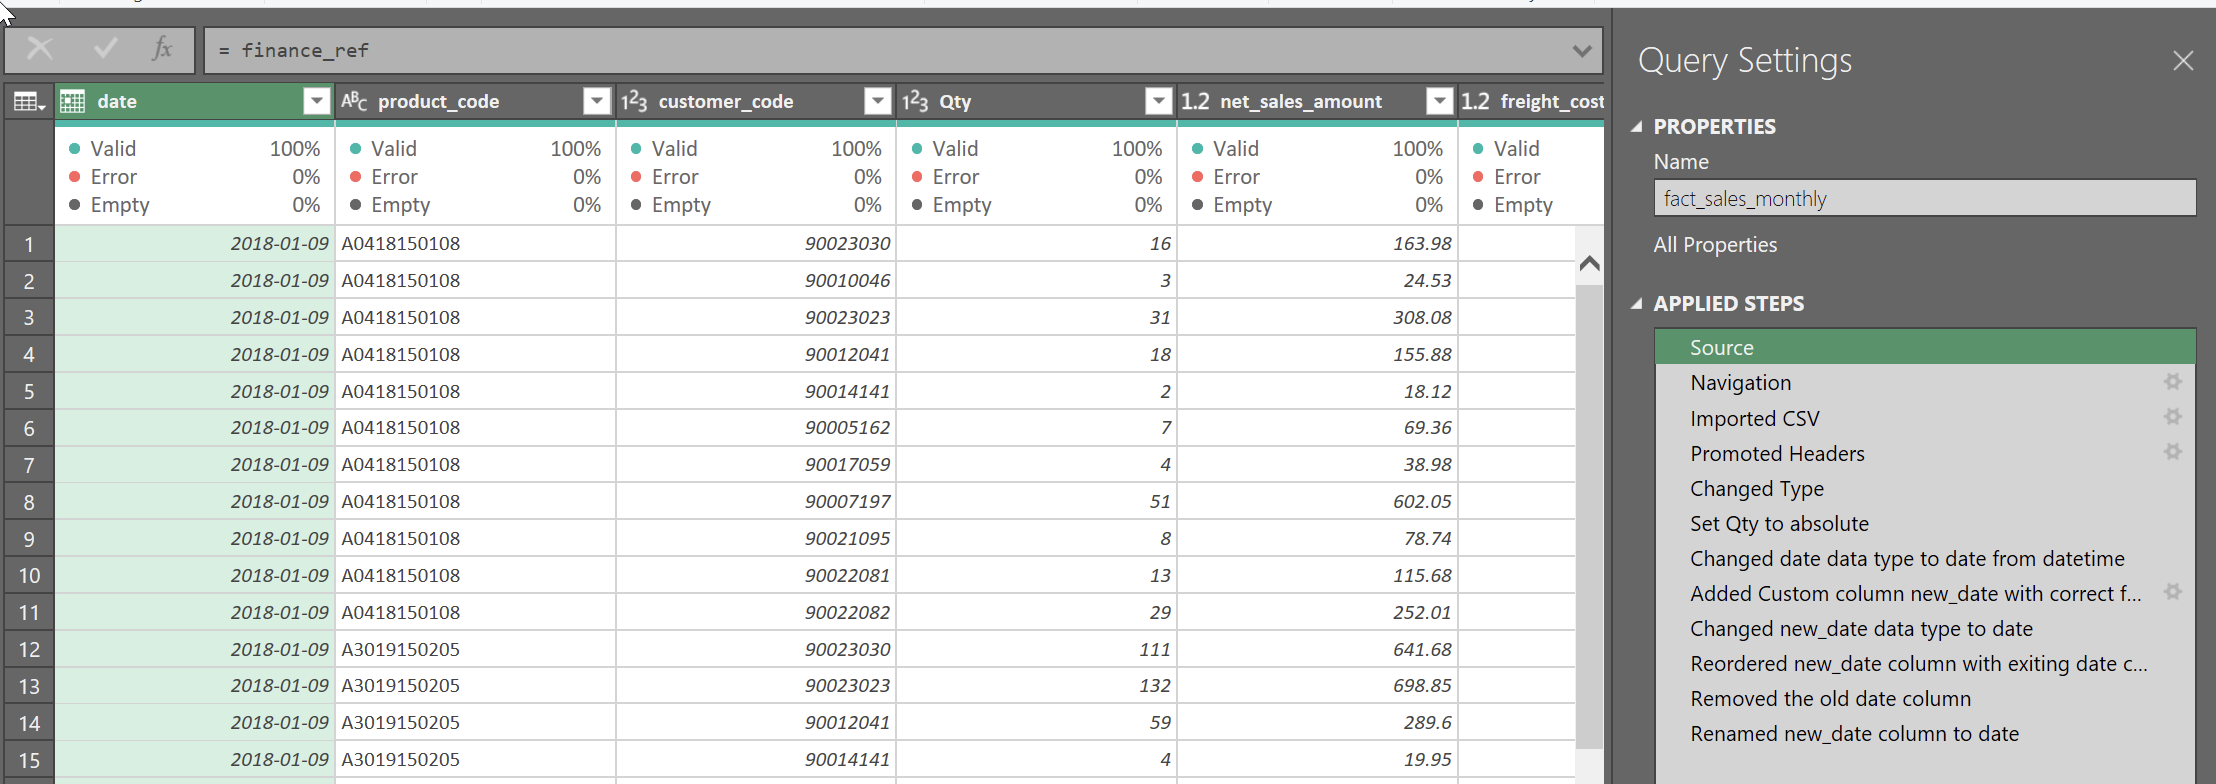
Renamed our updated table to
fact_sales_monthly_with_cost
Organized our queries:
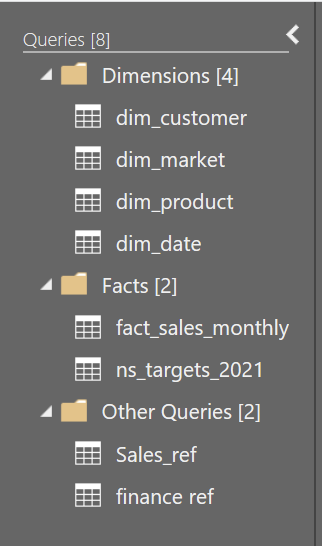
Checked our data model, and voilà!
freight_costandmanufacturing_costare now in the house.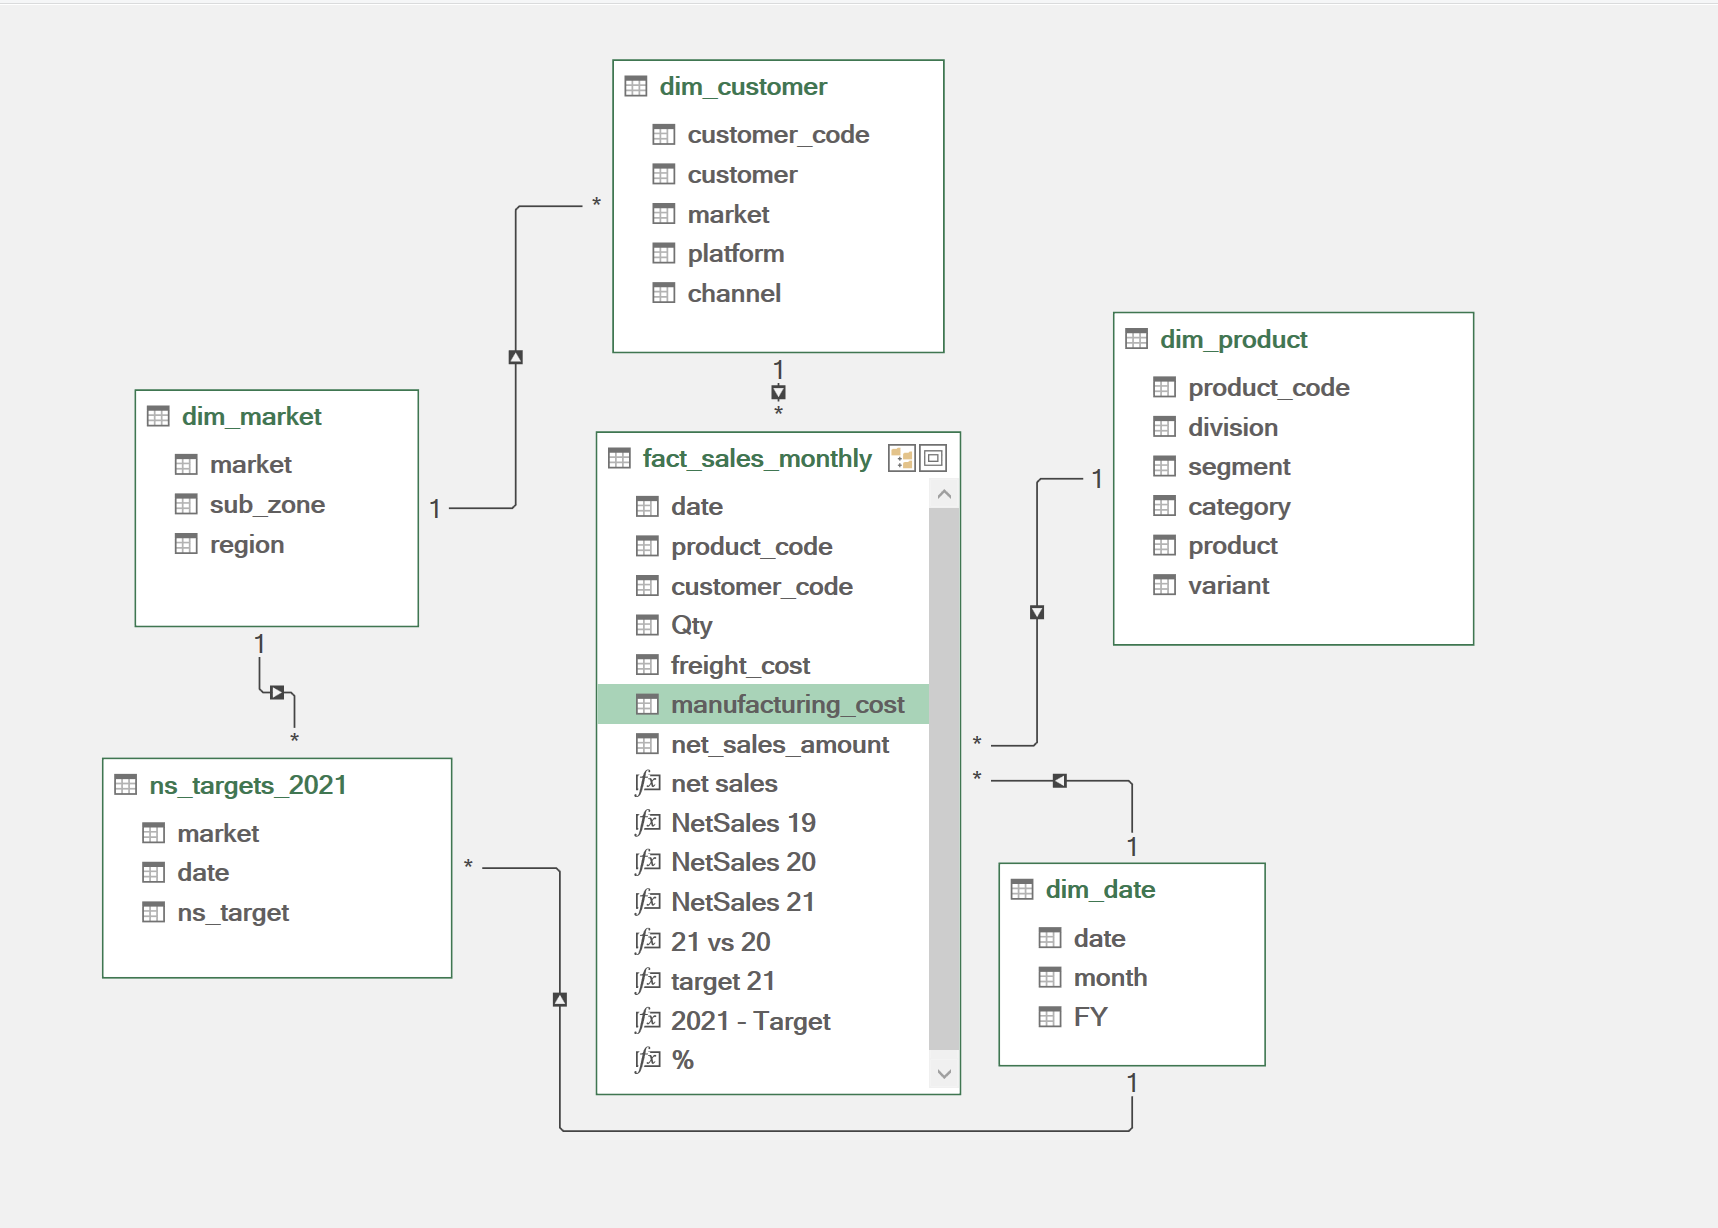
P&L by Year: Where the Real Fun Begins
Jumped into Power Pivot and created a new column for total_cogs
= fact_sales_monthly[freight_cost] + fact_sales_monthly[manufacturing_cost]Whipped up some new measures:
COGS:
=SUM(fact_sales_monthly[total_cogs])Gross Margin:
=[Net Sales] - [COGS]Gross Margin %:
=DIVIDE([Gross Margin], [net sales], 0)
Formatted our numbers into millions (because who doesn't love seeing those M's?)
For year-over-year comparisons, I went old school with Excel formulas:
Copy21 vs 20 = IFERROR(F10/E10, "")- Pro tip: Use IFERROR to handle any potential hiccups!
I went old school with Excel formulas
- Me: Spends 1 week working on DAX (some fun part)
Added some touch with conditional formatting, three-color scales, and data bars.
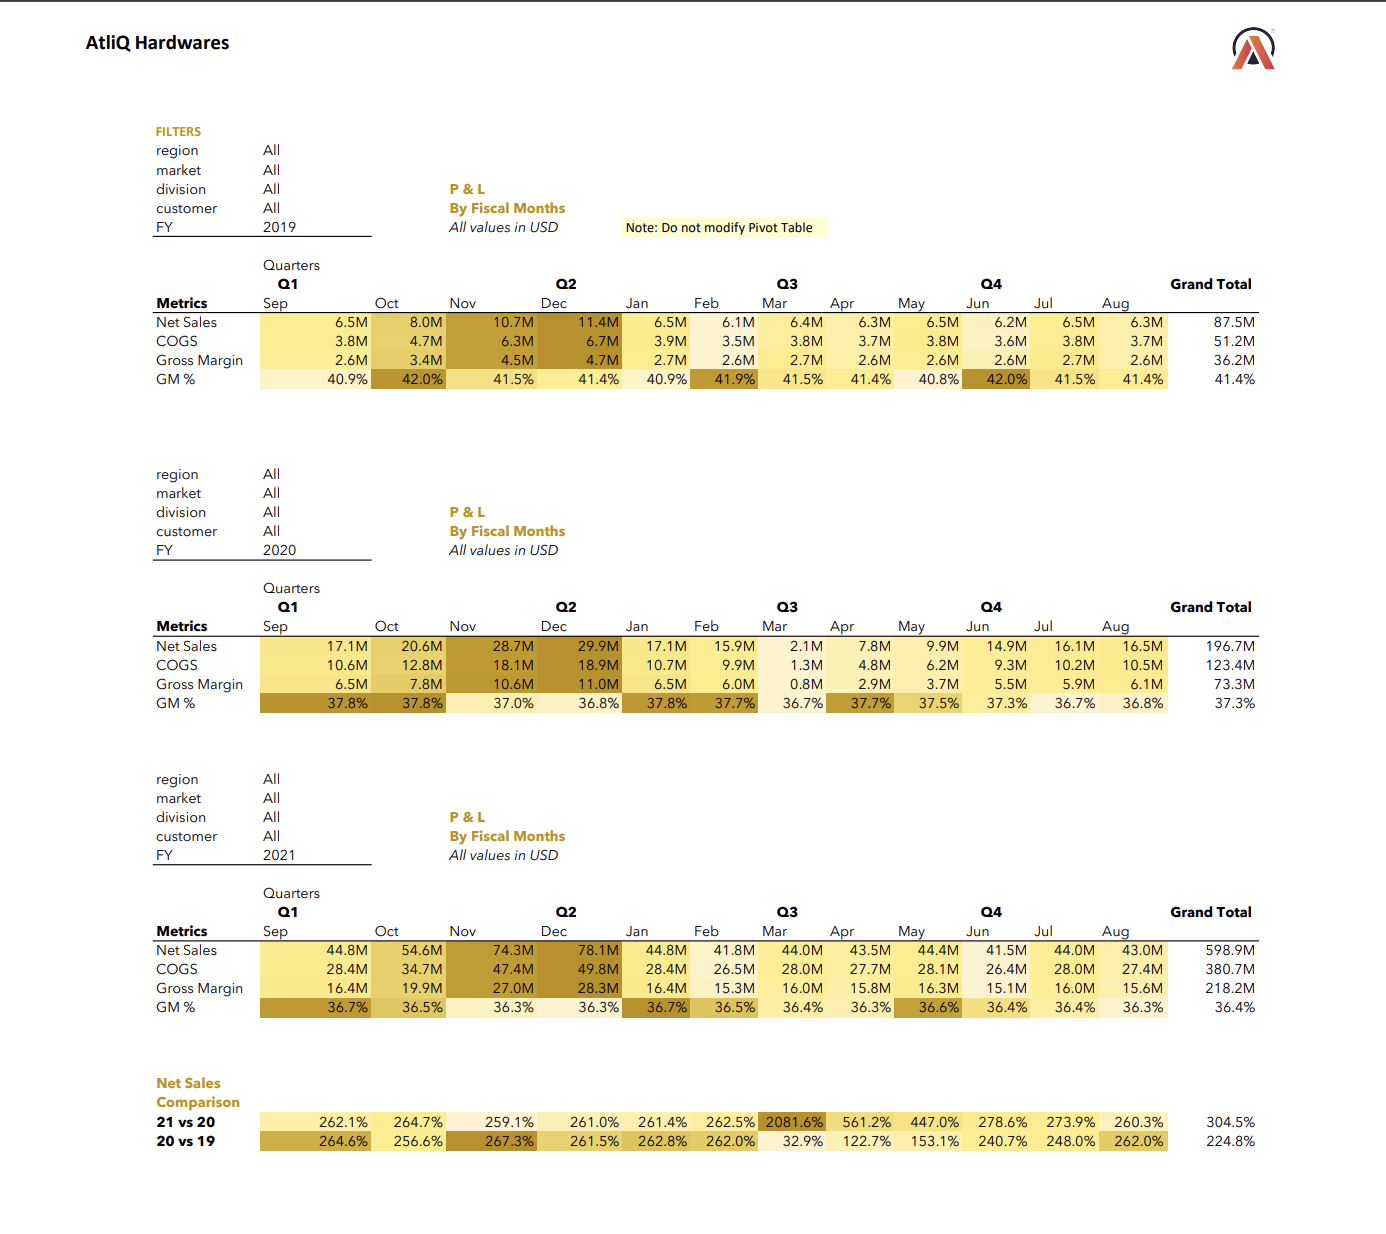
Here's a sneak peek at our P&L by Fiscal Year report:
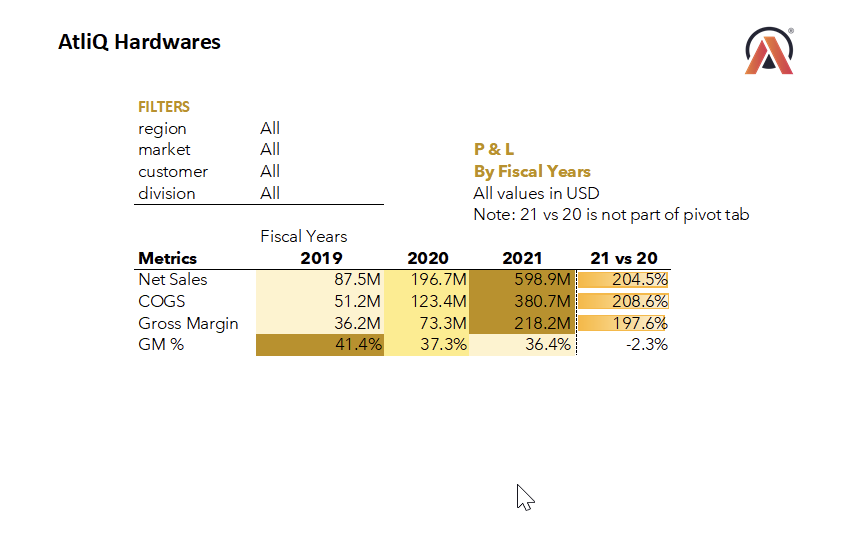
P&L Months and Quarters
Did you know that fiscal years can be different from calendar years? Mind. Blown. 🤯 At AtliQ, the fiscal year starts in September. So, we needed to do some fancy footwork in Power Pivot:
Added new columns:
mmm:
FORMAT([date], "MMM")fy_month_no:
MONTH(DATE(YEAR([date]), MONTH([date])+4, 1))quarter:
"Q" & ROUNDUP([fy_month_no]/3, 0)
Sorted our months by
fy_month_noto keep everything in fiscal order.Created P&L reports for FY 2019, 2020, and 2021.

Check out this beauty - our P&L by Quarters report:
Bonus Round:
Markets and Gross Margin %
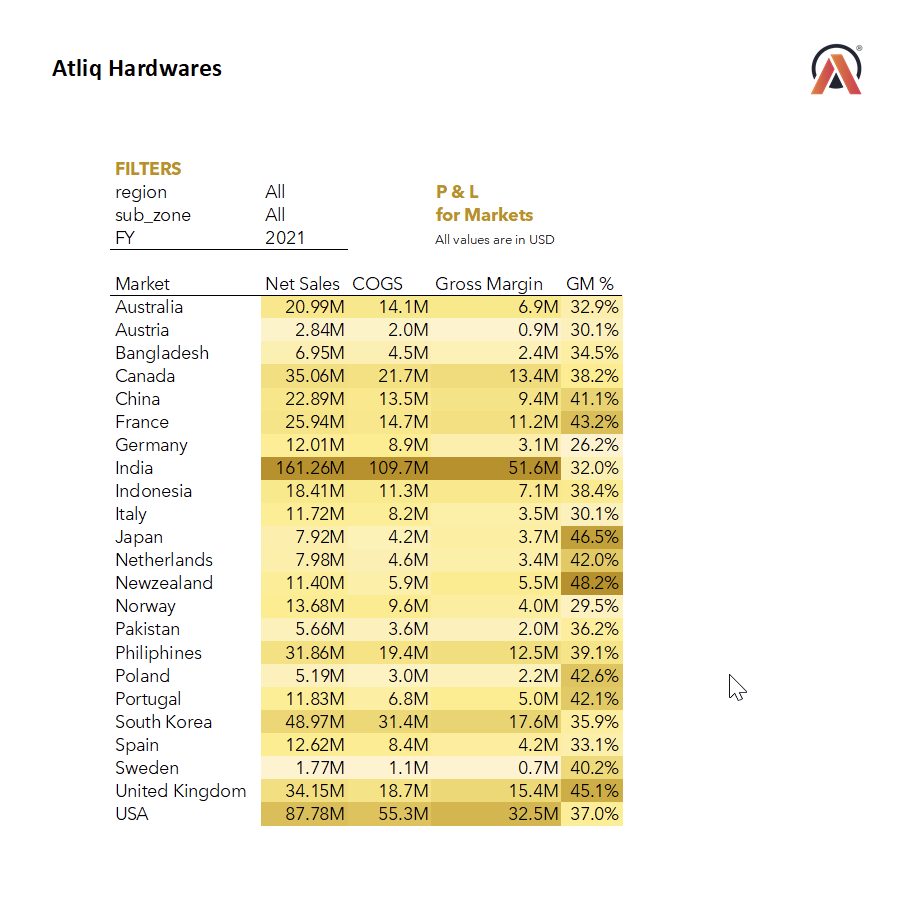
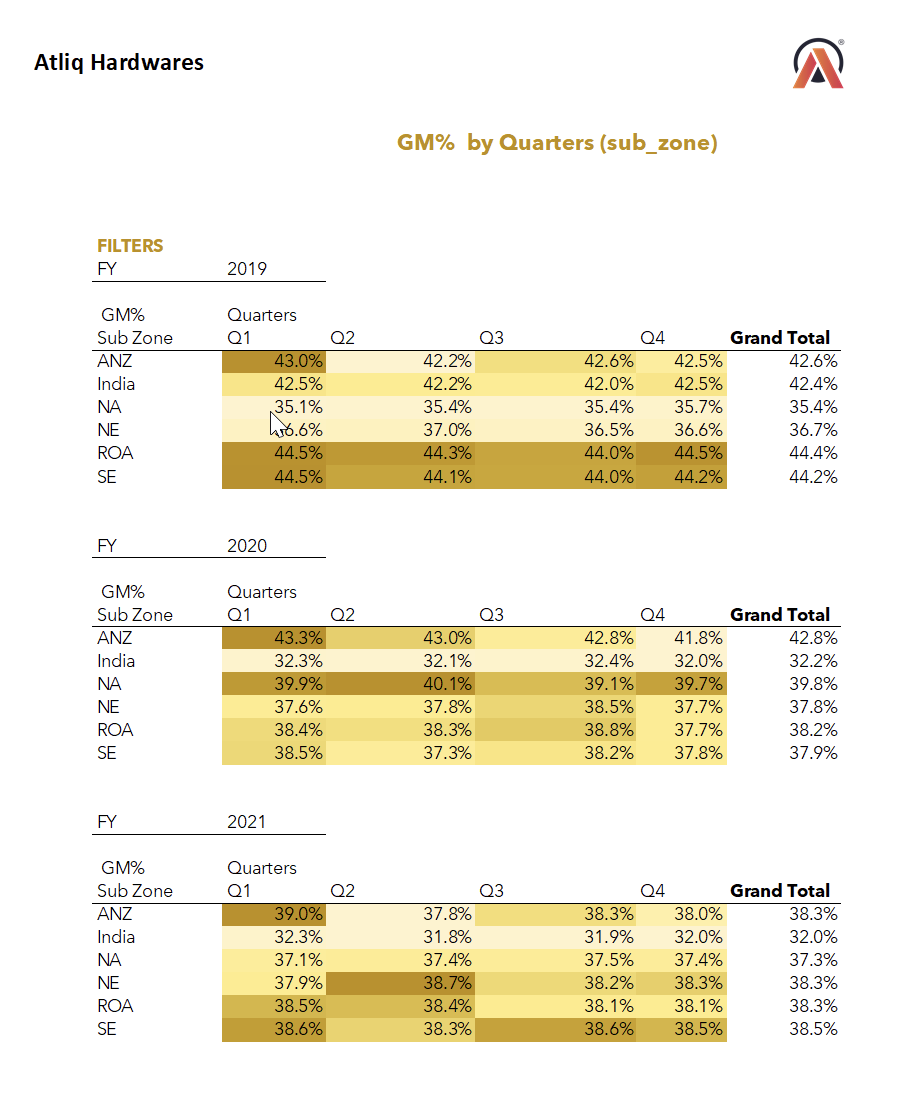
Because why stop there? We also whipped up:
P&L for Markets (Countries)
Gross Margin % by Quarters (Sub Zones)
And there you have it, folks! We've taken our sales analysis to the next level by incorporating financial data and creating insightful P&L reports. Remember, the real power of these reports lies in the stories they tell about your business. Use these insights to drive strategic decisions and improve overall financial performance.
Stay tuned for more adventures! Let's keep this data party going! 🎉📊
Subscribe to my newsletter
Read articles from Limesh Mahial directly inside your inbox. Subscribe to the newsletter, and don't miss out.
Written by
