Sales Performance Dashboard
 Ezekiel Balogun
WYSE-BUYER MEGA STORES
I carried out this project for Wyse-Buyer Mega Stores by creating an advanced data visualization using Microsoft Excel. The process began with data extraction, where I managed databases by querying relevant information from product, sales and customer tables using SQL. This foundational step allowed me to access and organize the necessary data for analysis.
Following the extraction, I employed Power Query in Excel to clean and manipulate the dataset. This involved removing inconsistencies, filling in missing values and ensuring that the data was in a usable format for analysis.
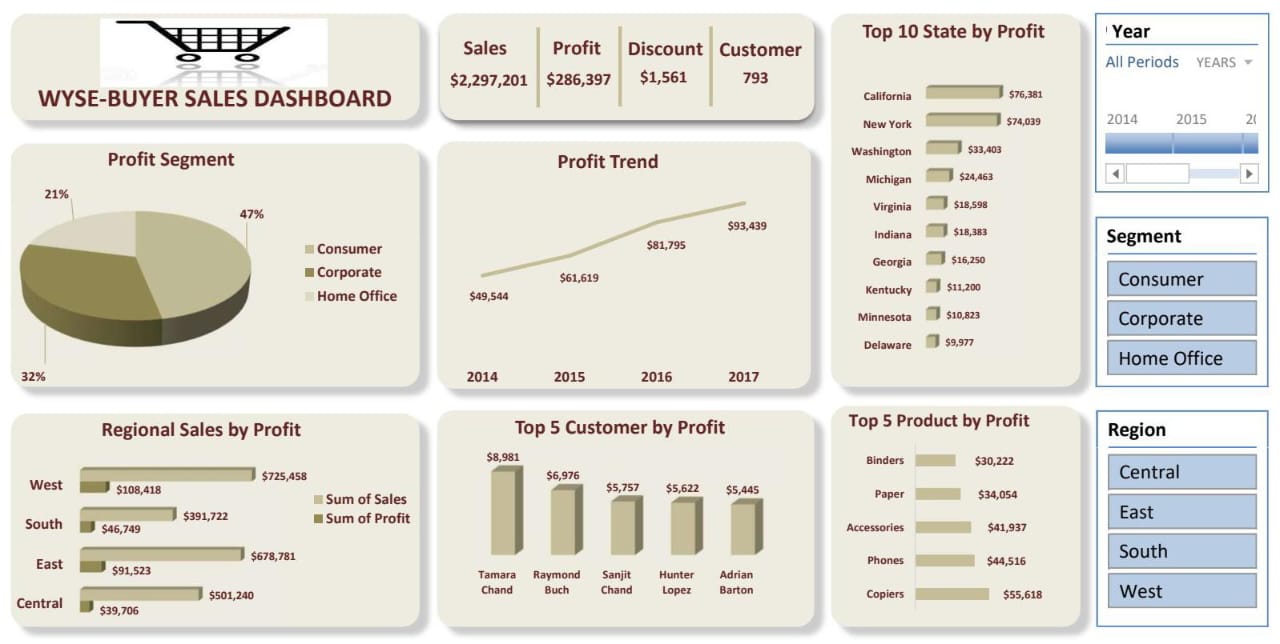
Once the data was properly cleaned, I utilized various charts and graphs to create an interactive dashboard with slicers and timeline to drill down. This dashboard generated critical insights, which include:
The top five products by profit
Profit segments
The top ten states by profit
The top five customers by profit
Regional sales performance
Profit trends between 2014 to 2017, and
Key Performance Indicators (KPI's) for total sales, profit, discount and customer count
The actionable insights derived from this dashboard have empowered Wyse-Buyer as follows:
Made informed decisions on business strategies
Streamline operations, and
Ultimately increase profitability
Dashboard Snapshot
Check out the live project on my portfolio here: https://lnkd.in/dc_pN9fN
By presenting complex data in a visually compelling manner, I facilitated a better understanding of key metrics and trends, enabling the organization to adapt its strategies effectively in a competitive market.
Subscribe to my newsletter
Read articles from Ezekiel Balogun directly inside your inbox. Subscribe to the newsletter, and don't miss out.
Written by

Ezekiel Balogun
Ezekiel Balogun
I am an Accountant turned Data Analyst/Scientist with a passion for uncovering insights through data! With expertise in accounting, financial analysis and hands-on experience on data analysis and science, leveraging on different tools like Microsoft Excel, SQL, Python, Power-BI for managing relational database, query and manipulating database, data cleaning, exploratory data analysis (EDA), data visualization, presentation and building machine learning models. I'm driven by the power of data to solve real-world problems. Some of my projects include: The Kaggle titanic project where I explored the depths of exploratory data analysis, data cleaning, manipulation and visualization with Python and its powerful libraries. See attached https://github.com/BalogunEzekiel/3MTTOgun20DaysOfChallenge/blob/main/Day%203%20Challenge.ipynb The Vintage Motors - Business Solution Using Power BI Dashboard Visualization. See attached https://www.linkedin.com/pulse/business-solution-using-power-bi-dashboard-ezekiel-balogun-omitf?utm_source=share&utm_medium=member_android&utm_campaign=share_via Join me as I combine my financial acumen with tech skills to push boundaries and share with you everything you need to know about data analytics, data science, software development, UI/UX, animation, AI/ML, cyber security, DevOps, cloud computing, etc to be successful in your tech journey and career. Let’s connect by you clicking on "Follow" tab to explore the future of tech and data-driven success together! All my projects are available on my portfolios: GitHub: https://github.com/BalogunEzekiel LinkedIn: https://www.linkedin.com/in/ezekiel-balogun-39a14438
