Day 46: AWS CloudWatch
 Vishesh Ghule
🚀Introduction
In our previous blog, we explored how to use AWS CodeDeploy for automating application deployments. Today, we will shift our focus to understanding AWS CloudWatch.
CloudWatch is a comprehensive monitoring service offered by AWS, designed to provide real-time insights into your AWS resources, applications, and services. Whether it's tracking metrics, setting alarms, or collecting logs, CloudWatch plays a vital role in ensuring your infrastructure runs smoothly. In this blog, we’ll dive into what CloudWatch is, its core features, and how you can use it to monitor and optimize your applications effectively.
In this blog we will see what is:
Logs
Metrics
Threshold
Dashboard
Alarm
How to create custom metrics
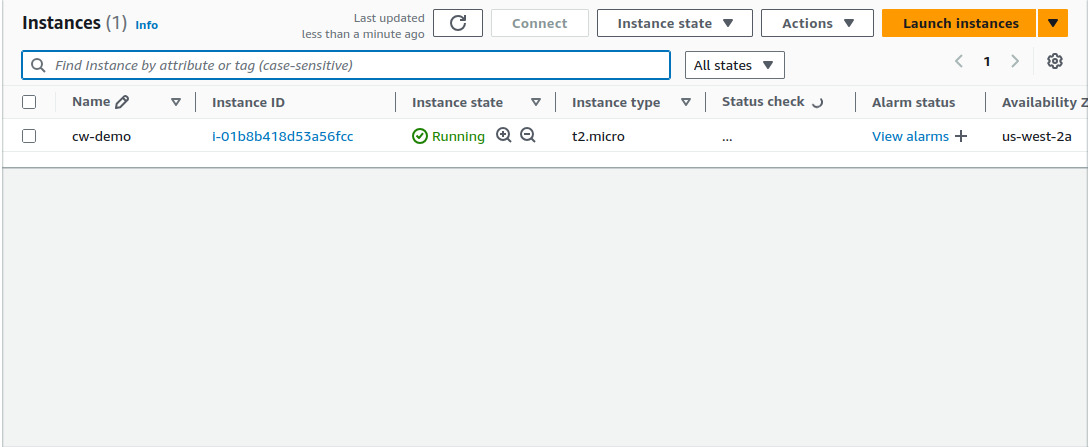
- First Create EC2 Instance
🔸Before moving forward, let's first understand what log groups are.
In CloudWatch Logs store historical data, meaning you can access logs generated in the past. This allows you to review and analyze events that happened earlier, such as errors, deployment details, or specific application behavior.
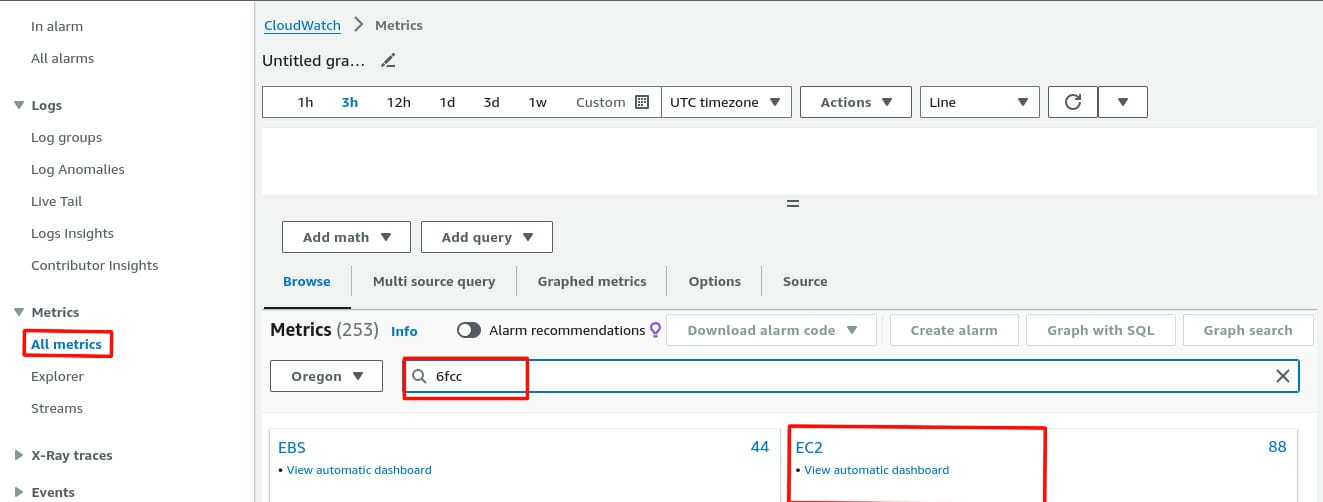
- After creating EC2 Instance successfully now go to the cloudwatch and select all metrices & search your instance ID, after that click on EC2
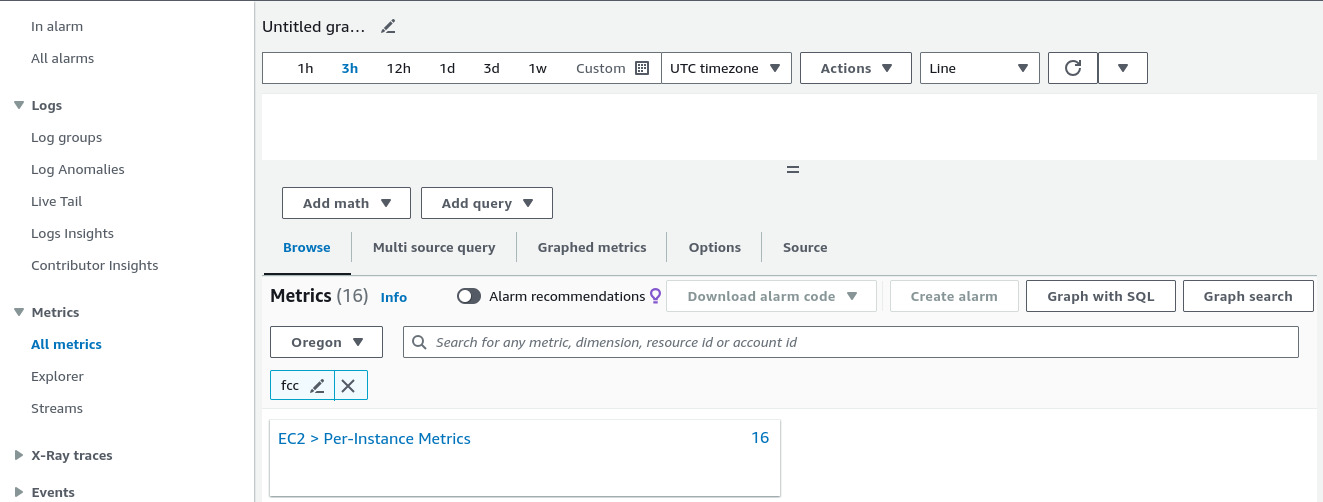
- Click on EC2> Pre-Instance Metrics
- Select CPUUtilization
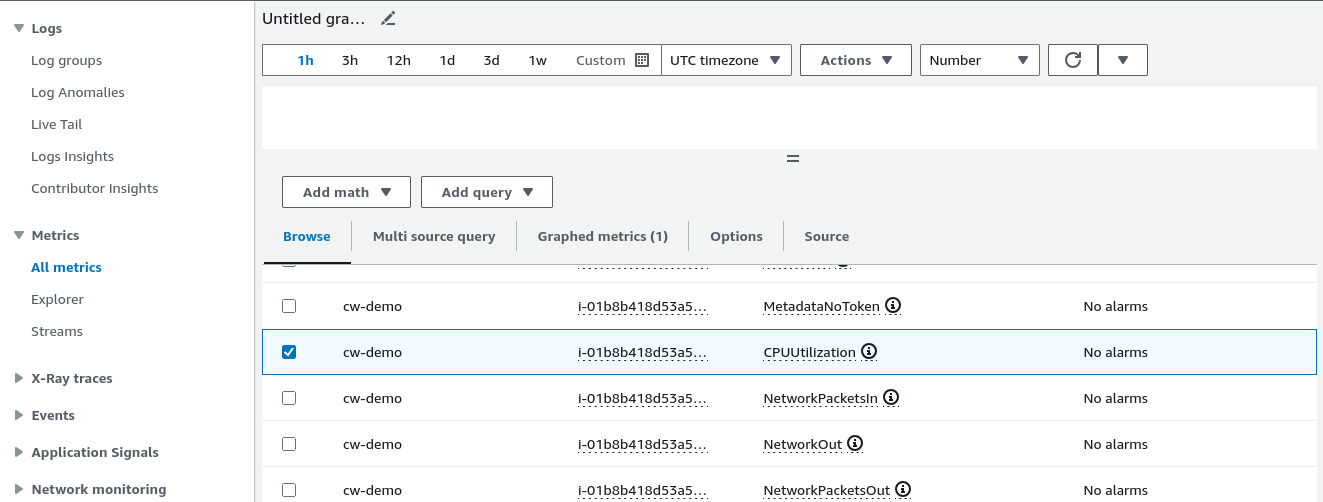
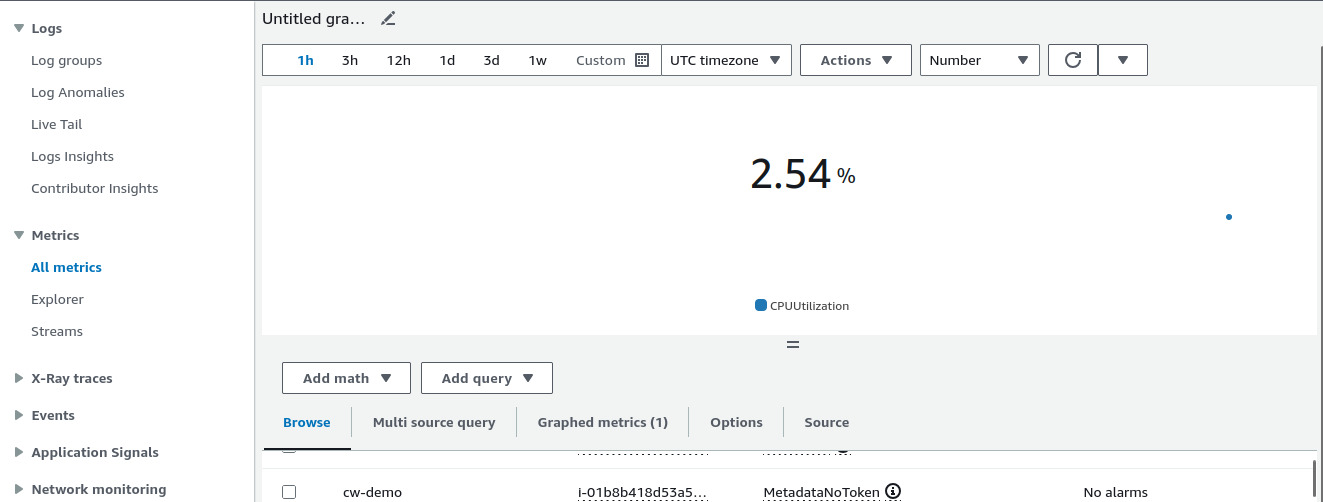
- You can select here line, number, pie, etc. For better understanding we will select number
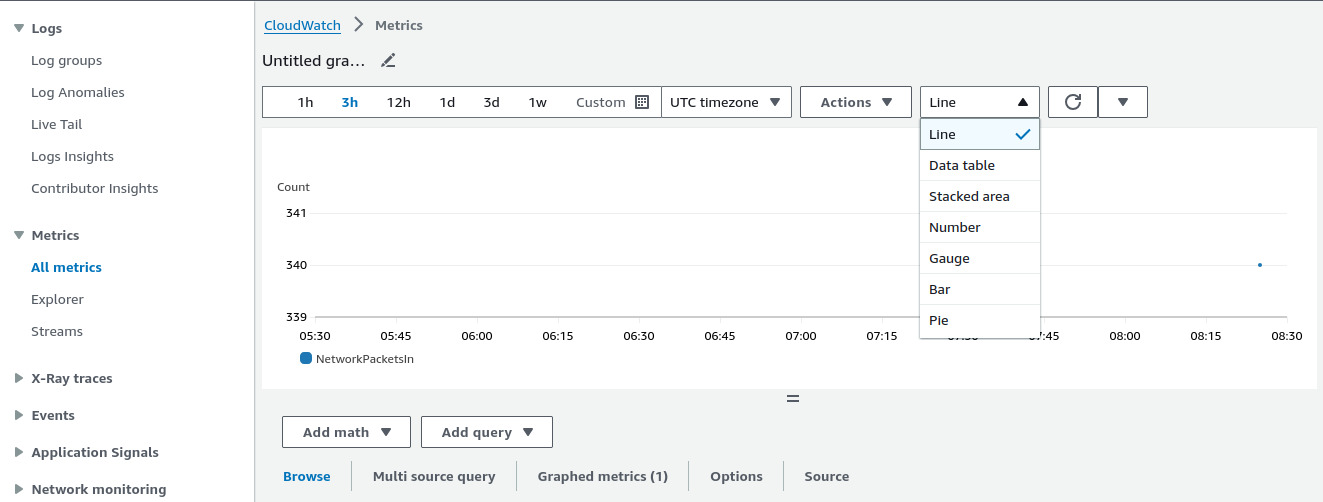
- The percentage we see in metrics in AWS CloudWatch is often referred to as a threshold.
- Create alarm & follow the picture’s given below.
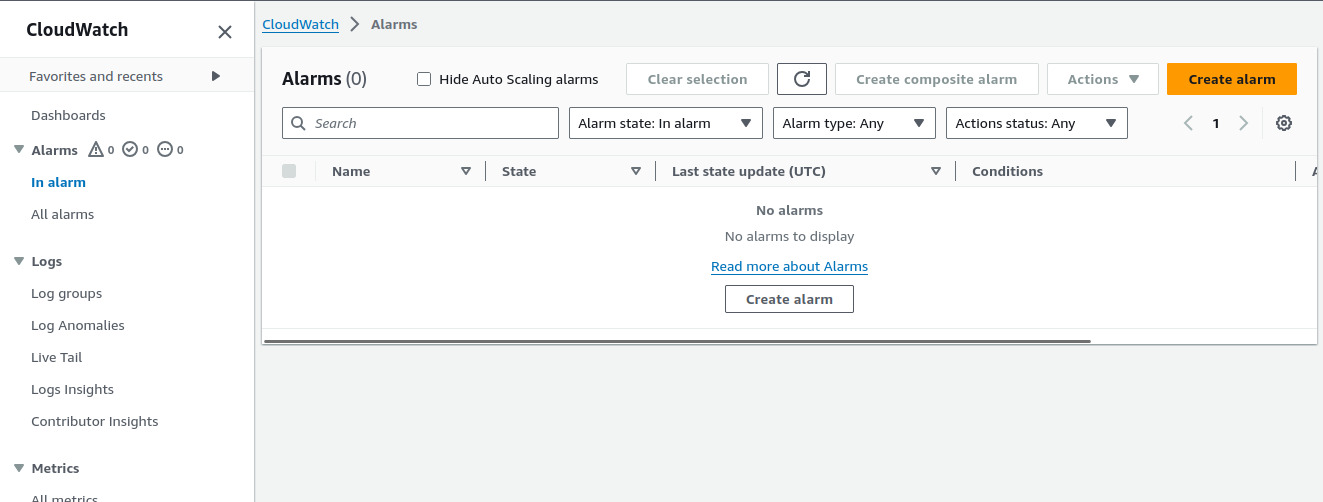
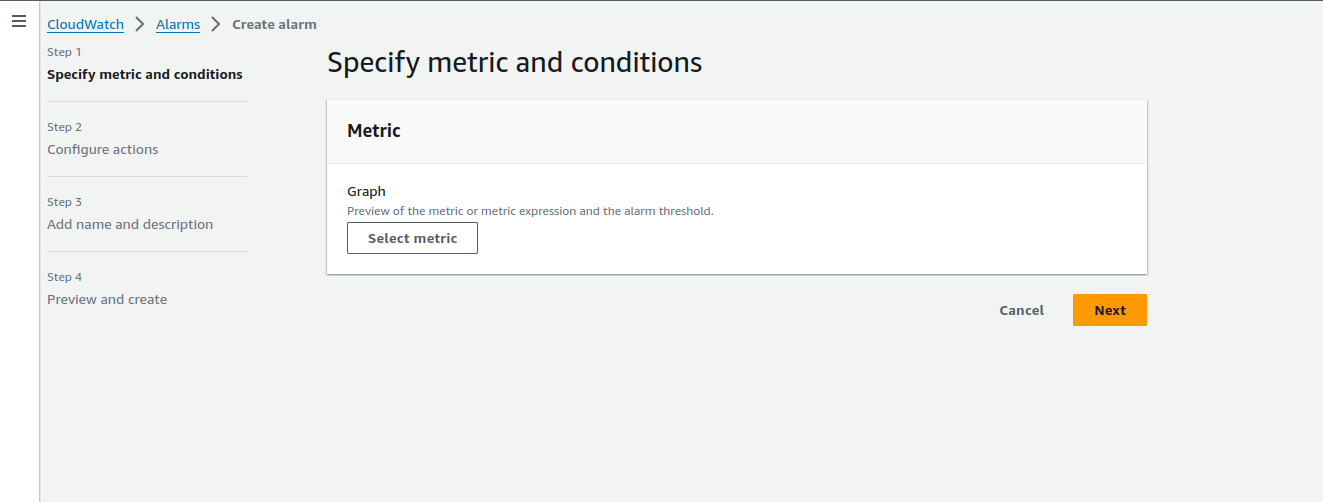


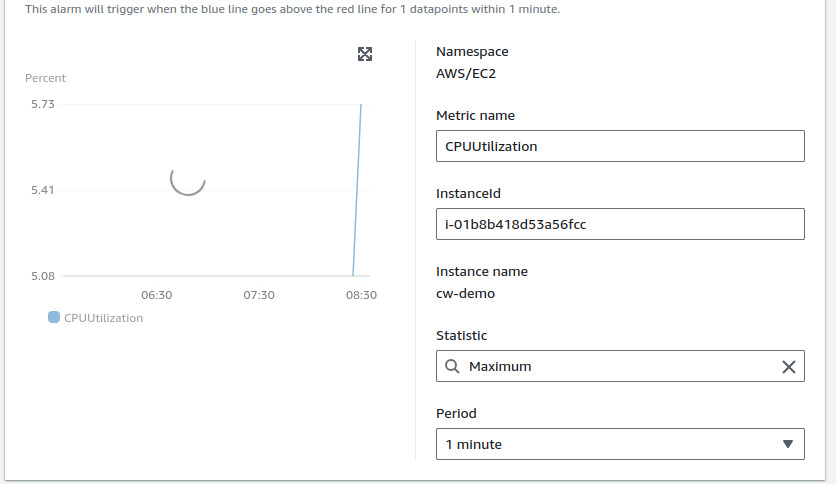
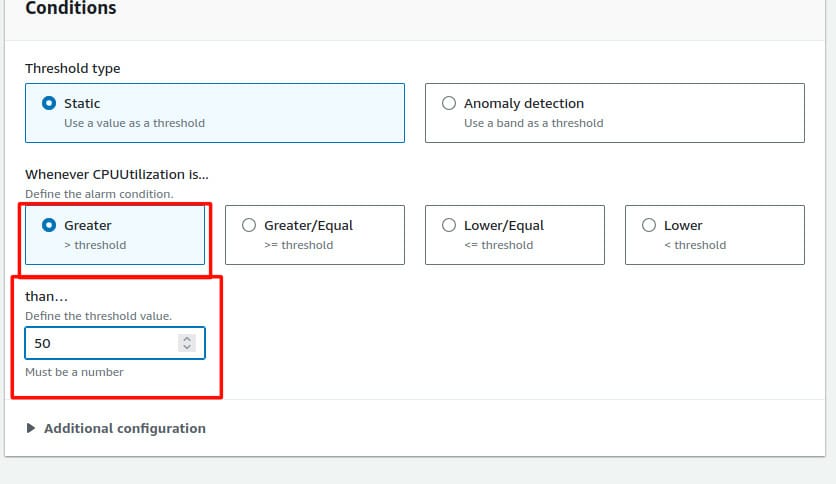
- The threshold means the number you set. If you set it to 50 percent, it will send you an alert email. I have set the threshold to 50.
In the context of CloudWatch, a threshold is indeed the specific value (like 50 percent) that you define. When the monitored metric crosses this threshold, CloudWatch will trigger an alert, such as sending an email notification.
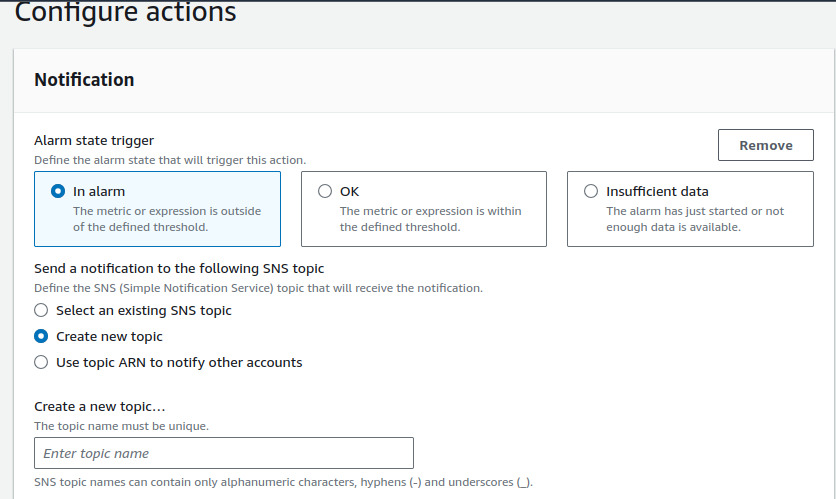
- Create new topic → Write your mailID → and click on Create Topic
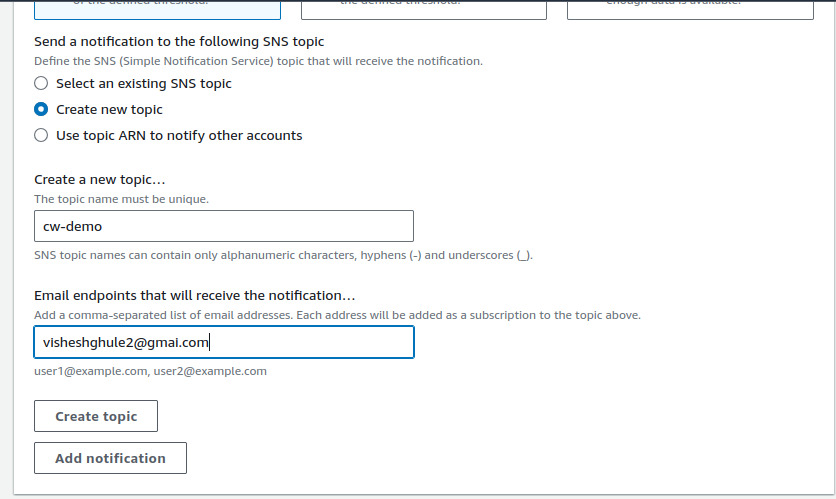
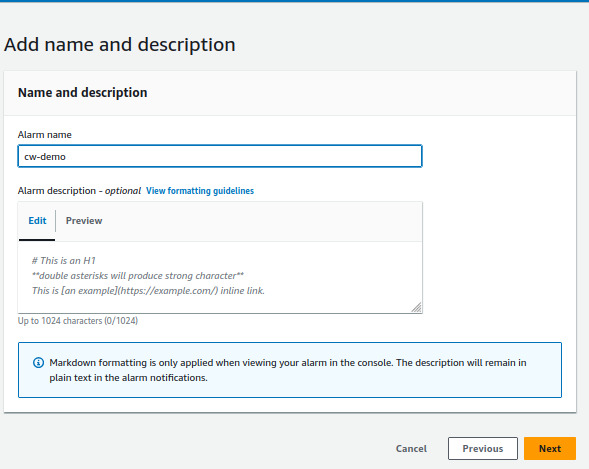
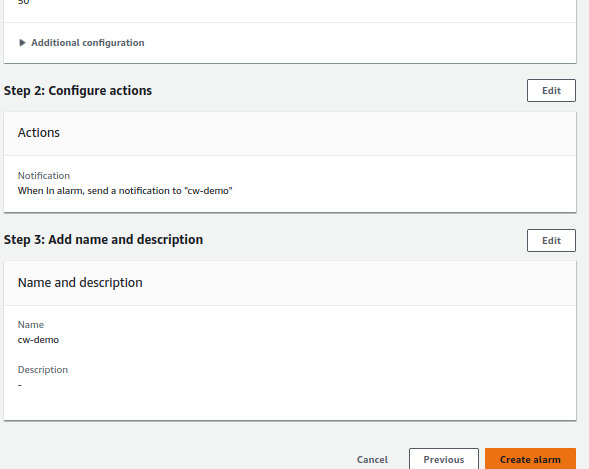
- Check all the things and click on create alarm
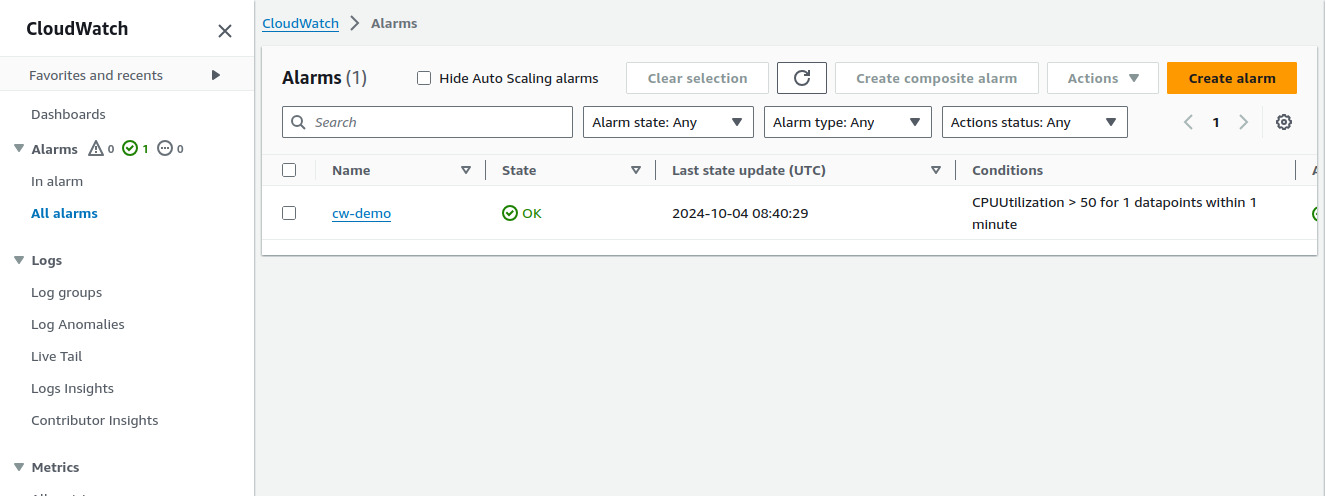
- You get OK in state then it’s done. (now you can follow from point no. 19), if you are getting Insufficient data then follow the given pictures below (from point no. 12)
Follow the given picture’s below if you are getting Insufficient data in state.
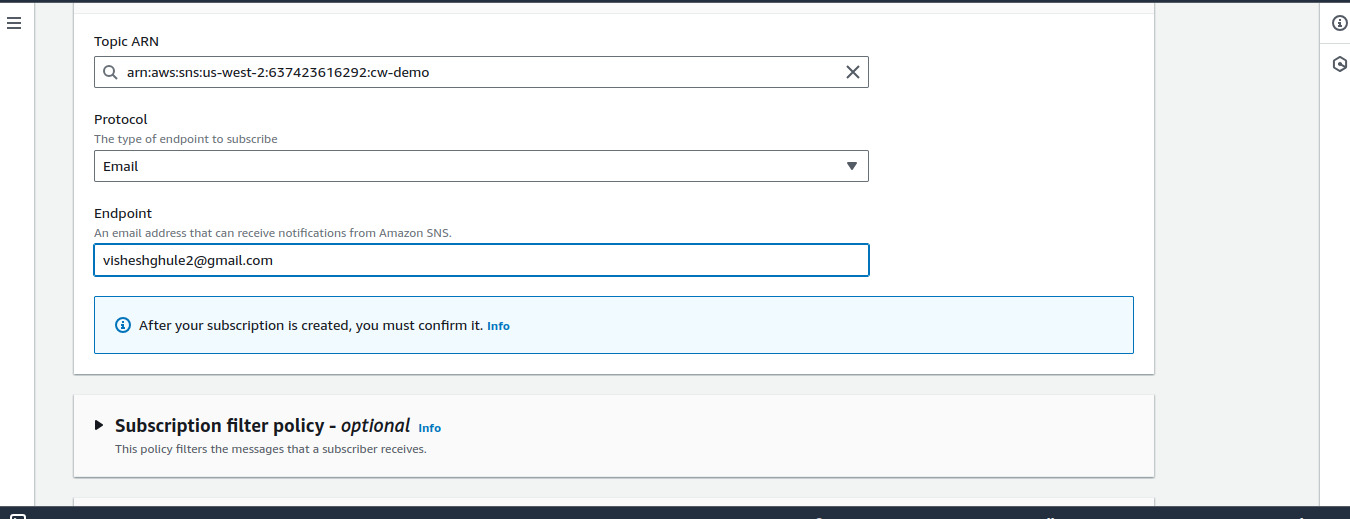
Search SNS (Simple Notification Service) Create topic & after that create subscription
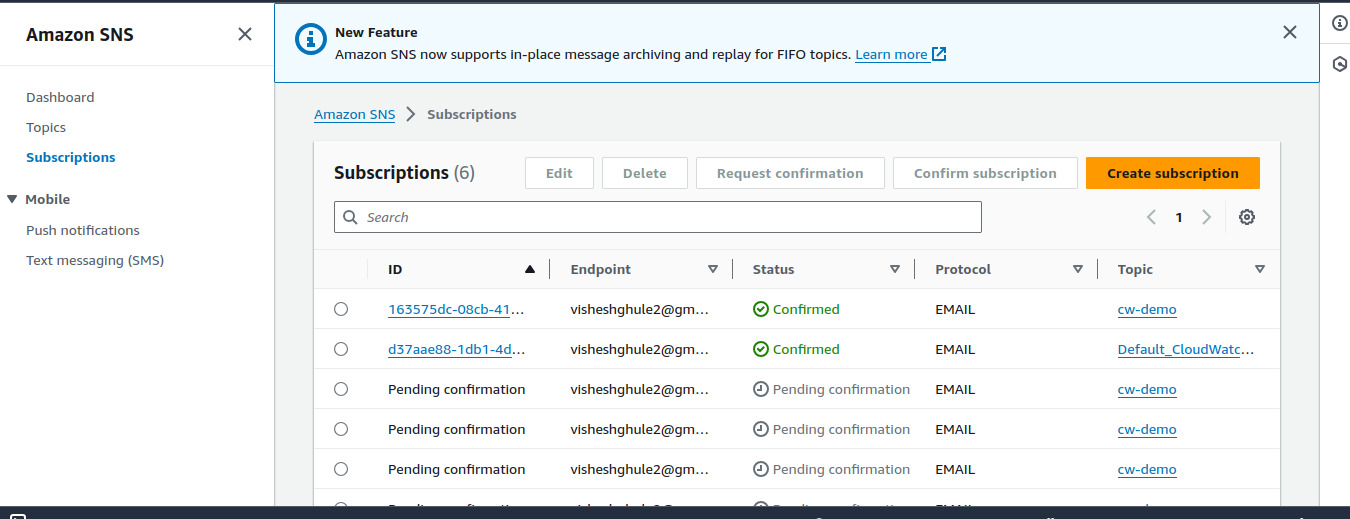
- Select Email in protocol to get link
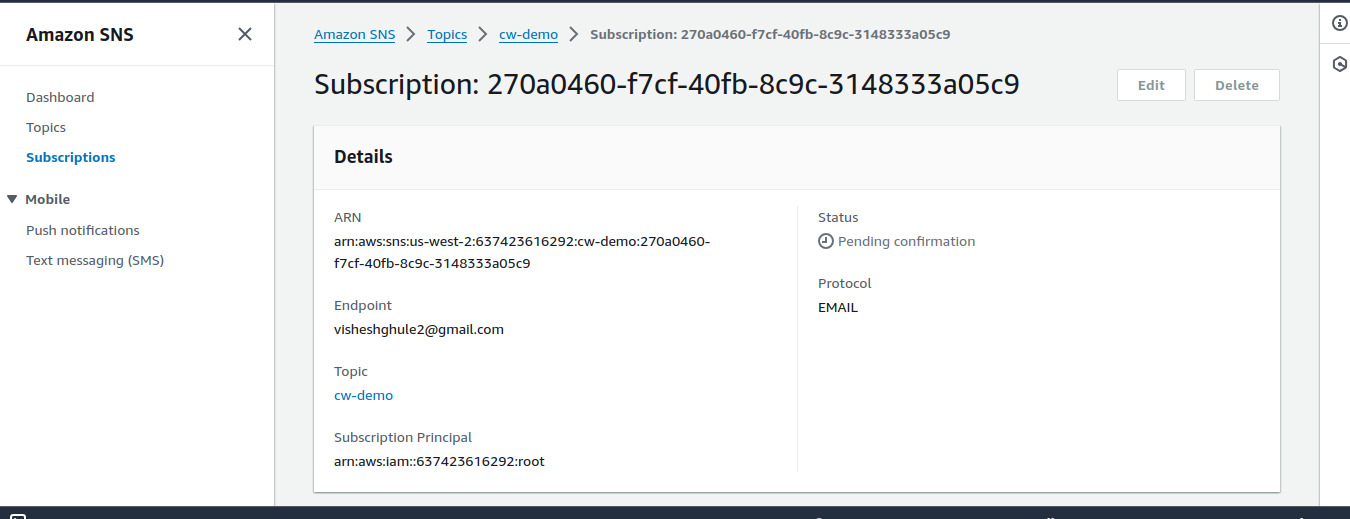
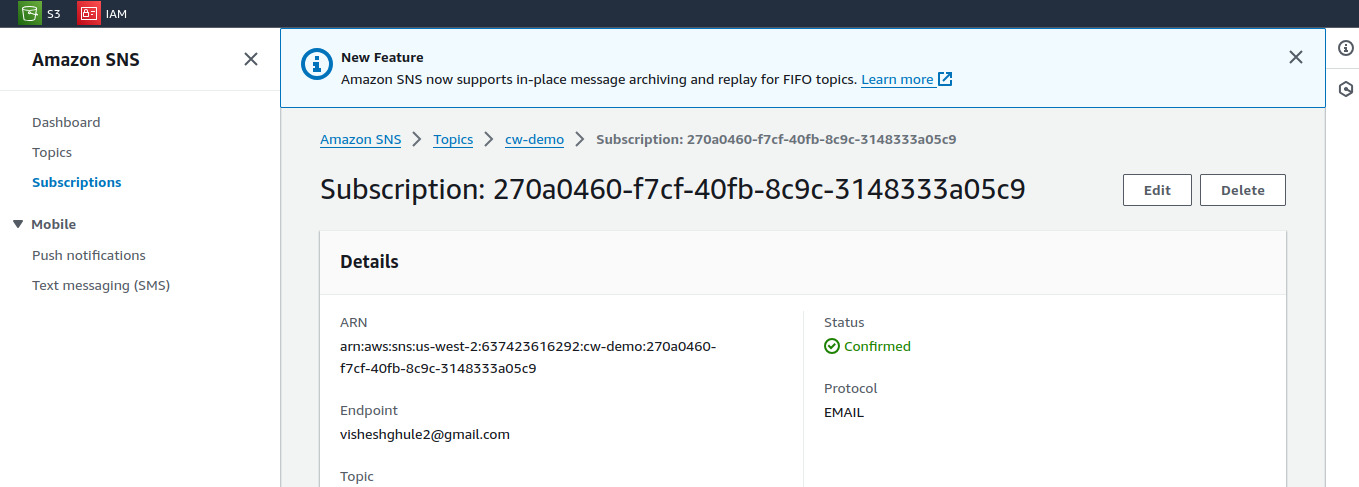
- You can see Status is been in Pending confirmation to confirm go to the mail & click on confirm subscription
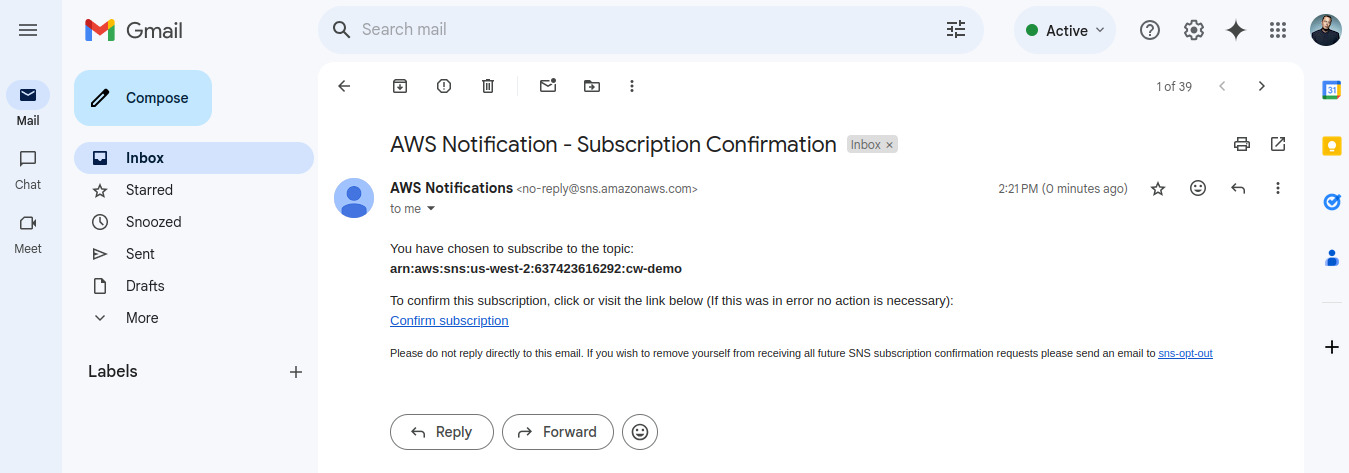
- You will get mail from AWS to confirm subscription open mail & click on confirm subscription

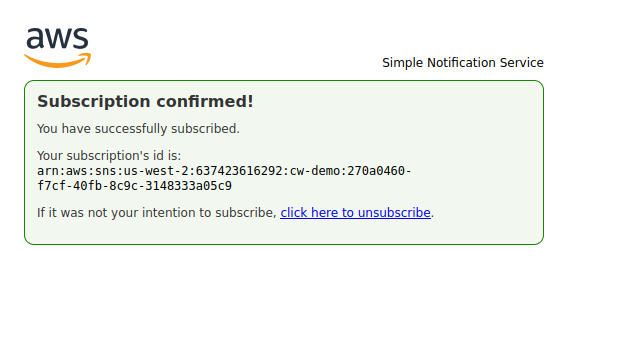
Now you will get Confirmed in Status.
After Following all this steps you will get OK in alarm state
- Now we will write spike file in python to get traffic
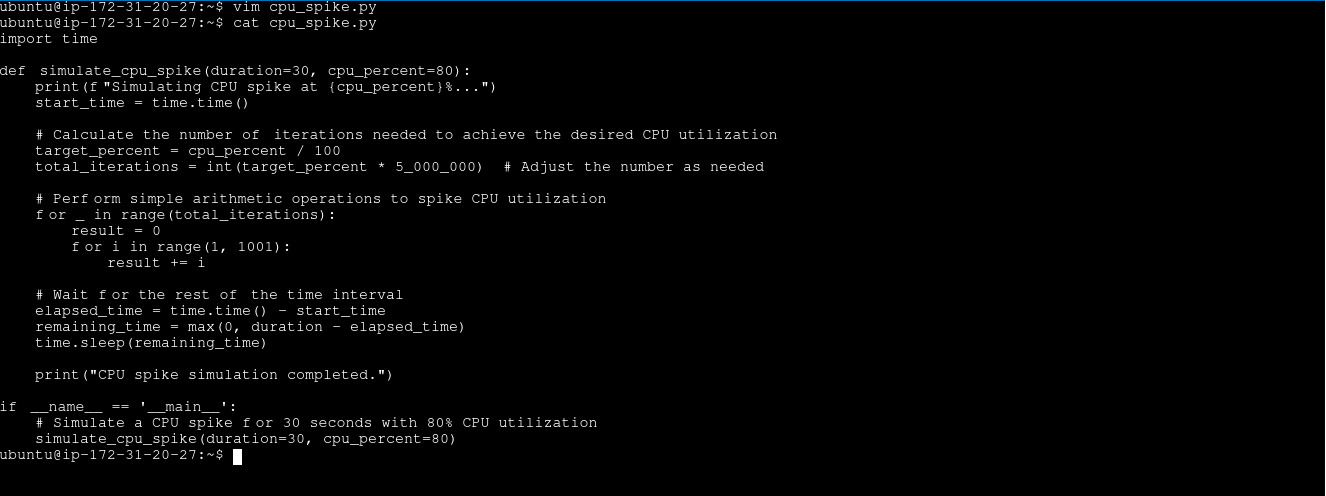
import time

def simulate_cpu_spike(duration=30, cpu_percent=80):
    print(f"Simulating CPU spike at {cpu_percent}%...")
    start_time = time.time()

    # Calculate the number of iterations needed to achieve the desired CPU utilization
    target_percent = cpu_percent / 100
    total_iterations = int(target_percent * 5_000_000)  # Adjust the number as needed

    # Perform simple arithmetic operations to spike CPU utilization
    for _ in range(total_iterations):
        result = 0
        for i in range(1, 1001):
            result += i

    # Wait for the rest of the time interval
    elapsed_time = time.time() - start_time
    remaining_time = max(0, duration - elapsed_time)
    time.sleep(remaining_time)

    print("CPU spike simulation completed.")

if __name__ == '__main__':
    # Simulate a CPU spike for 30 seconds with 80% CPU utilization
    simulate_cpu_spike(duration=30, cpu_percent=80)
- Now run
python3 cpu_spike.py

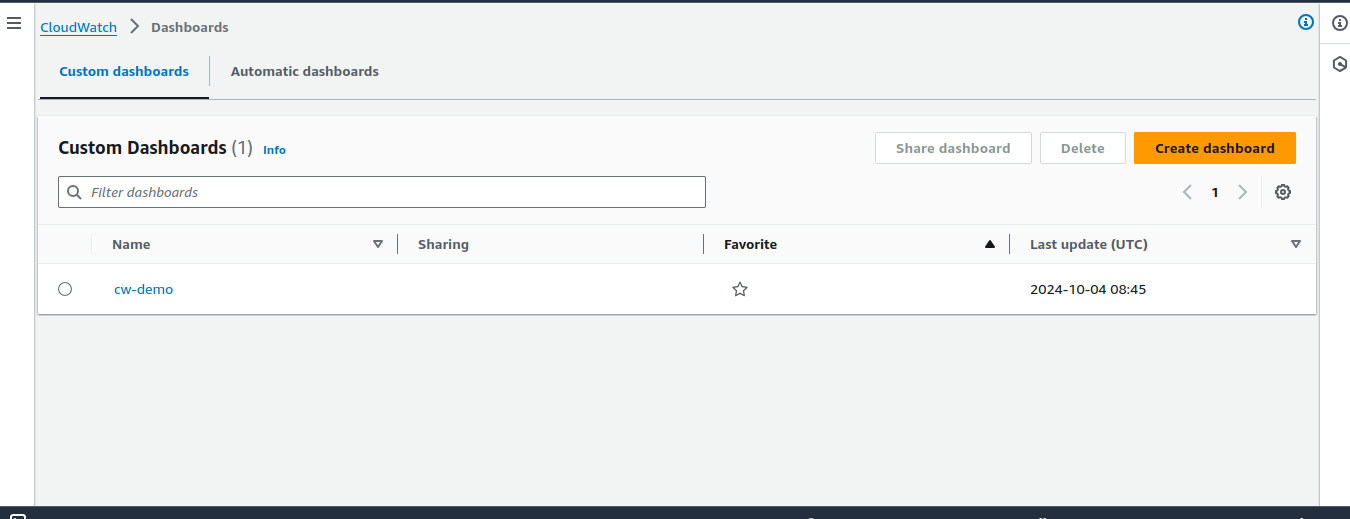
- Create Dashboard. CloudWatch Dashboard allows you to monitor and visualize AWS metrics in real-time using various widgets for tracking application and infrastructure performance.
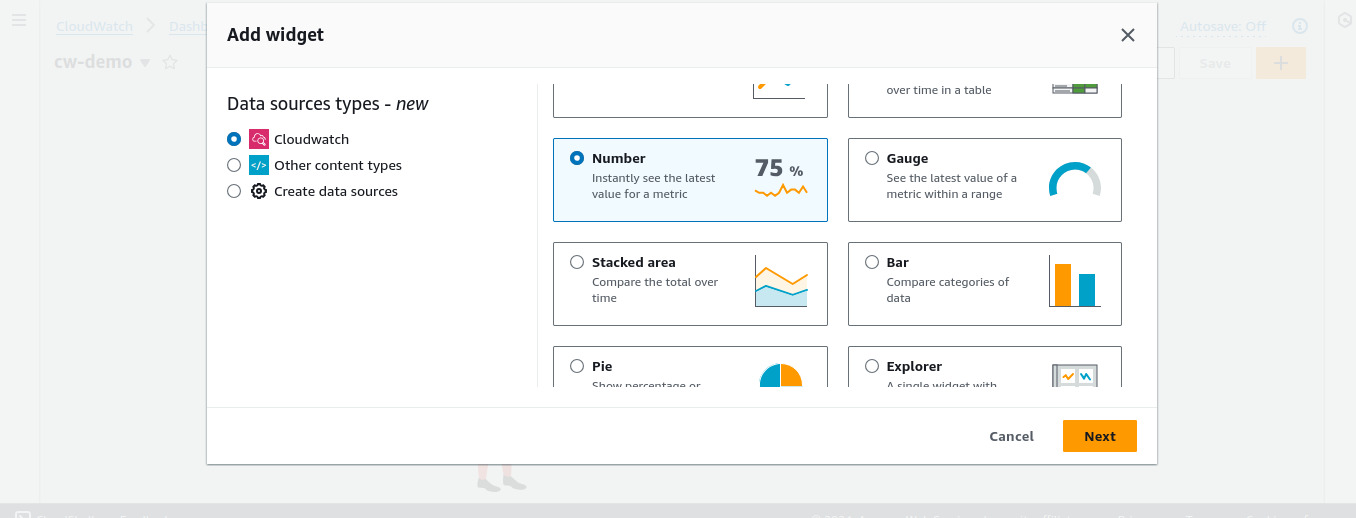
- Add widget. Select number to understand better.
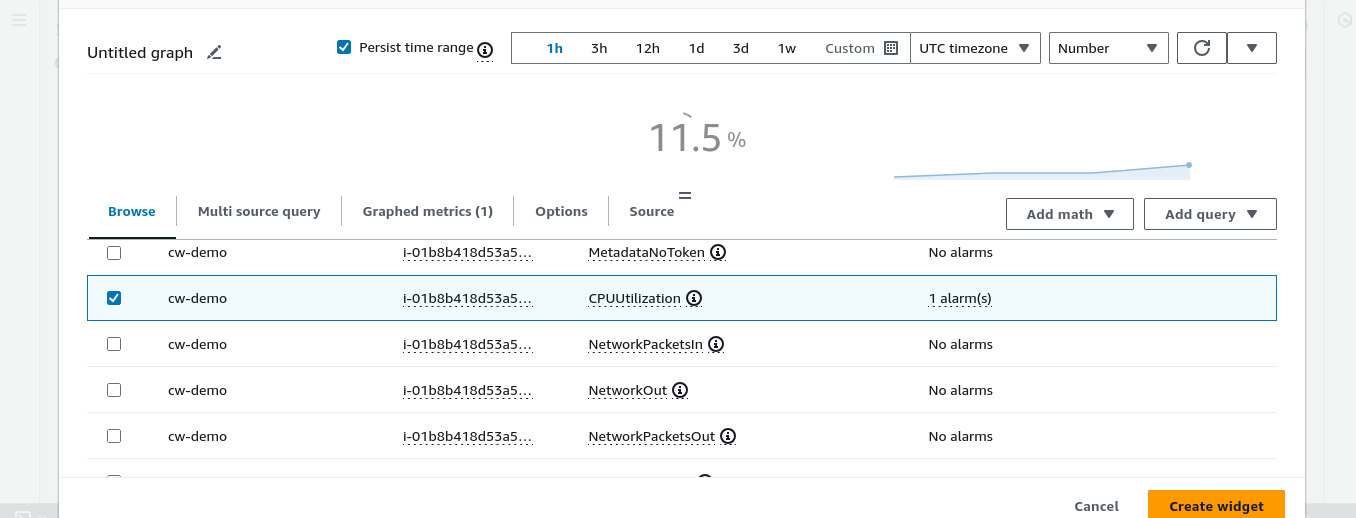
- On dashboard
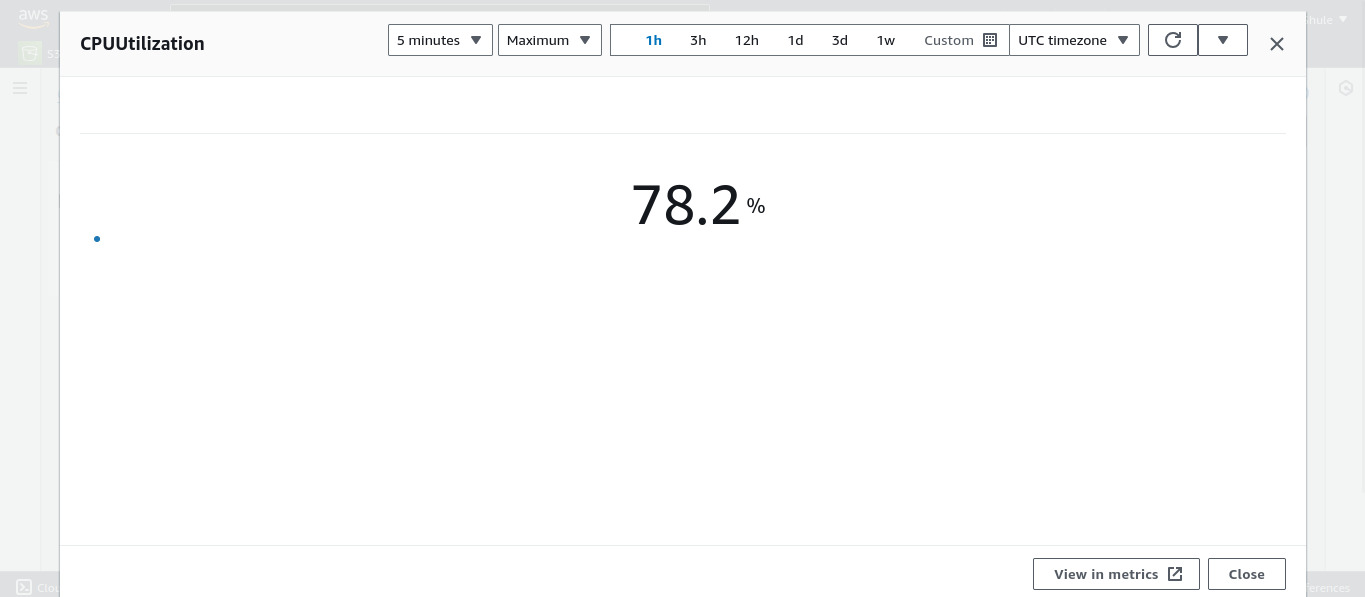
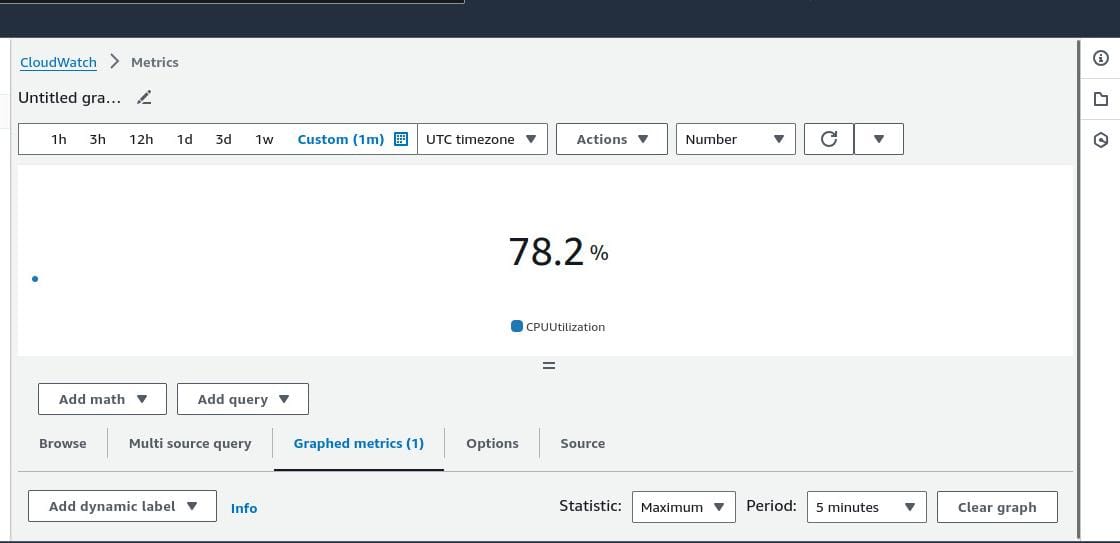
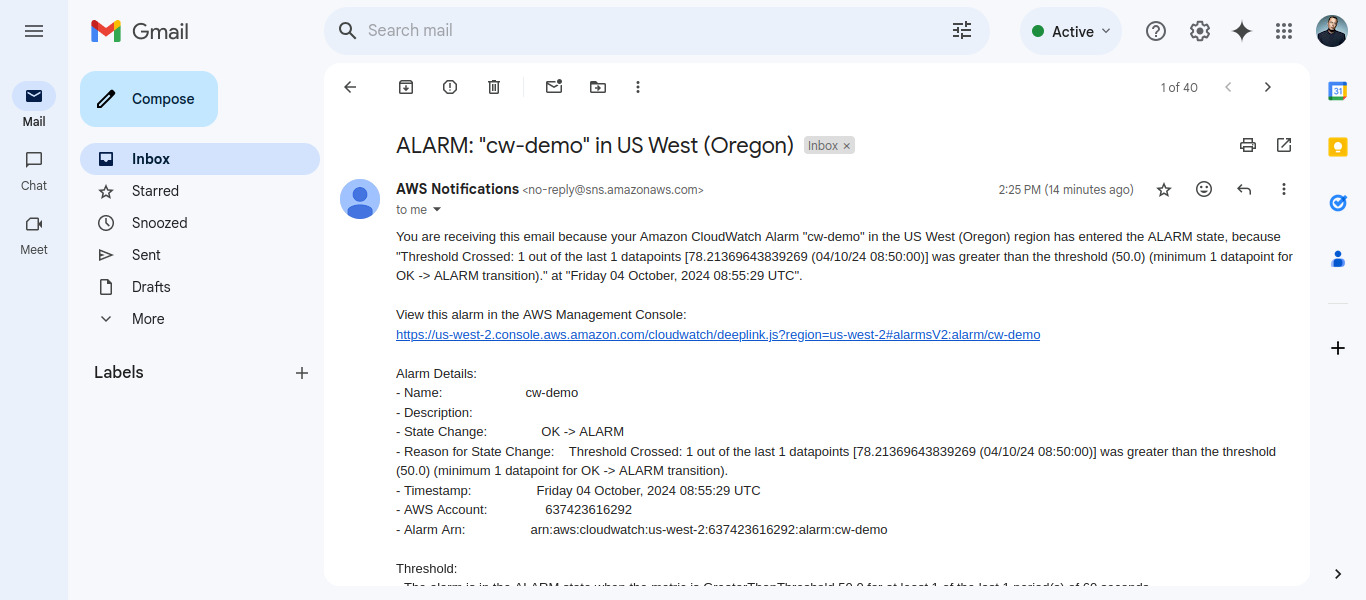
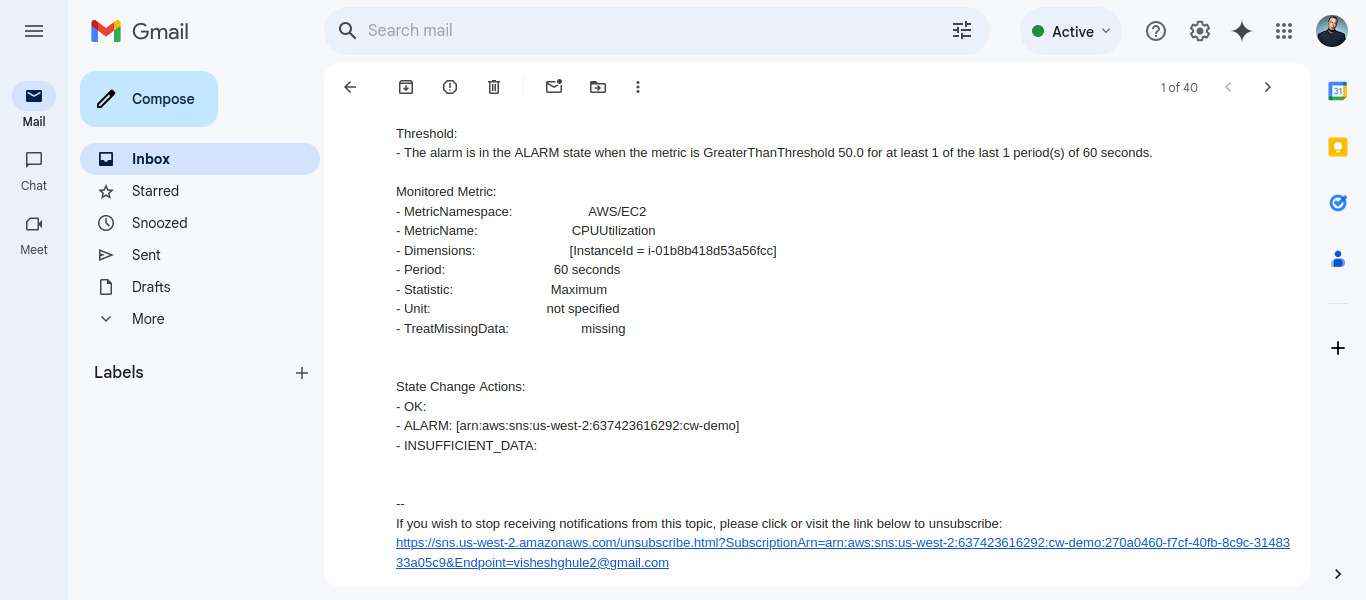
- You will receive an alarm message on your email after crossing 50.

🔸How to create custom metrics
Steps to configure CloudWatch Metrics on Linux Machine:
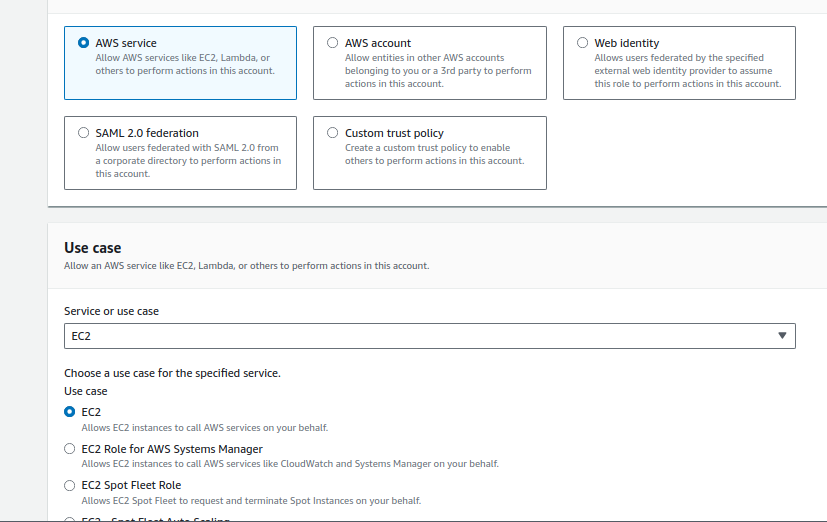
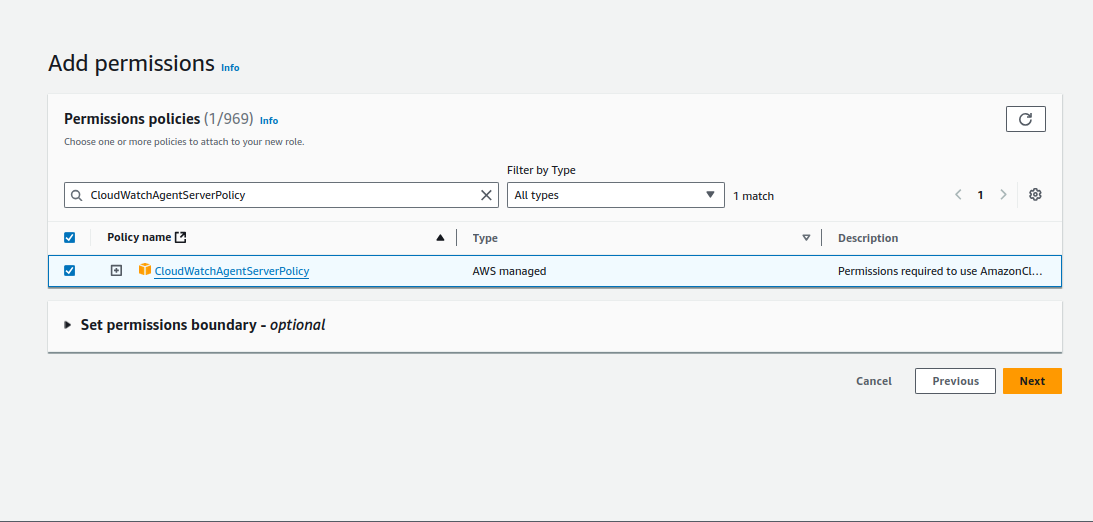
- Go to AWS Console-> Go To IAM -> Go to Role-> create Role-> Attach CloudWatchAgentServerPolicy -> click next-> Give Role Name-> click create role
- Attach created role to the EC2 instance on which you want to do configuration of CloudWatch Metrics.
Go to EC2-> Go to Security-> Go to Modify IAM Role-> Select the Role Name-> click on update IAM Role
- SSH into Your EC2 instance and apply following Commands
wget https://s3.amazonaws.com/amazoncloudwatch-agent/ubuntu/amd64/latest/amazon-cloudwatch-agent.deb
The command will download CloudWatch Agent on your EC2 machine.

sudo dpkg -i -E ./amazon-cloudwatch-agent.deb
The Command will unzip the installed package

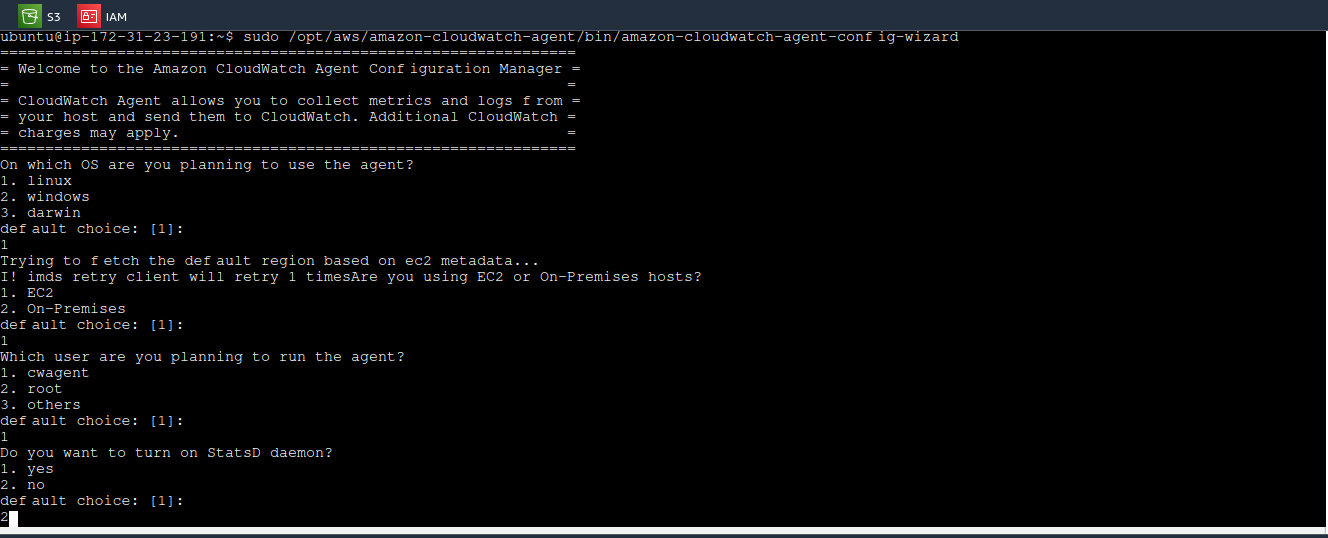
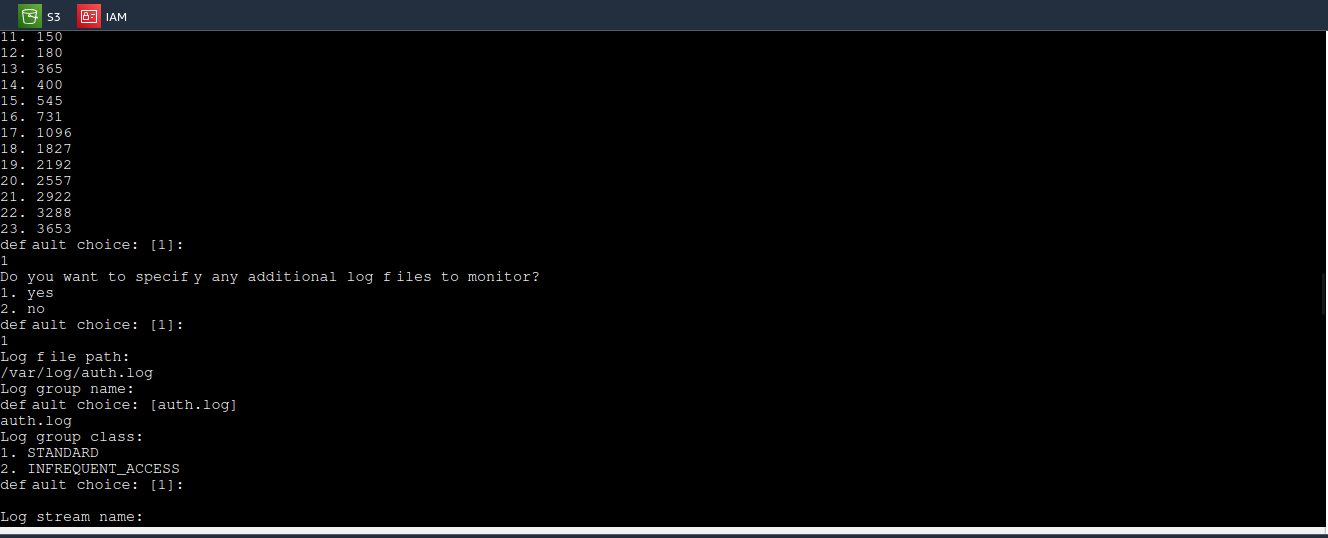
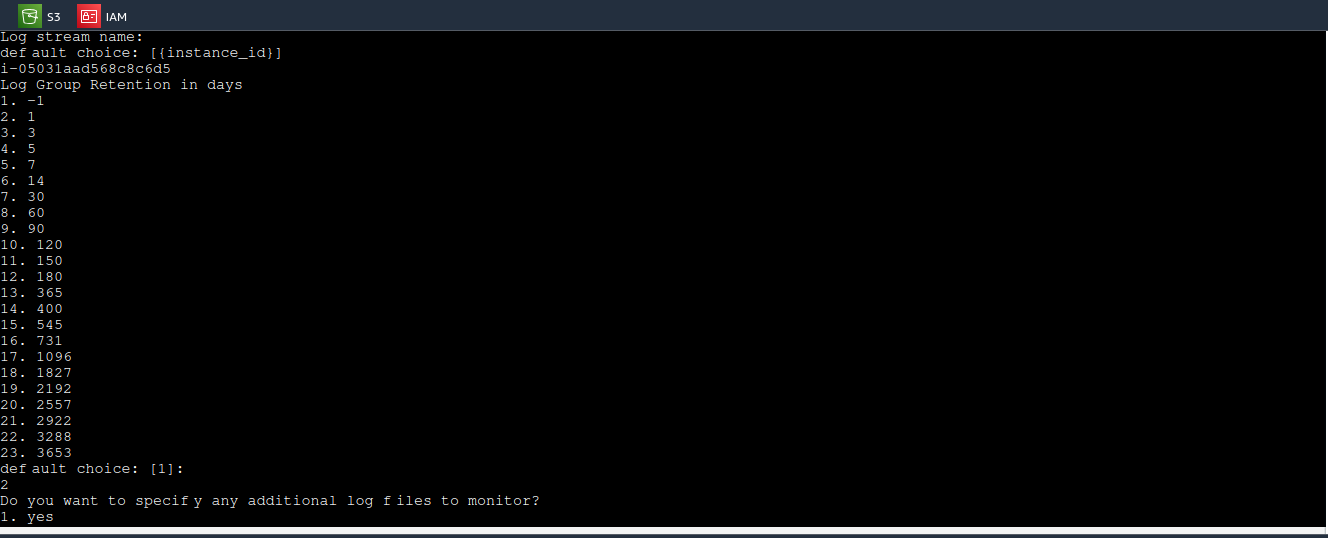
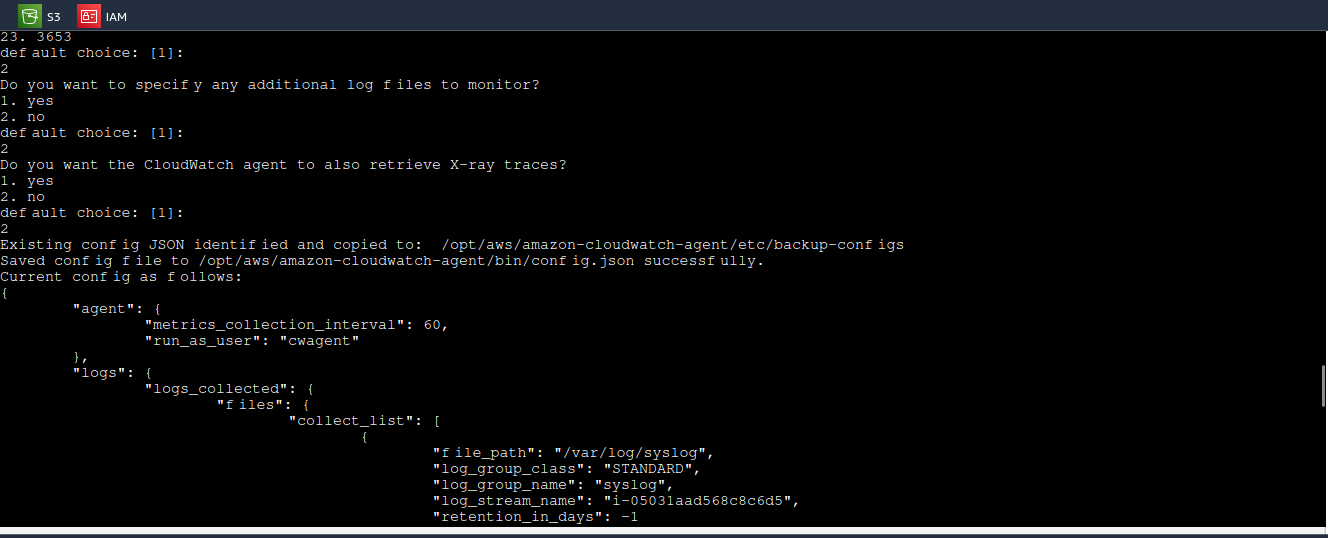
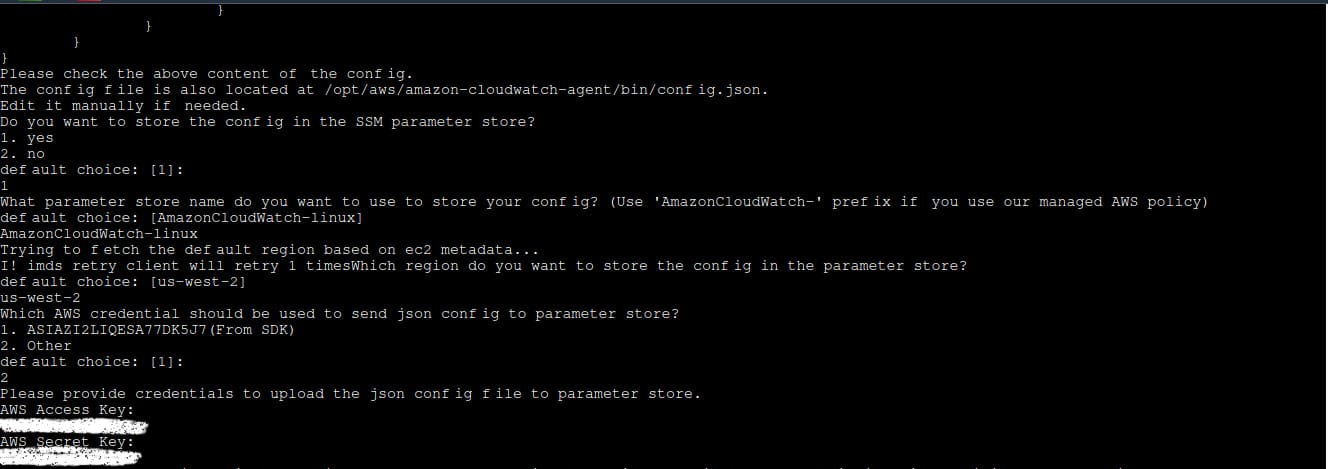
sudo /opt/aws/amazon-cloudwatch-agent/bin/amazon-cloudwatch-agent-config-wizard
The Command start installation of CloudWatch Agent
sudo /opt/aws/amazon-cloudwatch-agent/bin/amazon-cloudwatch-agent-ctl -a fetch-config -m ec2 -c[file:/opt/aws/amazon-cloudwatch-agent/bin/config.json](file:/opt/aws/amazon-cloudwatch-agent/bin/config.json)-s
The Command will run the AWS CloudWatch Agent
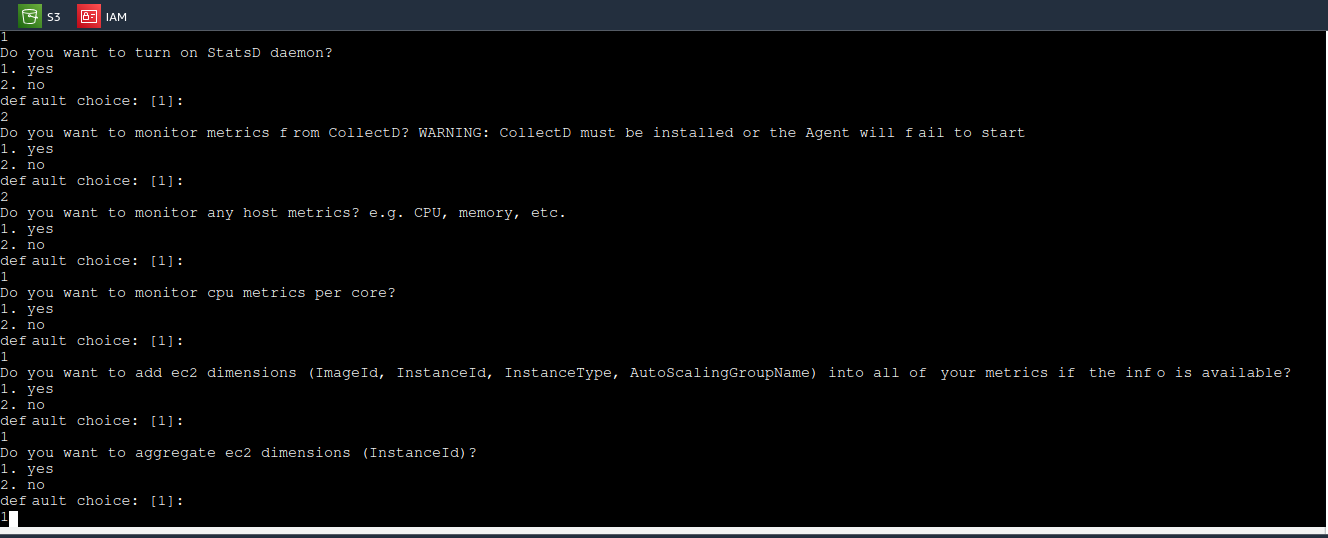
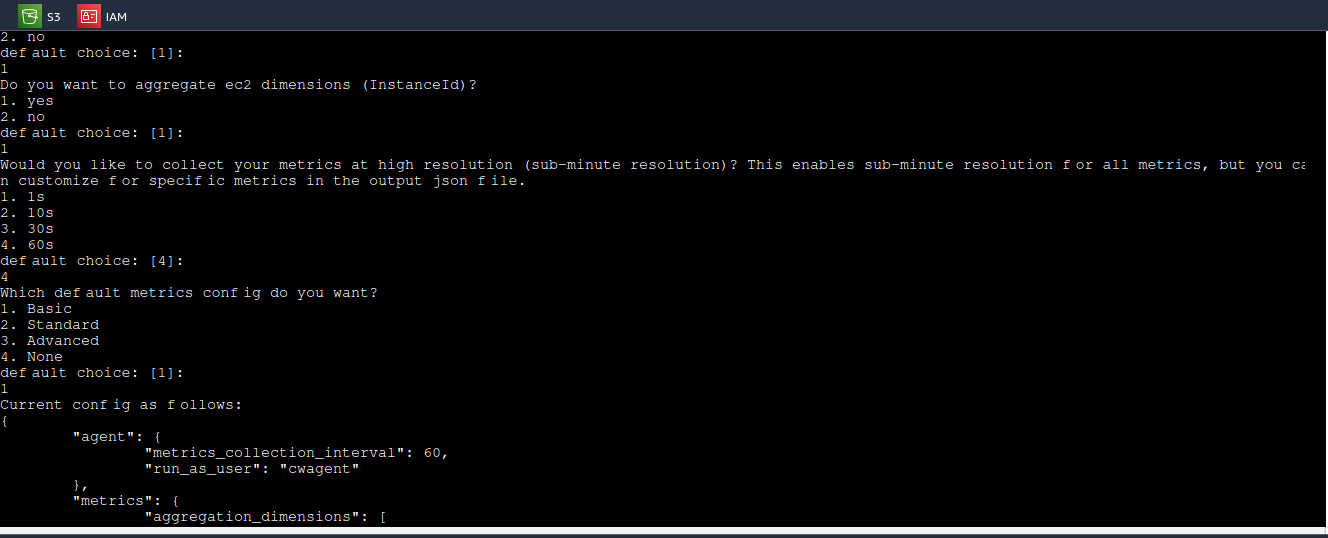
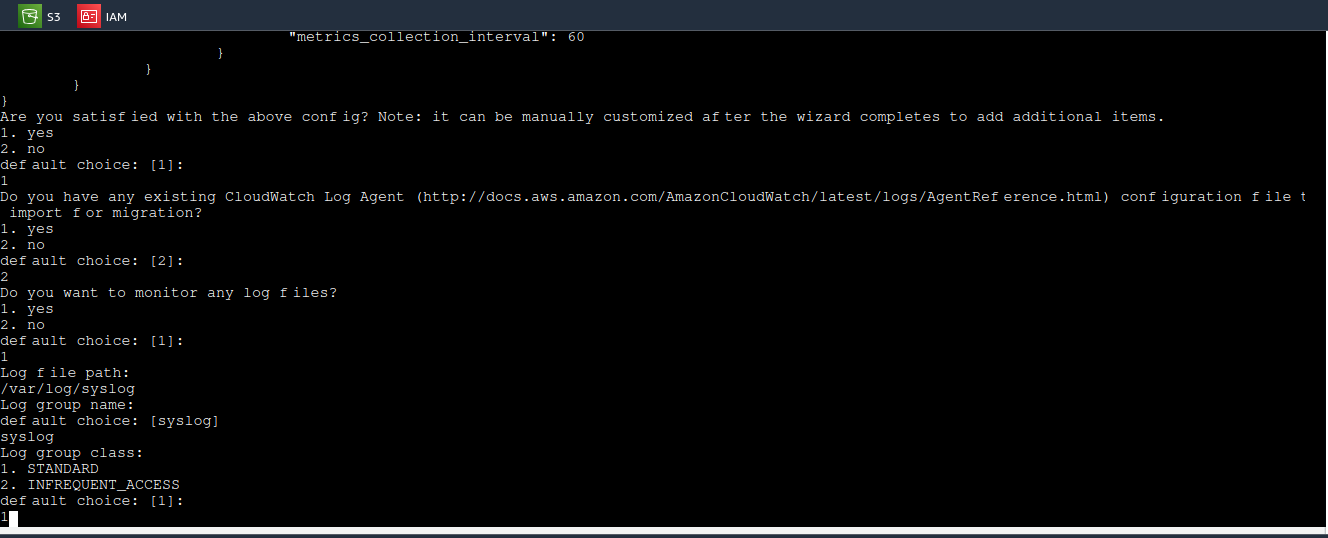
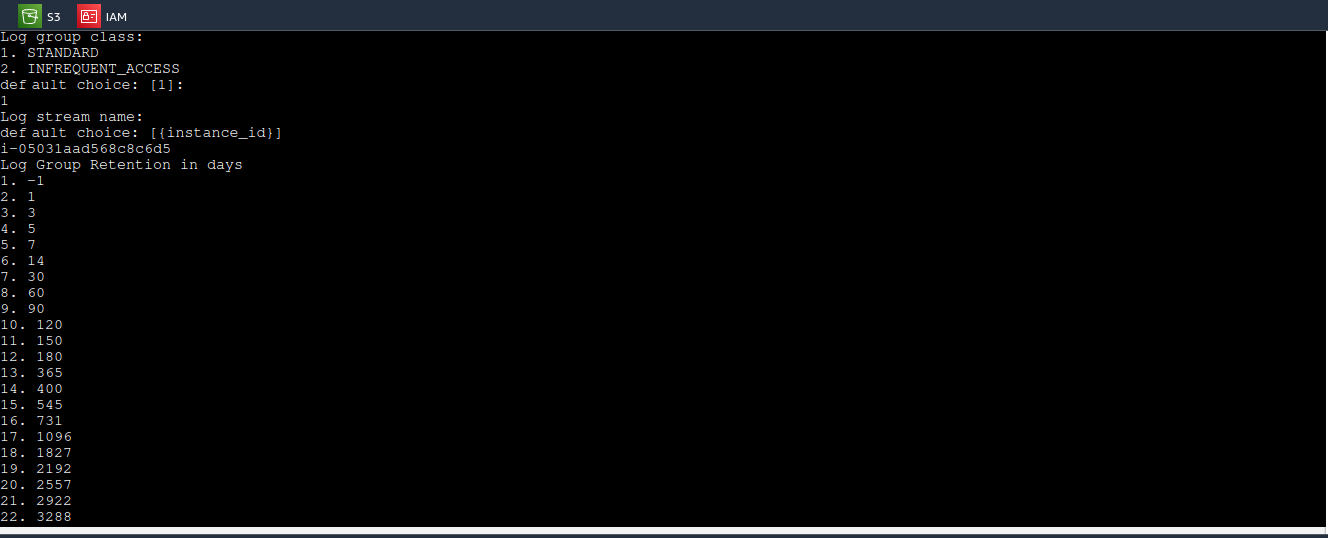
sudo /opt/aws/amazon-cloudwatch-agent/bin/amazon-cloudwatch-agent-ctl -a status
The Command Will start the AWS CloudWatch Configuration as per selected Settings.

sudo systemctl status amazon-cloudwatch-agent
The Command will show the status of cloudwatch-agent is it running or not.
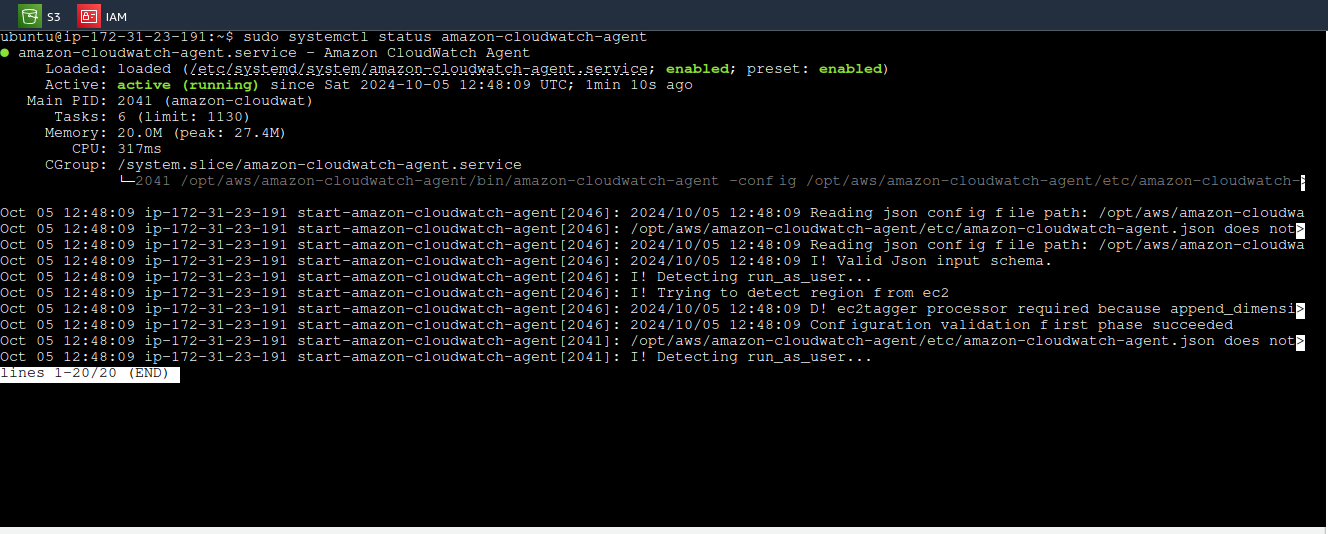
Now monitor the instance from CloudWatch Console.
Go to the cloudwatch dashboard->click on all Metrics-> click on cwagent-> click on InstanceId
Select Metrics which utilization you want to check
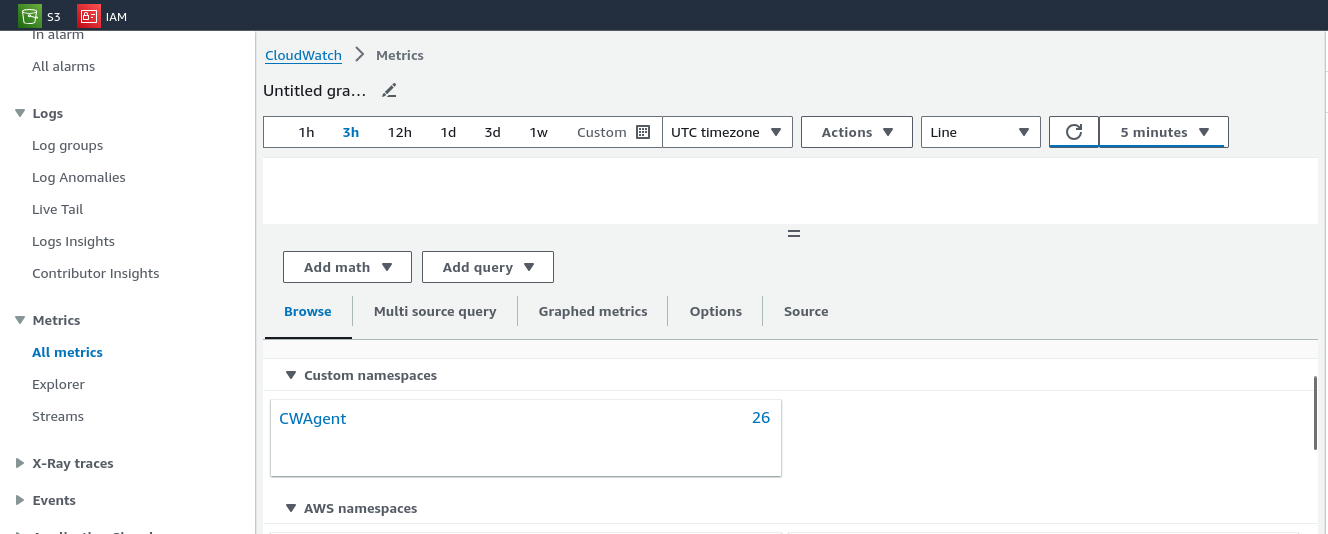
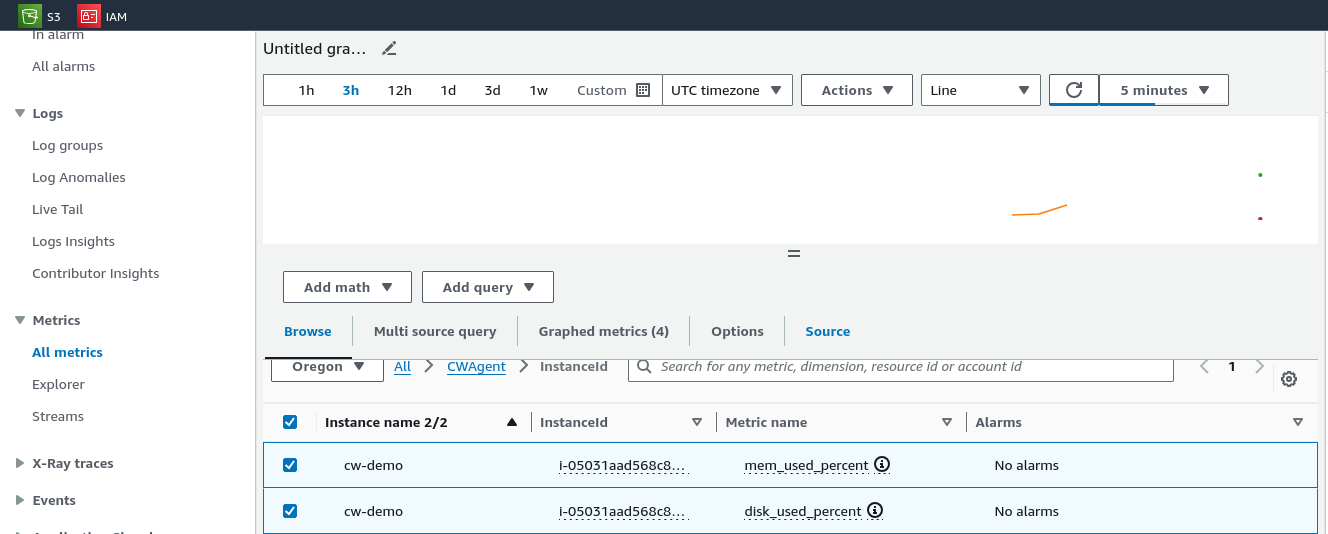
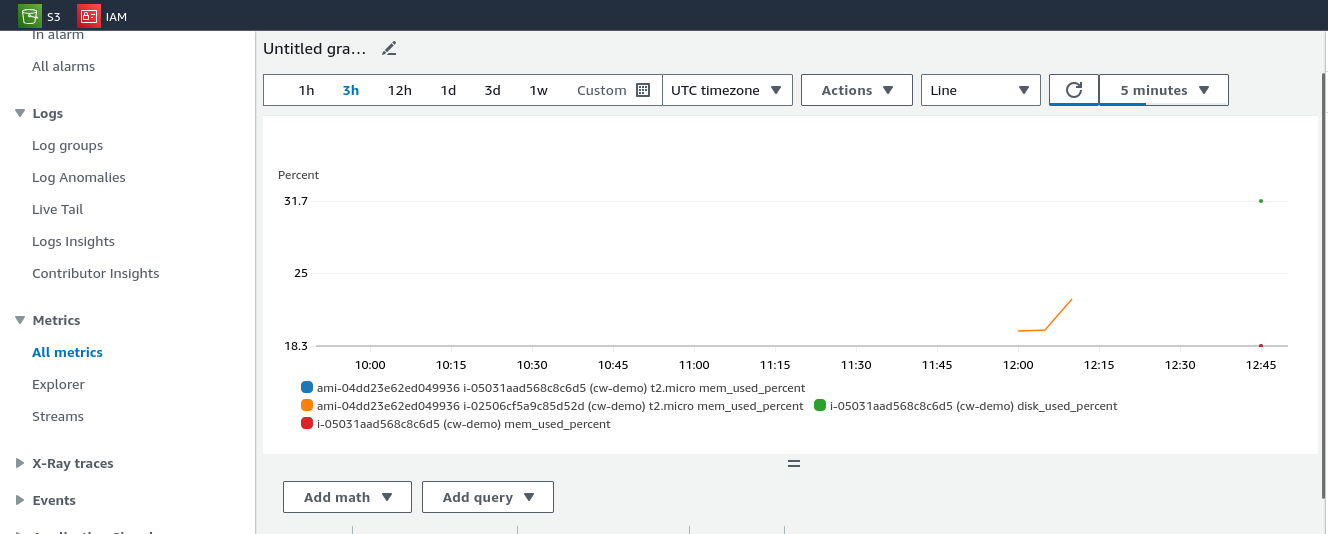
- This is how you can check the memory, disk and CPU utilization of your EC2 instance.
I hope this will help you in setup of CloudWatch disk and memory utilization metrics on your Linux EC2 instance.
🔸Here are the top CloudWatch metrics and their uses:
CPUUtilization: Tracks CPU usage. Helps identify under/over-utilization of EC2 instances.
DiskReadOps / DiskWriteOps: Measures disk read/write operations. Useful for monitoring disk I/O performance.
DiskReadBytes / DiskWriteBytes: Tracks data volume read/written to disk. Helps monitor data-intensive workloads.
NetworkIn / NetworkOut: Measures incoming/outgoing network traffic. Monitors network usage.
StatusCheckFailed: Monitors EC2 instance health (system and instance-level issues).
MemoryUtilization: Custom metric for tracking memory usage. Detects memory pressure.
Latency (ELB): Monitors load balancer latency. Helps assess response times.
RequestCount (ELB): Tracks the number of requests received by an ELB. Monitors traffic levels.
These metrics help in optimizing resource usage, detecting bottlenecks, and ensuring system health
🚀Conclusion
In this blog, we covered the basics of CloudWatch, including Logs, Metrics, Thresholds, Dashboards, Alarms, and how to create custom metrics. In the next blog, we will dive into AWS Lambda.
Thanks for reading to the end; I hope you gained some knowledge.❤️🙌
Subscribe to my newsletter
Read articles from Vishesh Ghule directly inside your inbox. Subscribe to the newsletter, and don't miss out.
Written by

Vishesh Ghule
Vishesh Ghule
I'm proficient in a variety of DevOps technologies, including AWS, Linux, Python, Docker, Git/Github, Shell Scripting, Jenkins and Computer Networking. My greatest strength is the ability to learn new things because I believe there is always room for self-development