Flood Analysis Map - Identifying Affected Infrastructures
 Precious Bassey
Overview
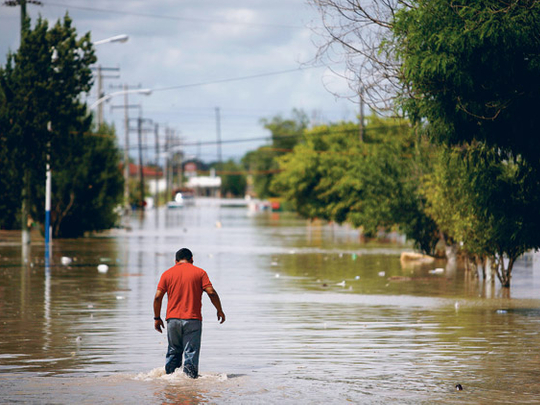
The 2024 Rio Grande do Sul Floods were highly devastating, caused by intense rainfall and the collapse of and a hydroelectric dam. Over a million people were impacted by the floods.
More than 70,000 individuals had to be evacuated, and around 100 people were reported dead or missing. The flooding caused massive infrastructure damages.
The analysis will highlight the affected infrastructures, specifically roads and buildings.
Dataset Description
Rio Grande do Sul boundary: Provided by HOTOSM
Flood data: The flood raster data was provided by Sentinel-2. This data highlights the affected areas.
Flood extent data: Provided by NASA
Processing
The Flood boundary was added alongside the Flood raster data, this helps mark out the affected area which we will be performing the analysis.
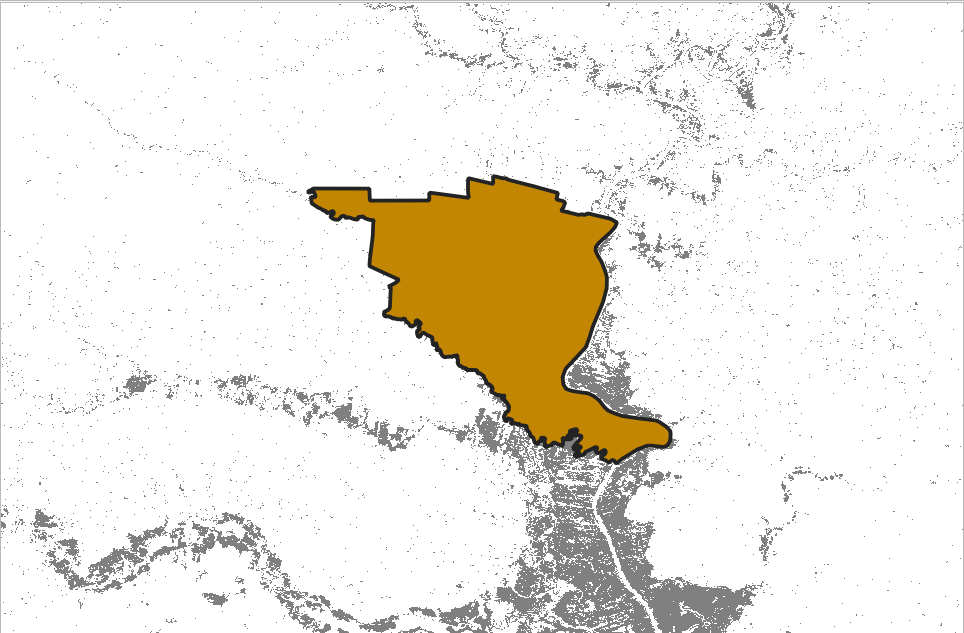
To get visual accuracy of the affected areas, the flood extent data was calculated by comparing pre-flood satellite imagery against ‘flood’ imagery captured on 6 May 2024.To achieve this we’ll compare against Copernicus imagery captured at the time. Go to the Copernicus browser, select ‘Login’ and ‘Register’ to create an account. Select the ‘Upload a file’ option on the right-hand side and upload the 16856- project boundary. Change the date on the left-hand side to 6 May 2024, this will provide the updated image for the flooded area.
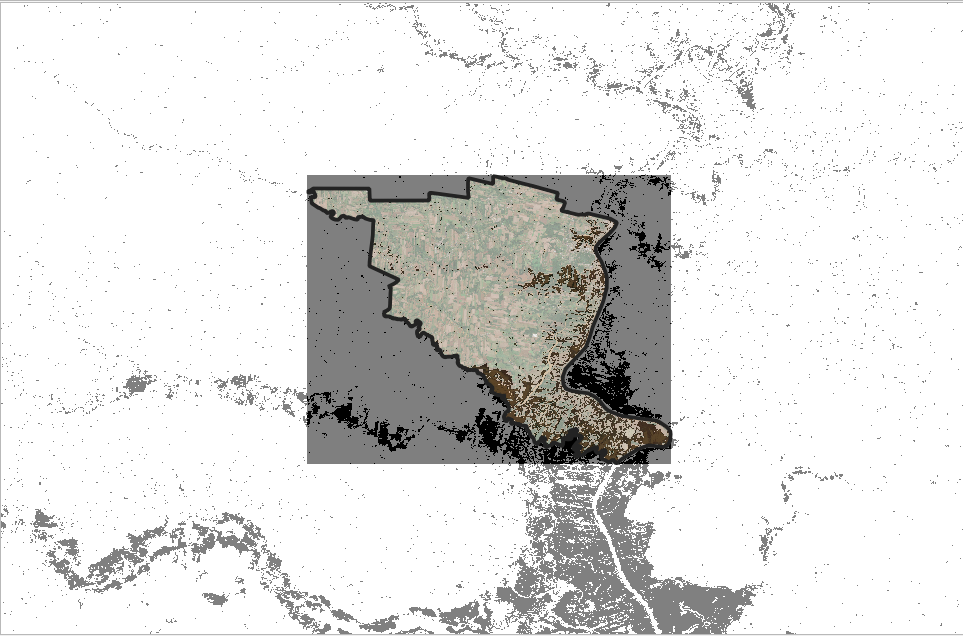
From the added image, we can confirm the accuracy of the flooded area is fairly good, and the data can then be used to run the analysis.
The next we’ll clip the data to our area of interest using the Clip Raster by Mask Layer option under extraction
Polygonising the raster
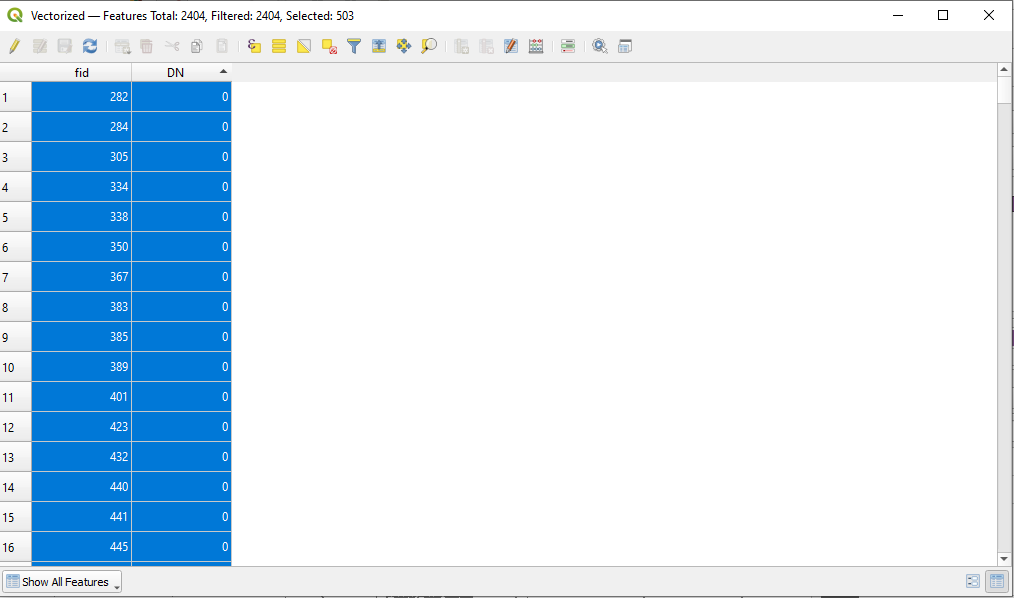
After polygonising the raster data, a new field called DN is created. The resulting vector includes both flooded (1) and non-flooded (0) values. We need to remove the areas which are not flooded (0).
Using the Select by Expression tool from the attributes table, we run the function "DN" = 0, this will highlight the non-flooded areas, then we proceed to delete it.
Data Analysis
The data we have is fairly accurate, so this means there are areas which are spotty, particularly built-up areas. We can partially solve that by joining polygons that are close to each other.
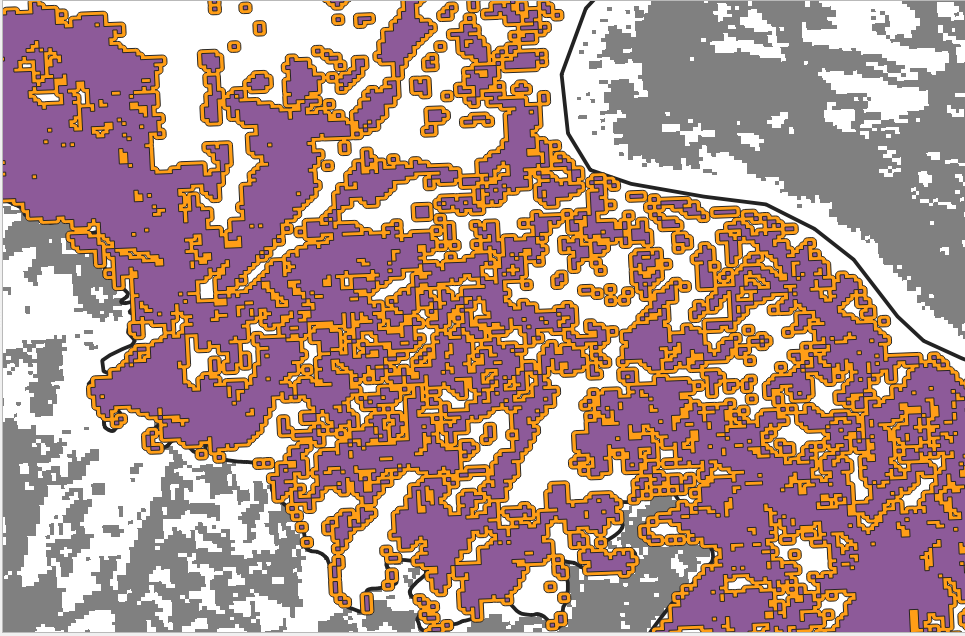
To achieve this, we’ll be creating a Buffer with a distance of 30m, the buffering has joined close parts together.
Data Cleaning
On the flood polygons there are some scattered small spots across the area of interest, these may have been wet paved areas or artificial water bodies that do not necessarily represent the flood extent. We can remove these by first of all calculating the area of each polygon and then removing the smaller ones.
Using the field calculator, we add a new field area_sqm then using the $area function under the geometry field, we calculate the for the new field.
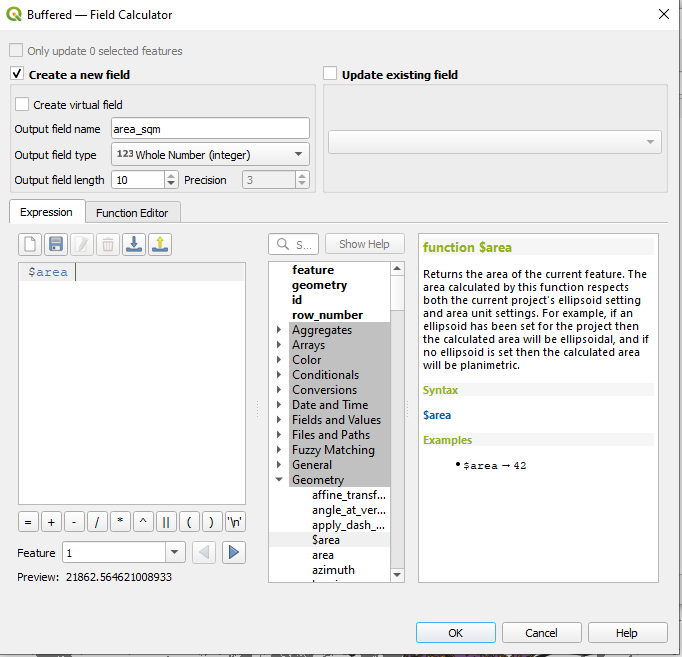
Using the Select by Expression option we’ll select the smaller polygons, if you click on the column heading area_sqm it will sort that column by size. Sorted this way, you can see that the smallest polygons are under ten thousand square meters. We’ll run this function to sort and delete the smaller polygons
"area_sqm" < 10000
With this we know the larger bodies of water in our area of interest is flood.
Utilizing OSM Data
This is part where we bring in the infrastructures, the buildings, highways that are affected by the flood. Using the QuickOSM plugin, we’ll run separate queries for the roads, and the buildings. This the query we’ll be using Key = ‘building’, Key = ‘highway’ and Key = ‘waterway’, leaving the ‘Value’ field blank each time.
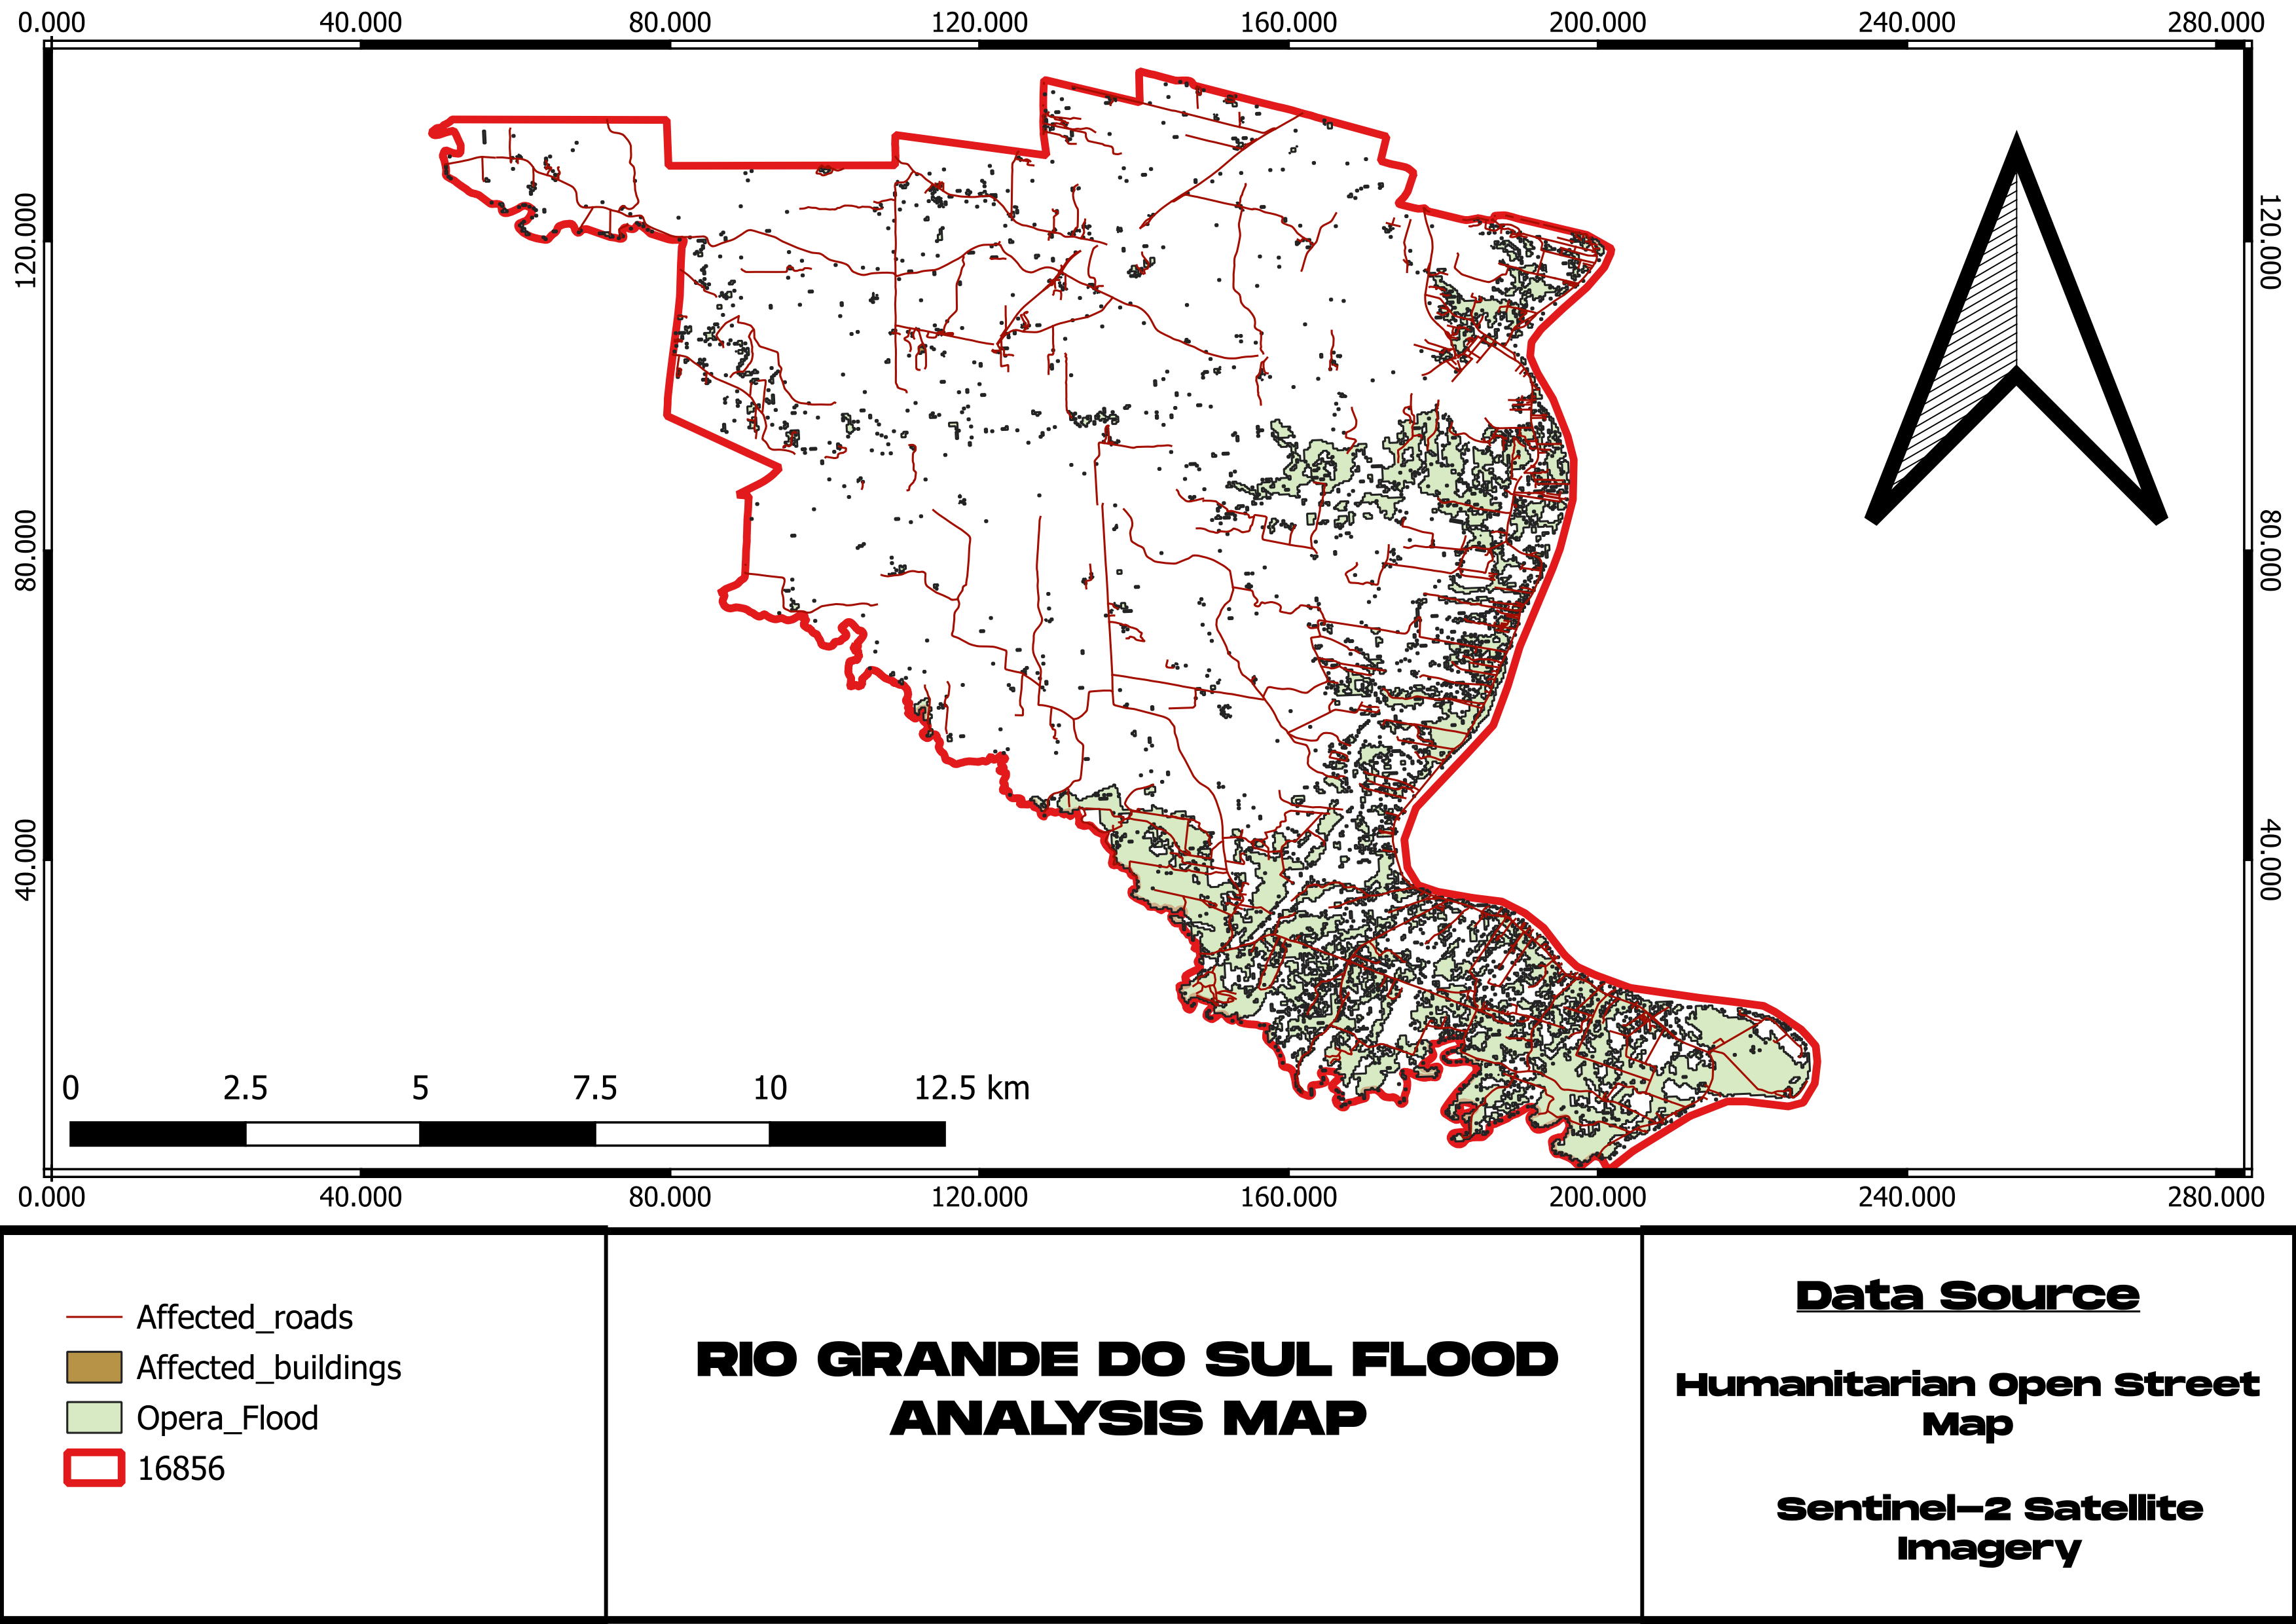
When the data is done being downloaded, we will then highlight the buildings and that intersect the buffered layer, using the Research Tools under the Vector Tools, the result gotten from this will then be exported as a geojson file, these are the infrastructures that have been affected by the Rio Grande do Sol Floods.
Conclusion
The analysis of the Rio Grande do Sul floods reveals the extensive damage to infrastructure, with 1,836 buildings and 634 roads affected across the region. This disruption has had a profound impact on both residential and commercial areas, isolating communities and hindering emergency response efforts. The flood damage underscores the vulnerability of critical infrastructure in the state and highlights the need for enhanced flood resilience and better urban planning to mitigate future risks.
Subscribe to my newsletter
Read articles from Precious Bassey directly inside your inbox. Subscribe to the newsletter, and don't miss out.
Written by
