Observability using Linkerd : RPS Monitoring
 Ayush Tripathi
What is a service mesh?
A service mesh is a tool that helps different parts of an app (called microservices) talk to each other in a safe and organized way. In modern apps, services need to send and receive data across the network, and managing this can be tricky. A service mesh takes care of important tasks like making sure traffic goes to the right place, spreading the load evenly, and securing data between services.
Instead of adding extra code to handle these tasks, a service mesh uses small helpers called sidecars that sit next to each service and manage communication for them. This way, developers don’t need to change their app code to improve things like security and performance. ‘Linkerd’ is a popular service mesh which also provides tools to monitor and track how services are working together.
What is Linkerd?
Linkerd is an open-source service mesh for Kubernetes that provides features like observability, security, and reliability for microservices. It uses lightweight proxies (sidecars) to handle communication between services, enabling functionalities like automatic retries, mutual TLS, and real-time metrics.
In terms of use cases, Linkerd can be used for:
Service Discovery & Load Balancing: Automatically finds and balances traffic across instances.
Security: Implements mTLS for secure service-to-service communication.
Traffic Shaping & Fault Injection: Controls traffic flow and simulates failures for testing.
Observability: Offers detailed metrics such as latency, success rate, and request-per-second (RPS) monitoring, helping to identify performance bottlenecks and troubleshoot issues.
There are a lot more use cases for Linkerd and I’ve listed only a few. RPS monitoring specifically allows teams to track the number of requests handled per second by each service, aiding in capacity planning, anomaly detection, and performance tuning. We’ll focus on the observability part in this article.
Hands-on
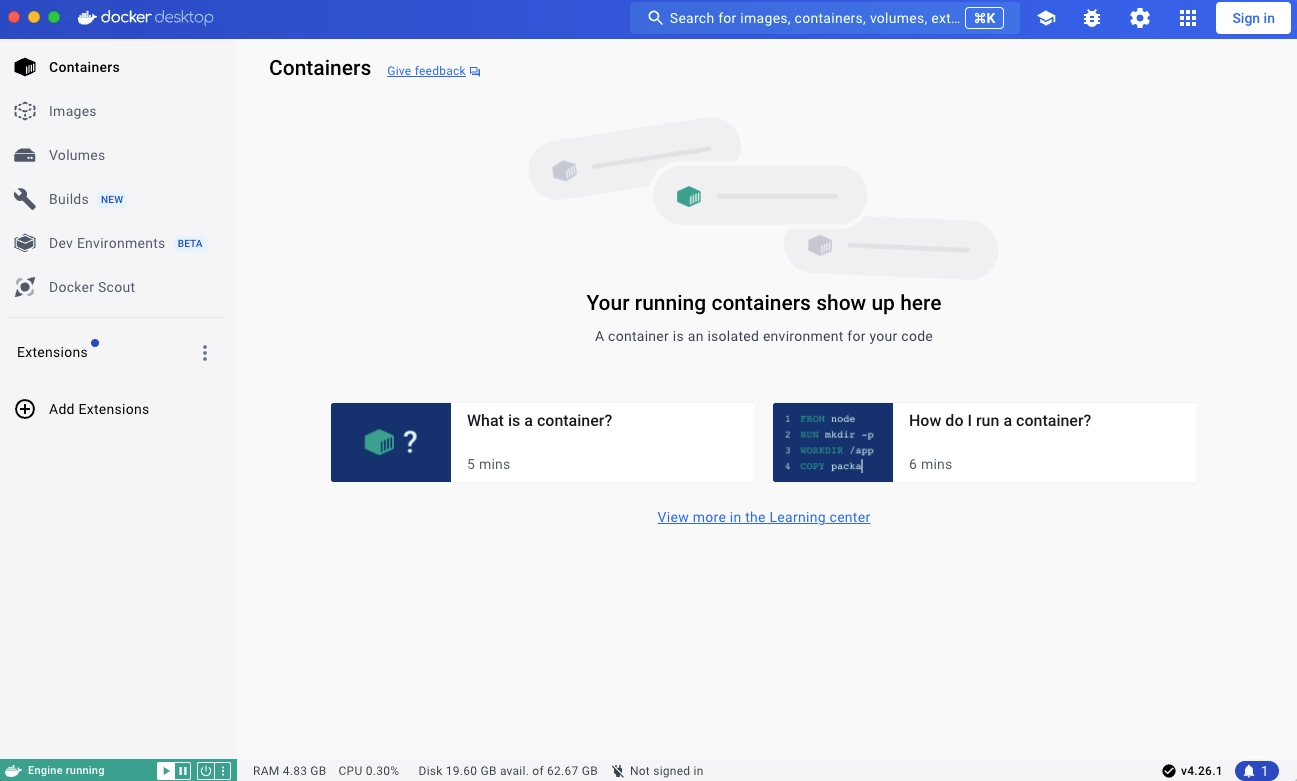
Start your docker runtime, I have used colima, you can use Docker Desktop. Just open the Docker Desktop application and it will set itself up automatically. (make sure engine is running - bottom left)
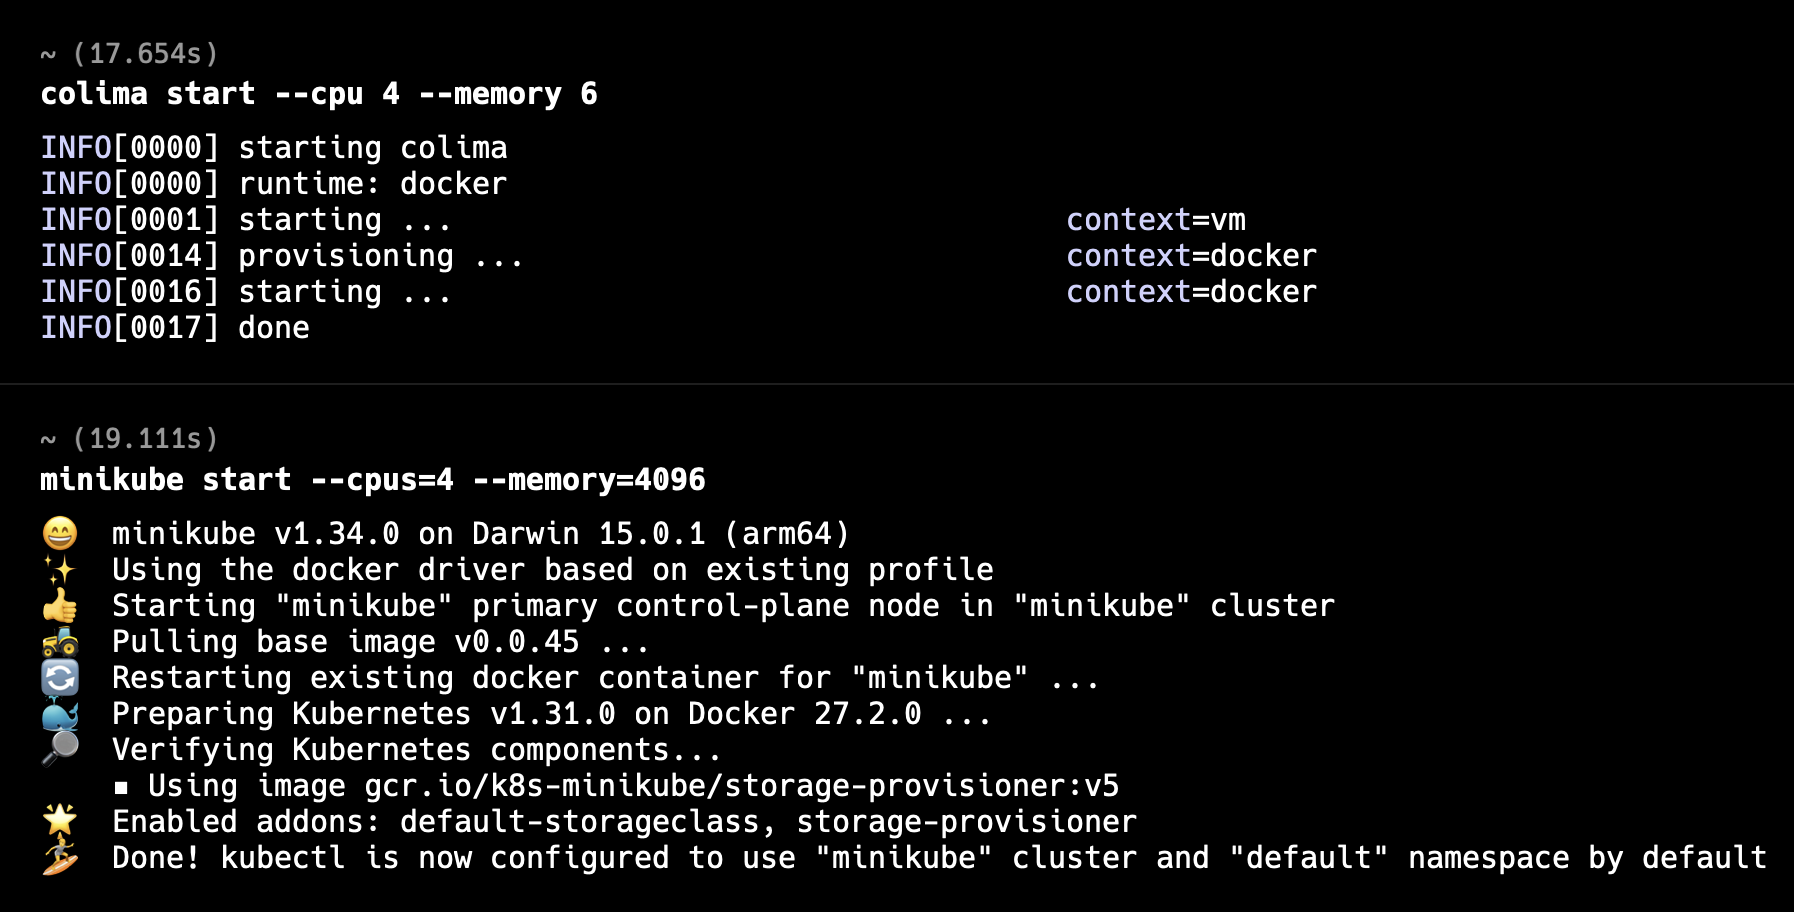
Next start the minikube cluster on your laptop.
Vanilla installation of Linkerd
https://linkerd.io/2.16/getting-started/
Visit this official installation setup of Linkerd and do it in your minikube cluster. No modifications need to be done, simply copy and paste the commands mentioned. I’m not including the commands here because they are already present clearly in this linked page.
Make sure you install linkerd-viz as well (it is present at the bottom of the article so it is easy to miss). Just skip the demo application part - we will use our own application for this article.
Create a deployment for monitoring
Next, we will create a different namespace for our application and apply our deployment and service manifest which are available in this repository.
https://gitlab.com/tripathiayush23/podinfo.git
Nothing fancy is present in these manifests, we have simply pulled a docker public image and created a standard manifest (which you will get even if you generate deployment and service snippets using official k8s extension on vscode).
kubectl create ns podinfo

# to apply manifests, move to the path where the manifests are present
cd <manifest_directory>
kubectl apply -f deployments.yaml
kubectl apply -f services.yaml
This is how the namespaces list should look like now, you can check by using
kubectl get ns

Injecting the deployment
Injecting is the process of adding the linkerd sidecars to each pod of your application. To do so,
Start the linkerd dashboard
linkerd dashboard &
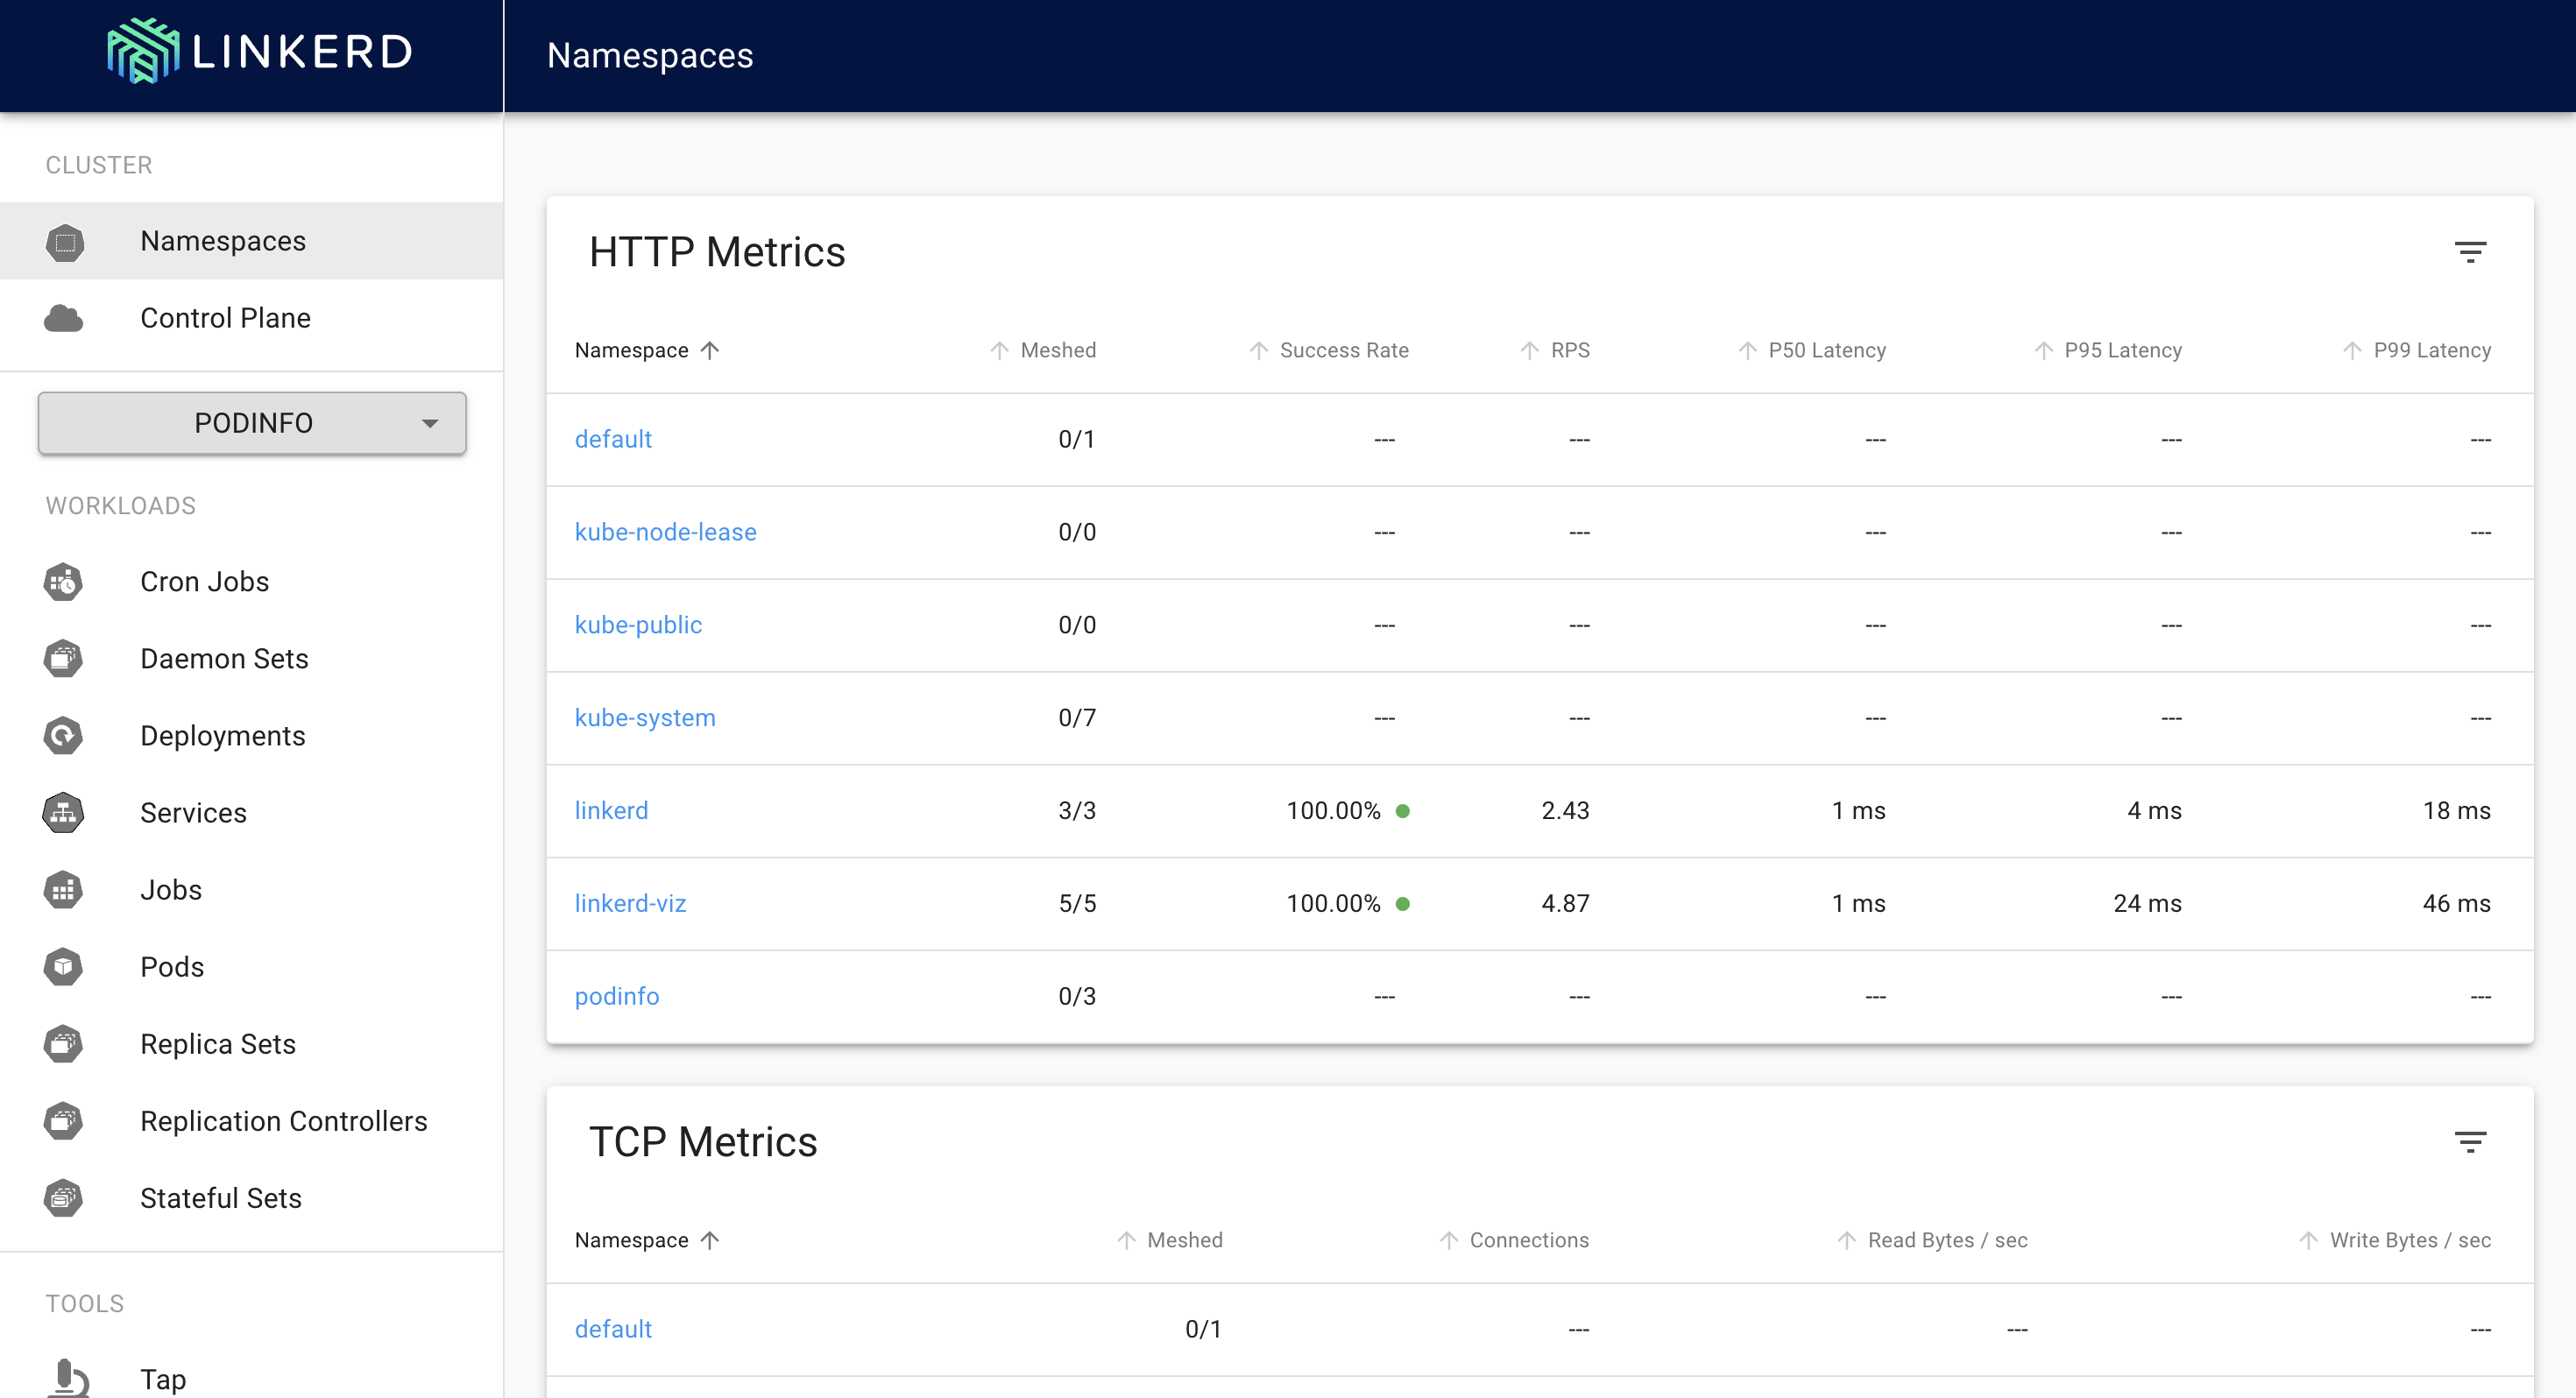
you can see that podinfo namespace is shown but no metrics are present right now. To get the metrics we will need to “inject“ linkerd into the namespace. Injecting simply means that a linkerd sidecar proxy will now be attached to each pod of the namespace podinfo.
kubectl get deploy -n podinfo -o yaml | linkerd inject - | kubectl apply -f -
simply run this command and change the name of the namespace with the name you have used. My namespace is podinfo.

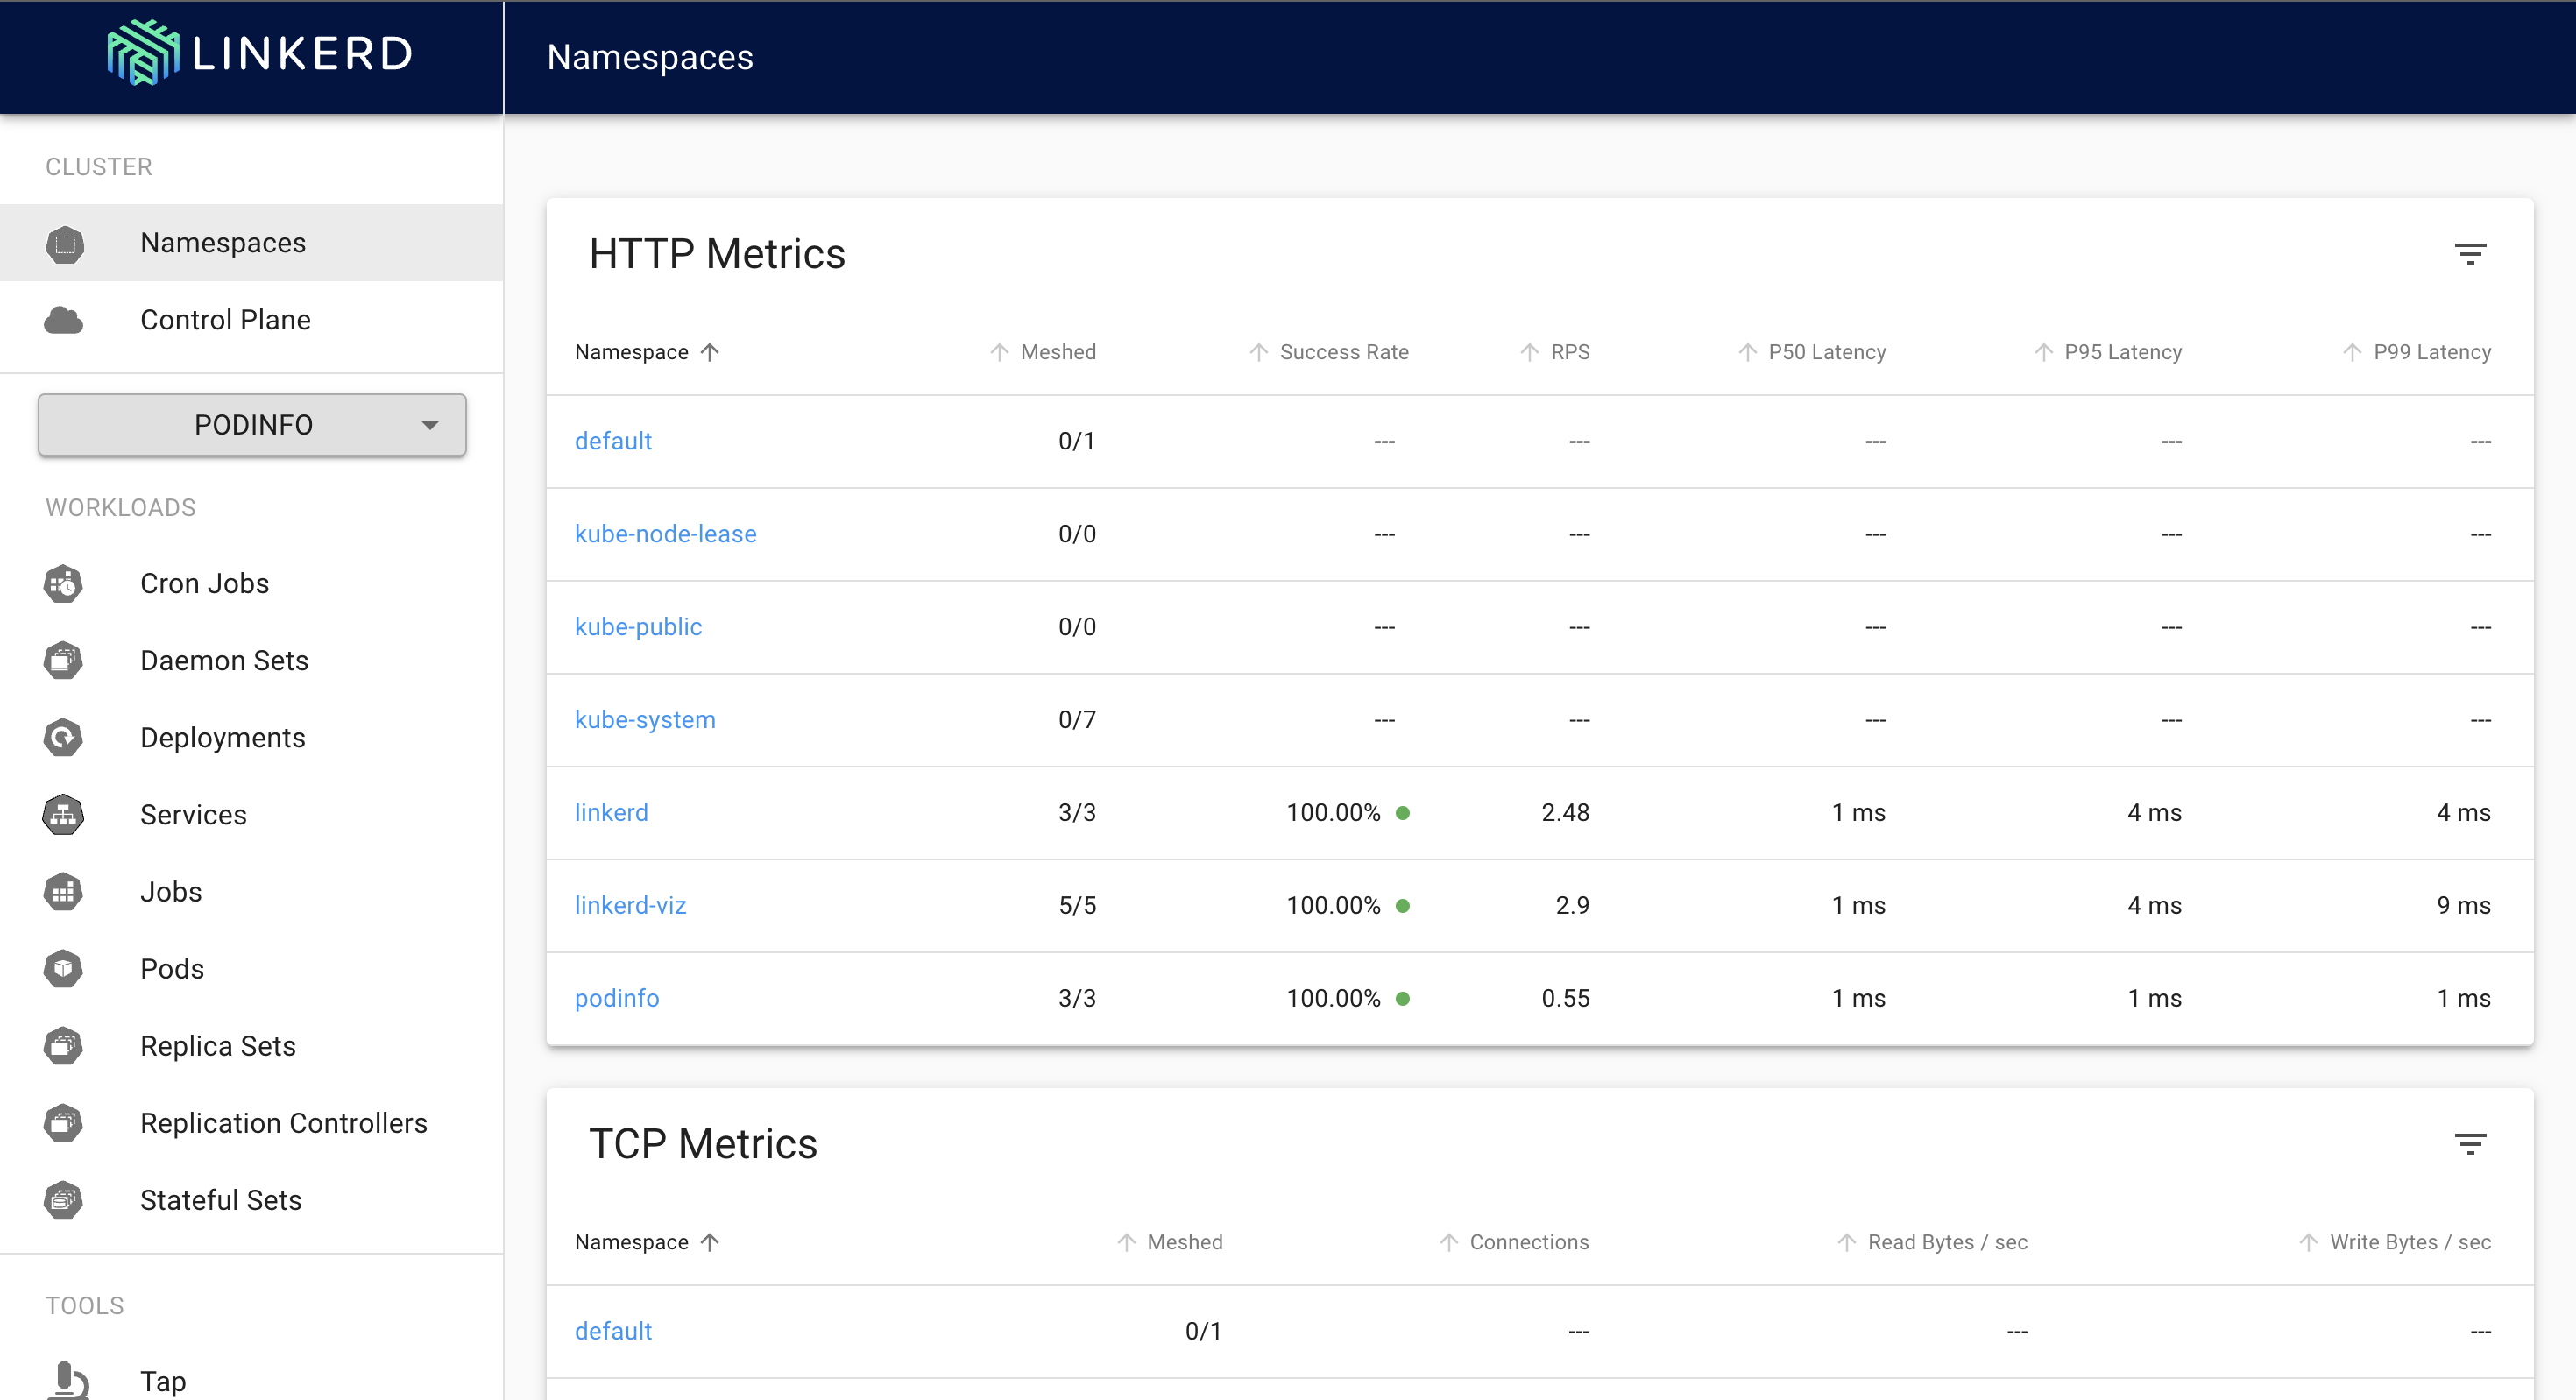
Now you will see that our namespace is properly meshed with 100% success rate. You can also see some RPS being shown but this is different RPS (prometheus scrape RPS), we will be looking into route level RPS for each endpoint of our deployment. (Endpoint means each URL that you can hit and get a result)
Apply service profile
Service profile is just another manifest we need to apply to get the route level RPS. It is simply a manifest that specifies the endpoints we want to monitor.
apiVersion: linkerd.io/v1alpha2
kind: ServiceProfile
metadata:
  creationTimestamp: null
  name: podinfo.podinfo.svc.cluster.local
  namespace: podinfo
spec:
  routes:
  - condition:
      method: GET
      pathRegex: /
    name: GET /
  - condition:
      method: GET
      pathRegex: /healthz
    name: GET /healthz
  - condition:
      method: GET
      pathRegex: /version
    name: GET /version
  - condition:
      method: GET
      pathRegex: /api/info
    name: GET /api/info
In the above snippet everything is pretty straightforward except one line
name: podinfo.podinfo.svc.cluster.local
podinfo.podinfo.svc.cluster.local is the fully qualified domain name (FQDN) of a service in Kubernetes. Here's what each part means:
podinfo(first part): This is the name of the service. It represents the actual service object we created in the cluster earlier.podinfo(second part): This is the namespace in which the service is running. Kubernetes organizes resources in namespaces, and here, the service is in thepodinfonamespace.svc: This stands for "service" and indicates that this DNS entry is for a Kubernetes service.cluster.local: This is the default domain for the cluster, indicating that the service exists within the local Kubernetes cluster network.
So, podinfo.podinfo.svc.cluster.local refers to the service named podinfo running in the podinfo namespace, and it can be accessed within the cluster using this full DNS name.
Next, simply apply the service profile manifest.
kubectl apply -f service-profile.yaml
Create some traffic to monitor via localhost
To check route level RPS navigate:
Namespace → podinfo → deployment/podinfo
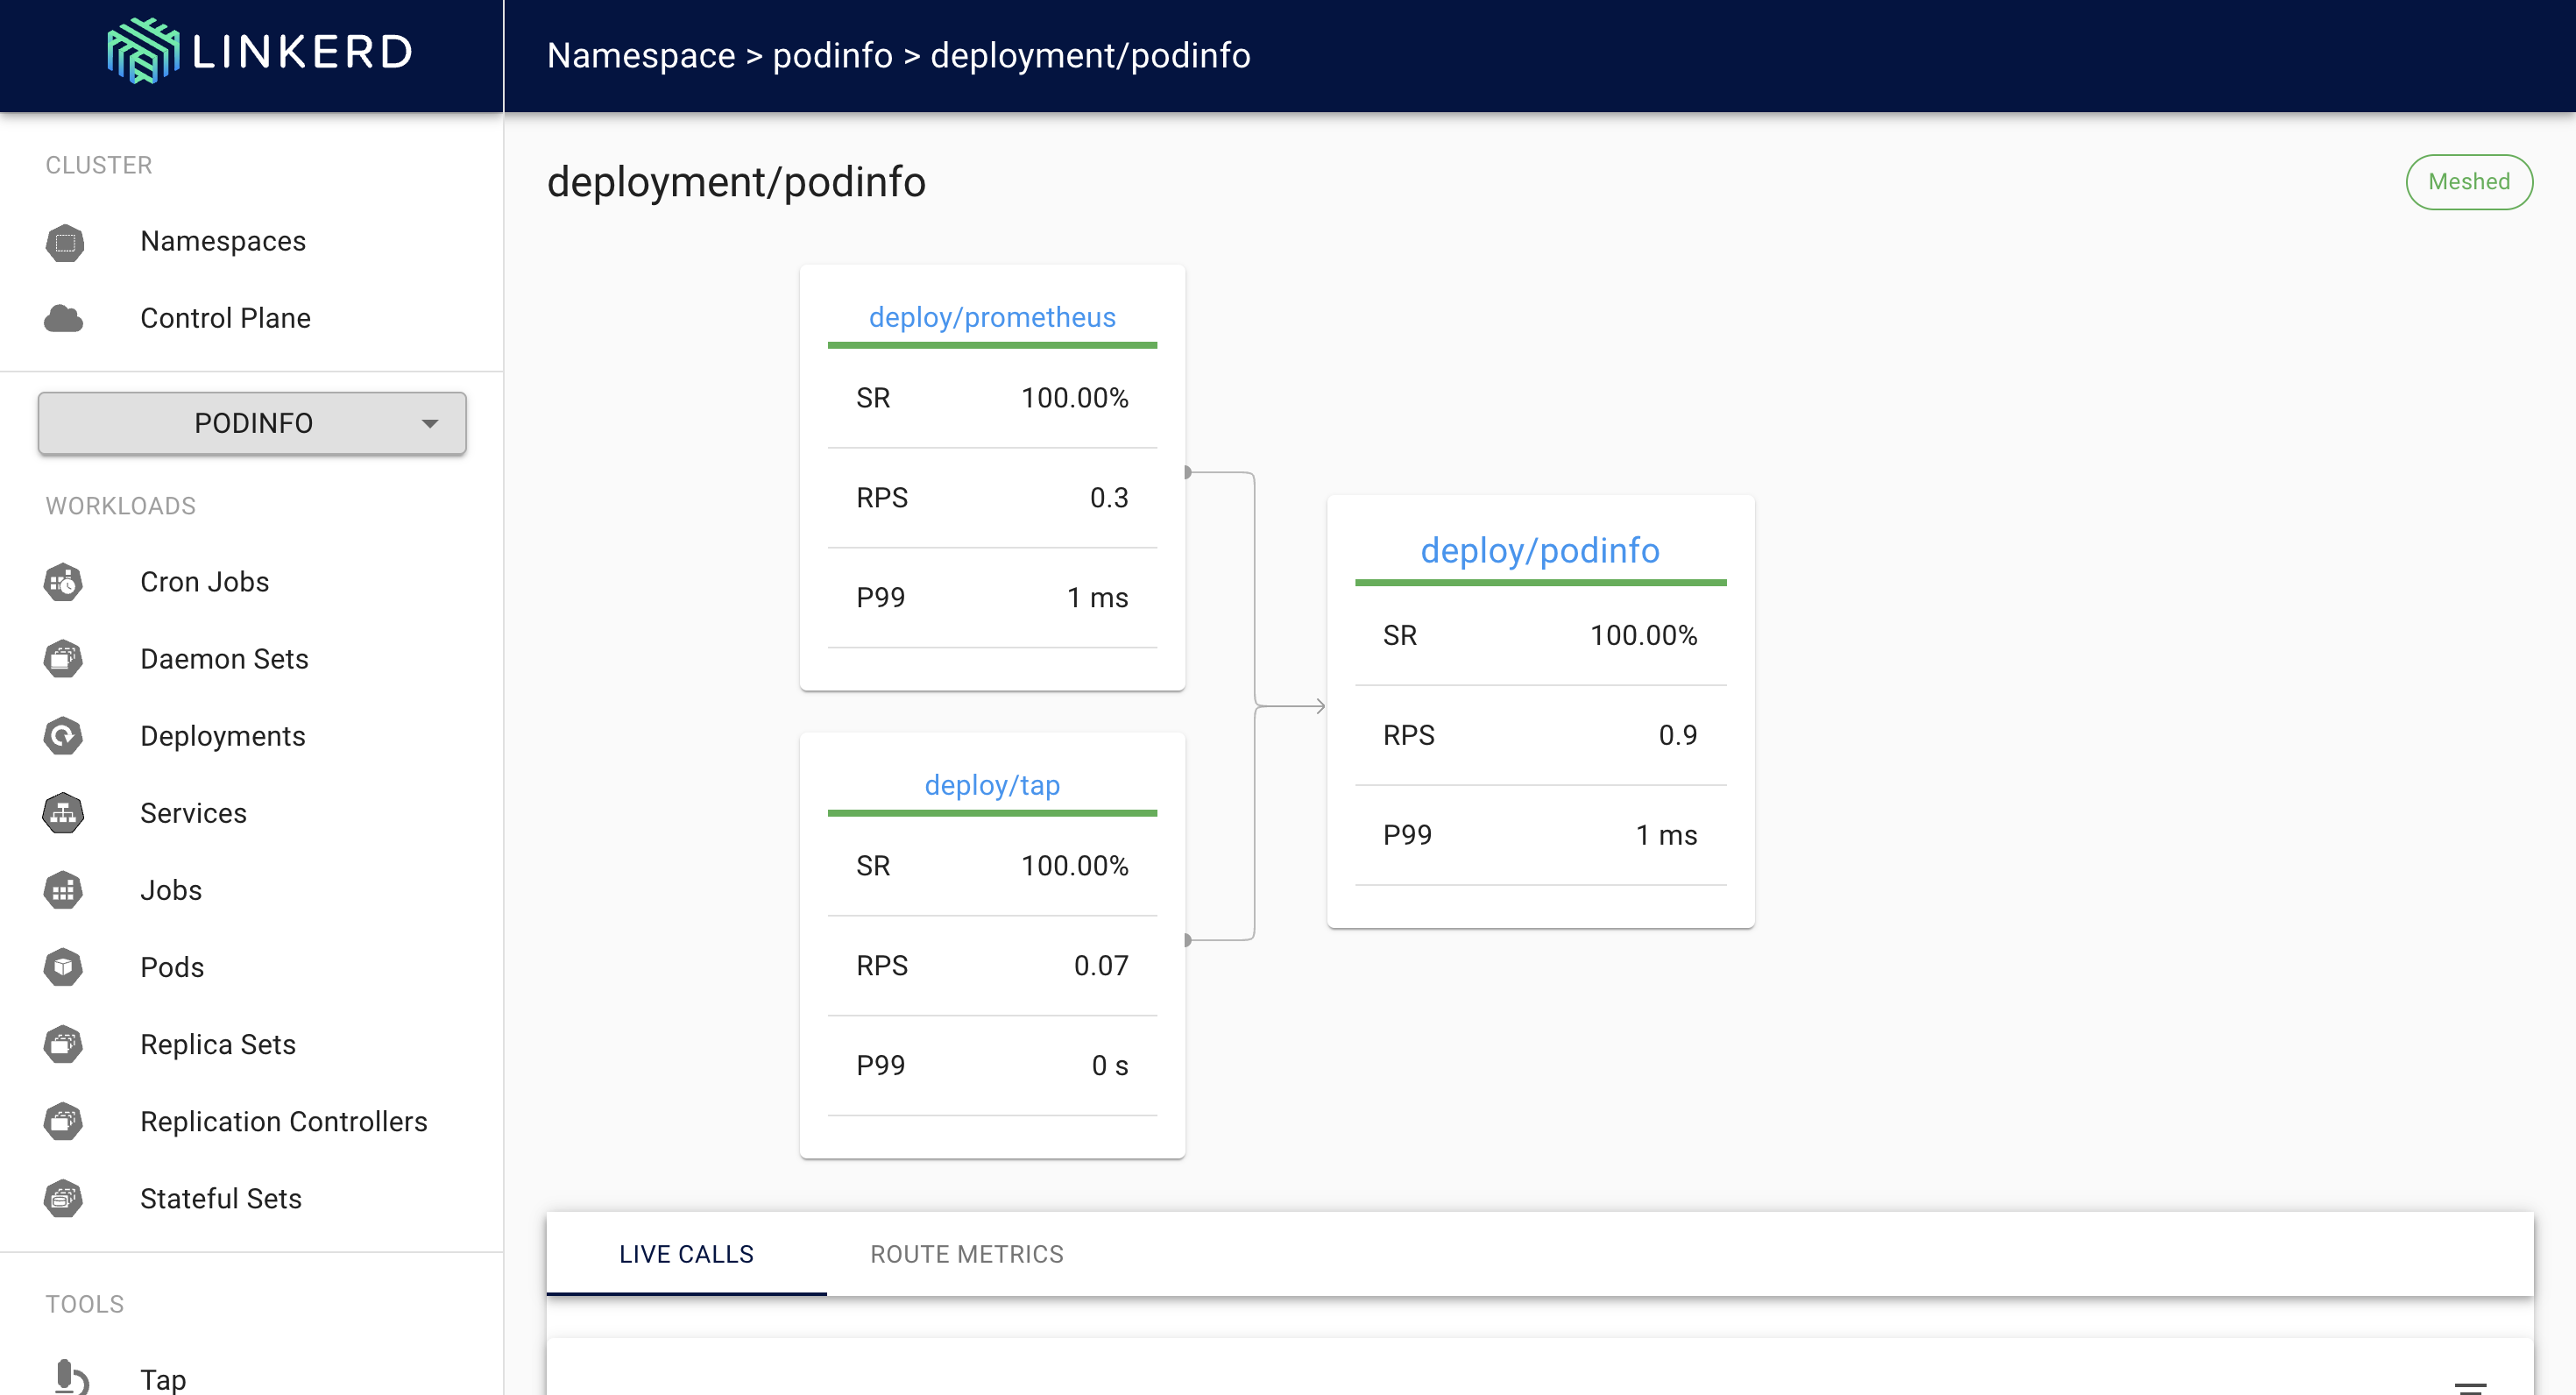
In the bottom of the screen click on the ‘Route Metrics’. Now if you see the route level RPS nothing will be visible except the endpoints we specified in the service profile.
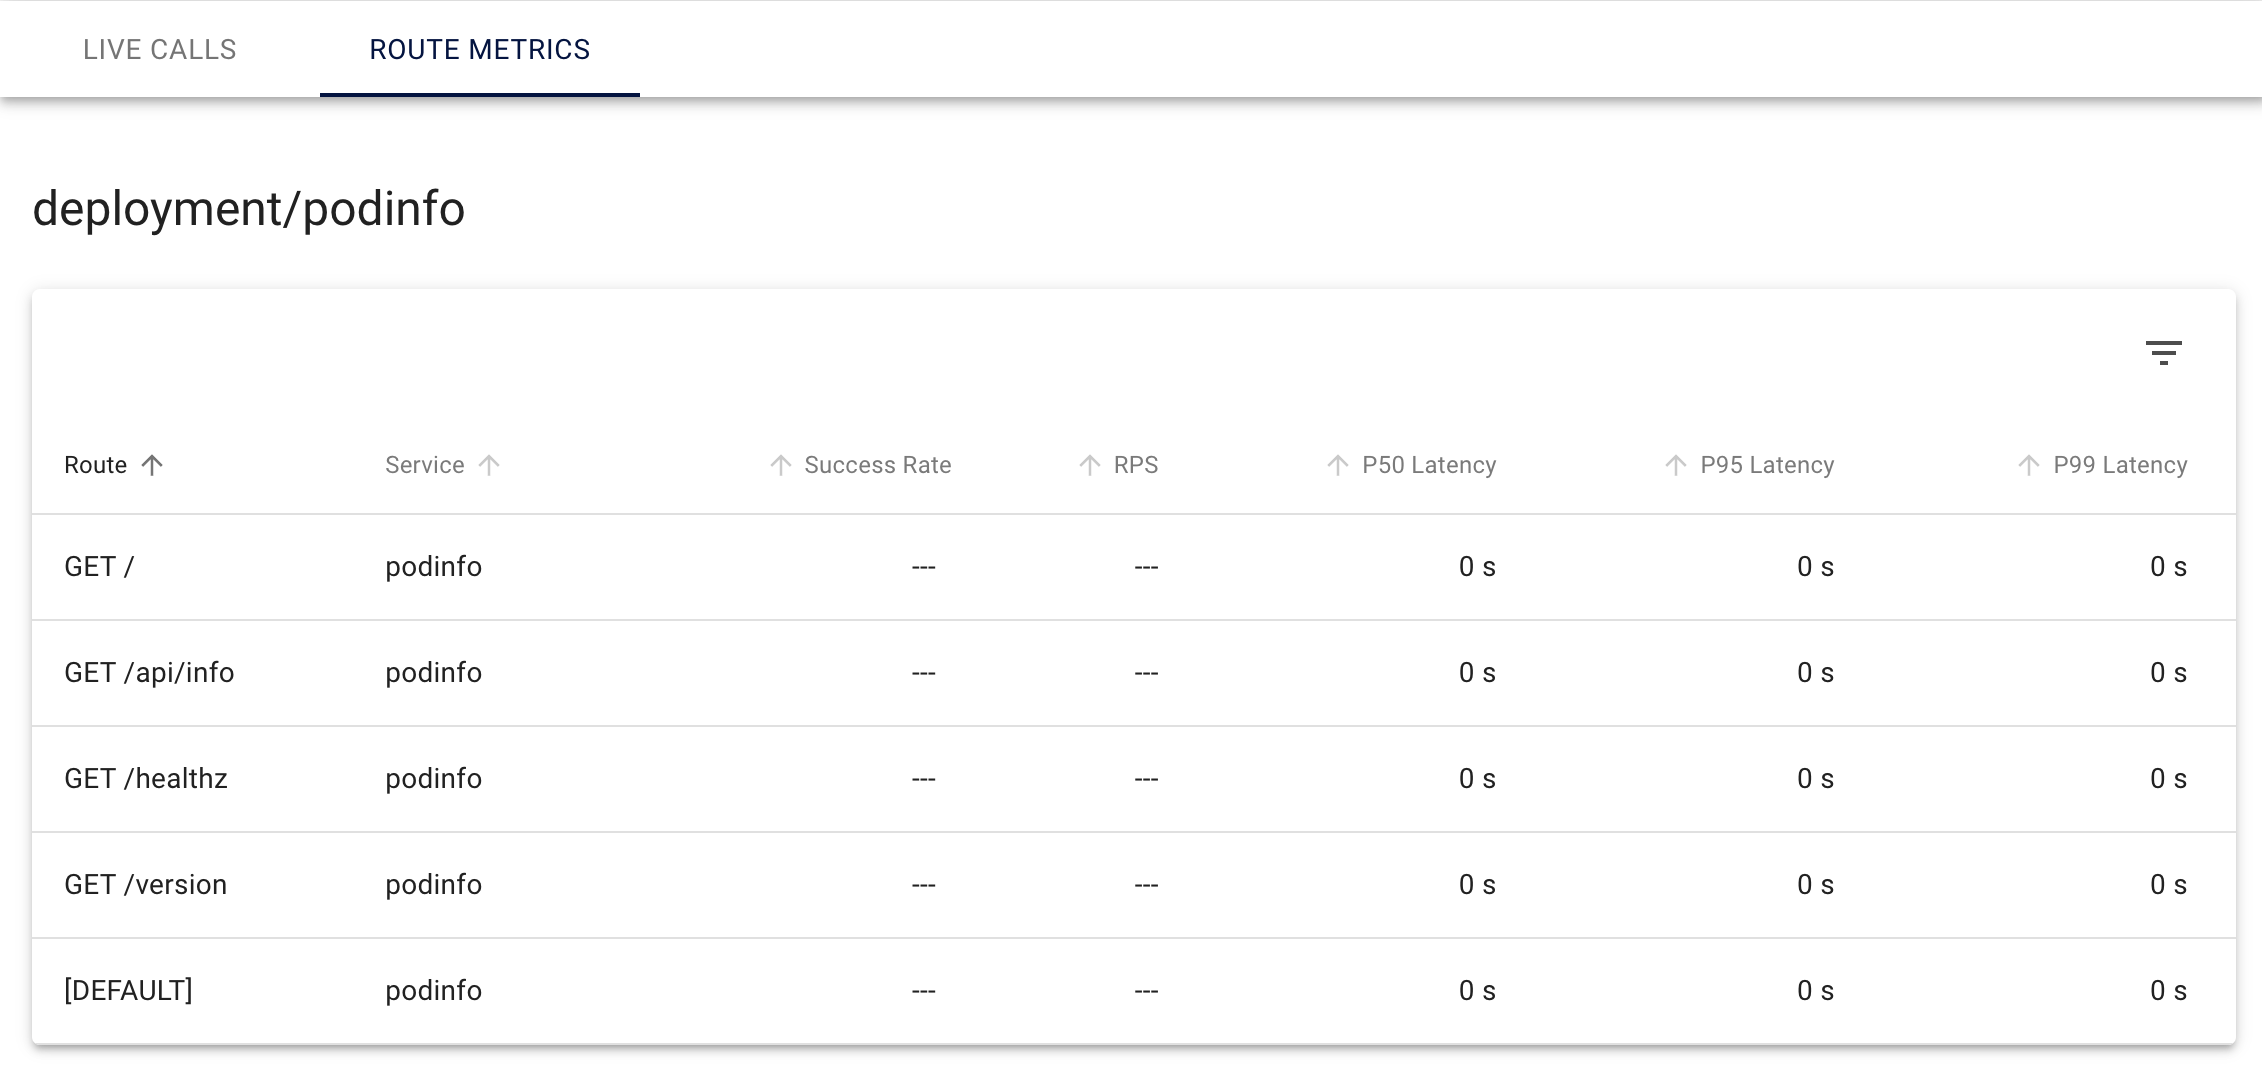
There is nothing wrong the procedure till now, then why aren’t you able to see anything?
Simply because there is no traffic to monitor 🙂. Lets create traffic by doing curl on the endpoints in a loop.
Run a minikube tunnel to expose our service (it is a loadbalancer).

while true; do
  curl http://localhost:9898/
  curl http://localhost:9898/version
  curl http://localhost:9898/api/info
  curl http://localhost:9898/healthz
  sleep 2
done
This is a simple infinite while loop which runs at an interval of 2s. In this loop, we curl all the endpoints of our application.
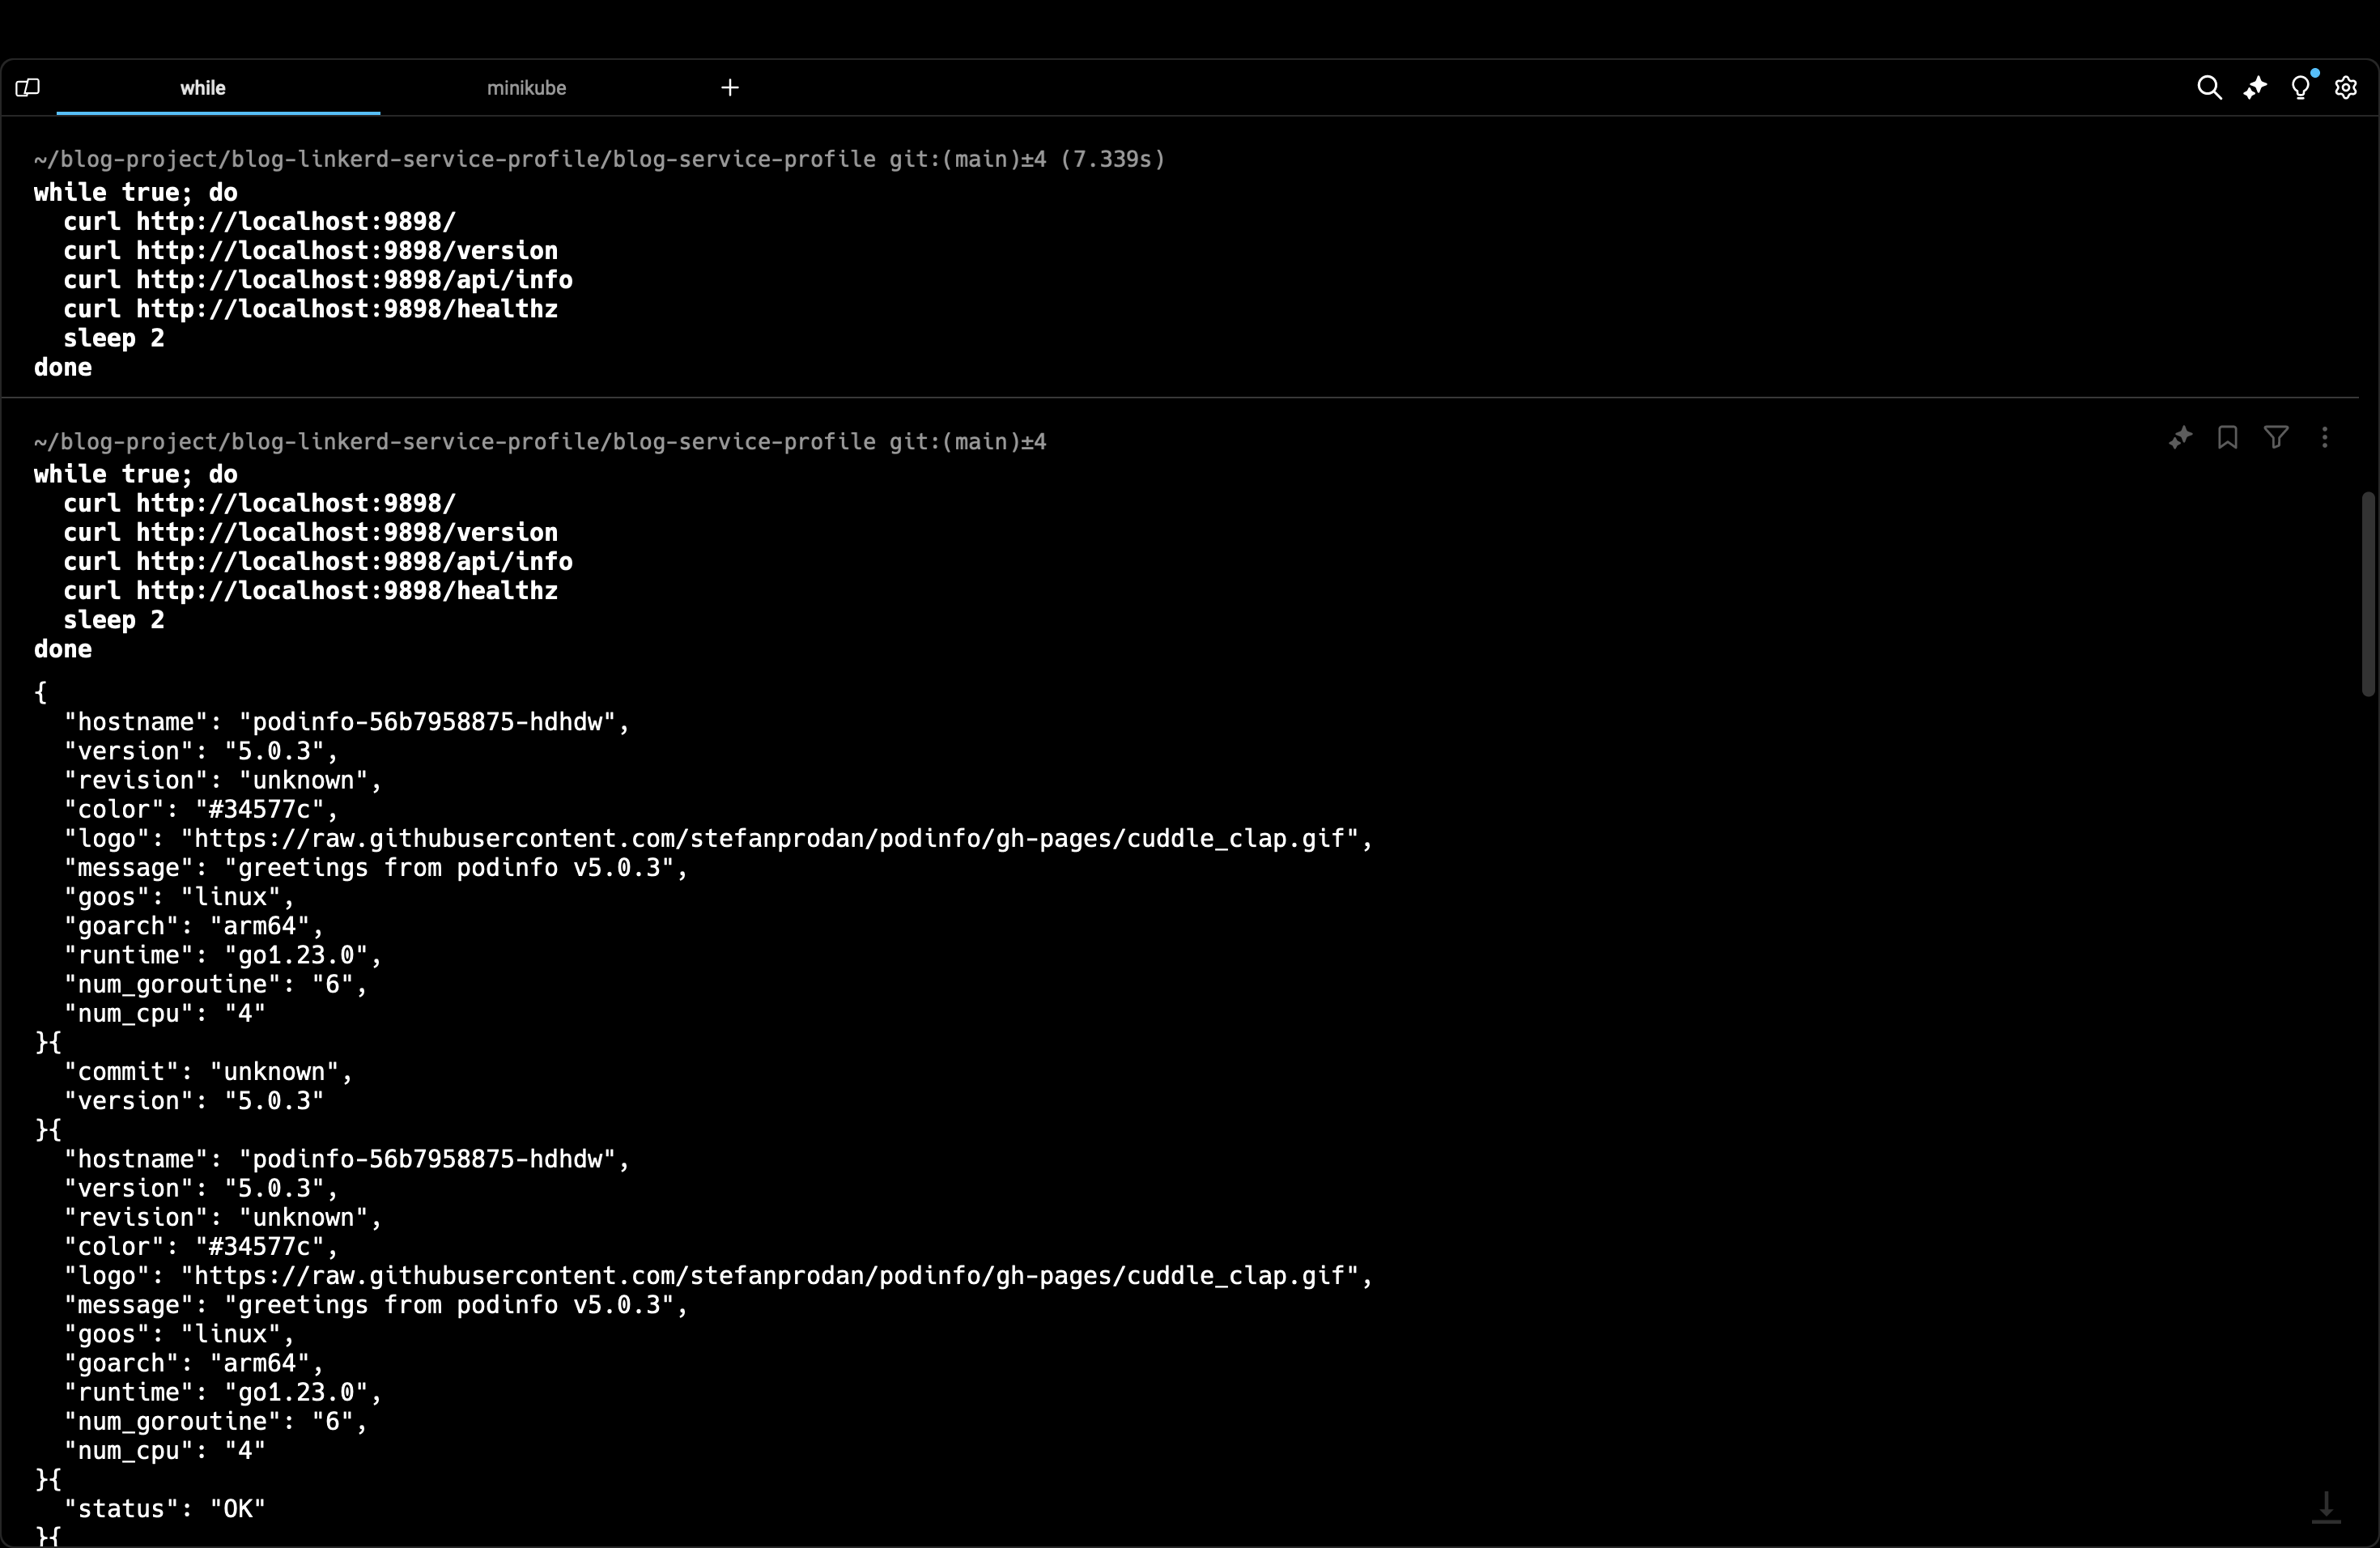
Now, you see that live calls are visible in the linkerd dashboard
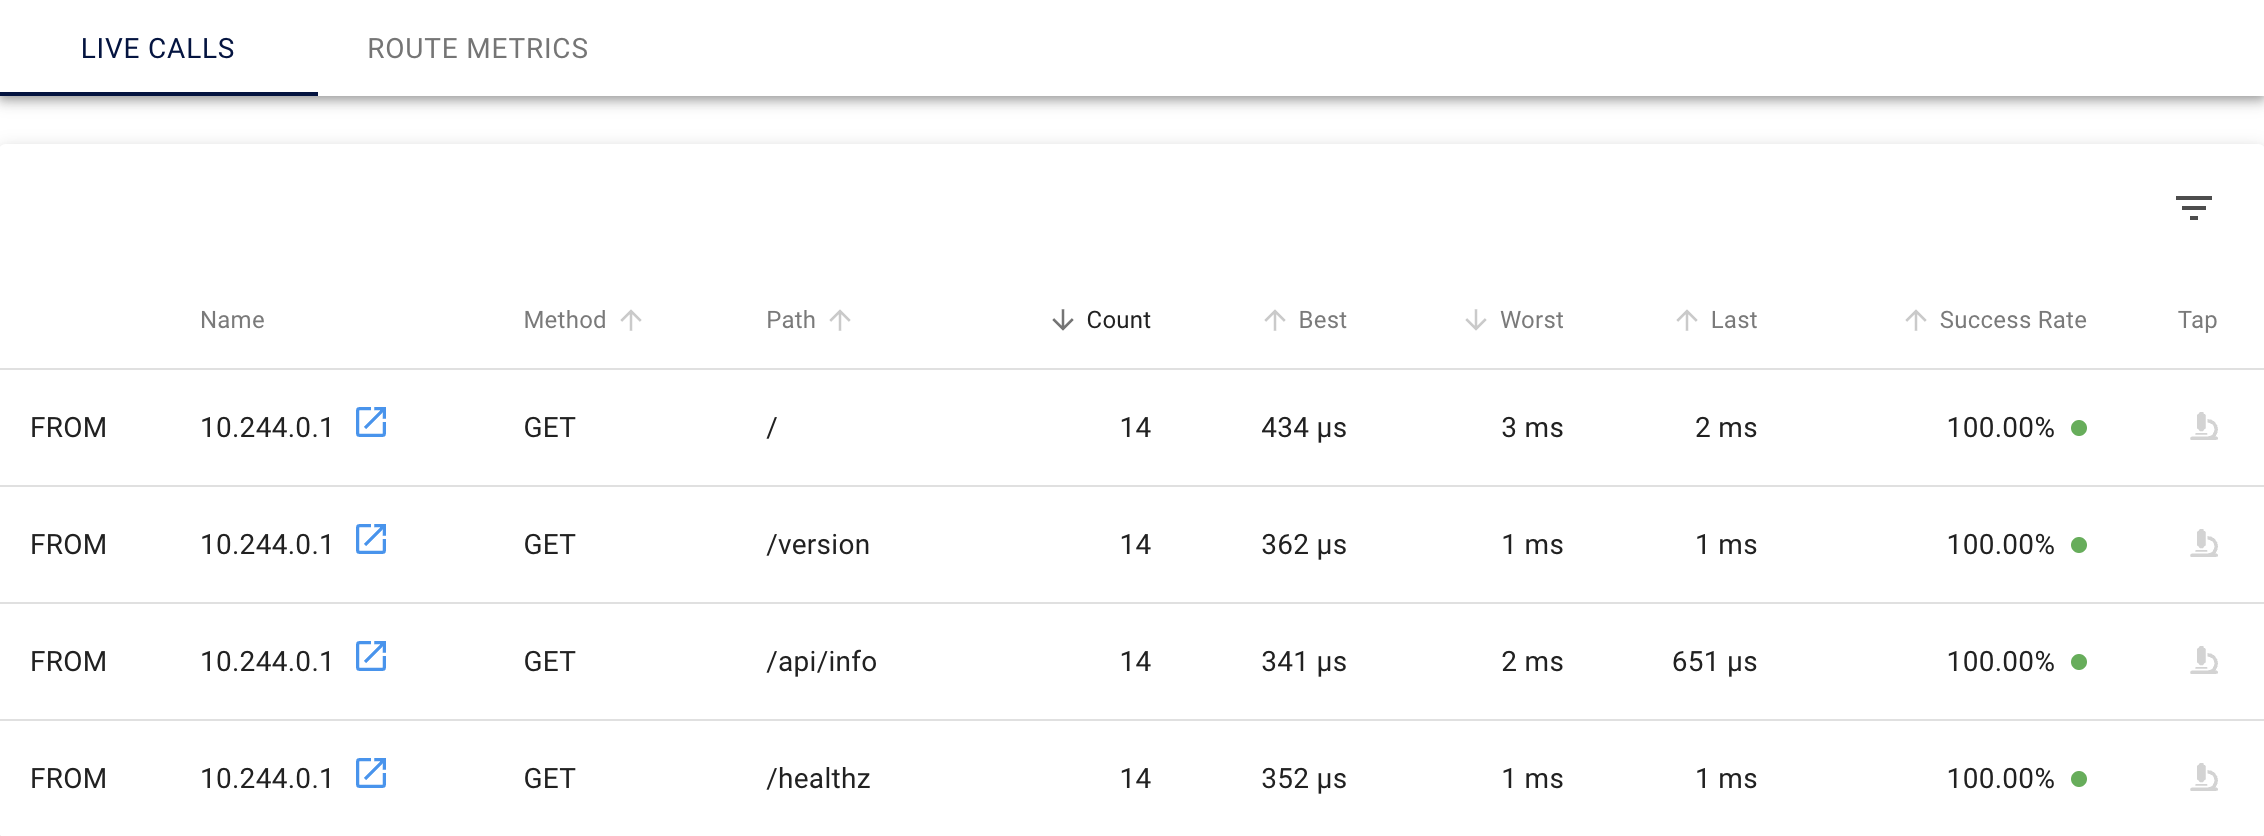
BUT, the route level RPS is still not visible. Why?
Here comes an important networking concept, I’ll simplify it to not confuse:
Linkerd will show you all the route level RPS for each endpoint only if the traffic flows through linkerd proxy. In simple terms traffic via the localhost is not considered for route level RPS because this traffic doesn’t flow through linkerd proxy. In the while traffic you can clearly see that the traffic is via localhost at port 9898 on all endpoints.
Creating actual traffic
To mitigate the above problem, we simply need to hit the service we have created directly using FQDN and not via localhost. To do so, there are many different ways, I’ll show the simplest possible approach.
First, create a random pod like I created a pod here using alpine image. Make sure the pod status is Running
# sleep infinity simply means that the container sleeps indefinitely
# allowing the pod to keep running
kubectl run alpine --image=alpine -n default -- sleep infinity

Next, we run an interactive shell inside the pod we just created.
kubectl exec -it alpine -n default -- ash

# curl is not directly available
apk add curl
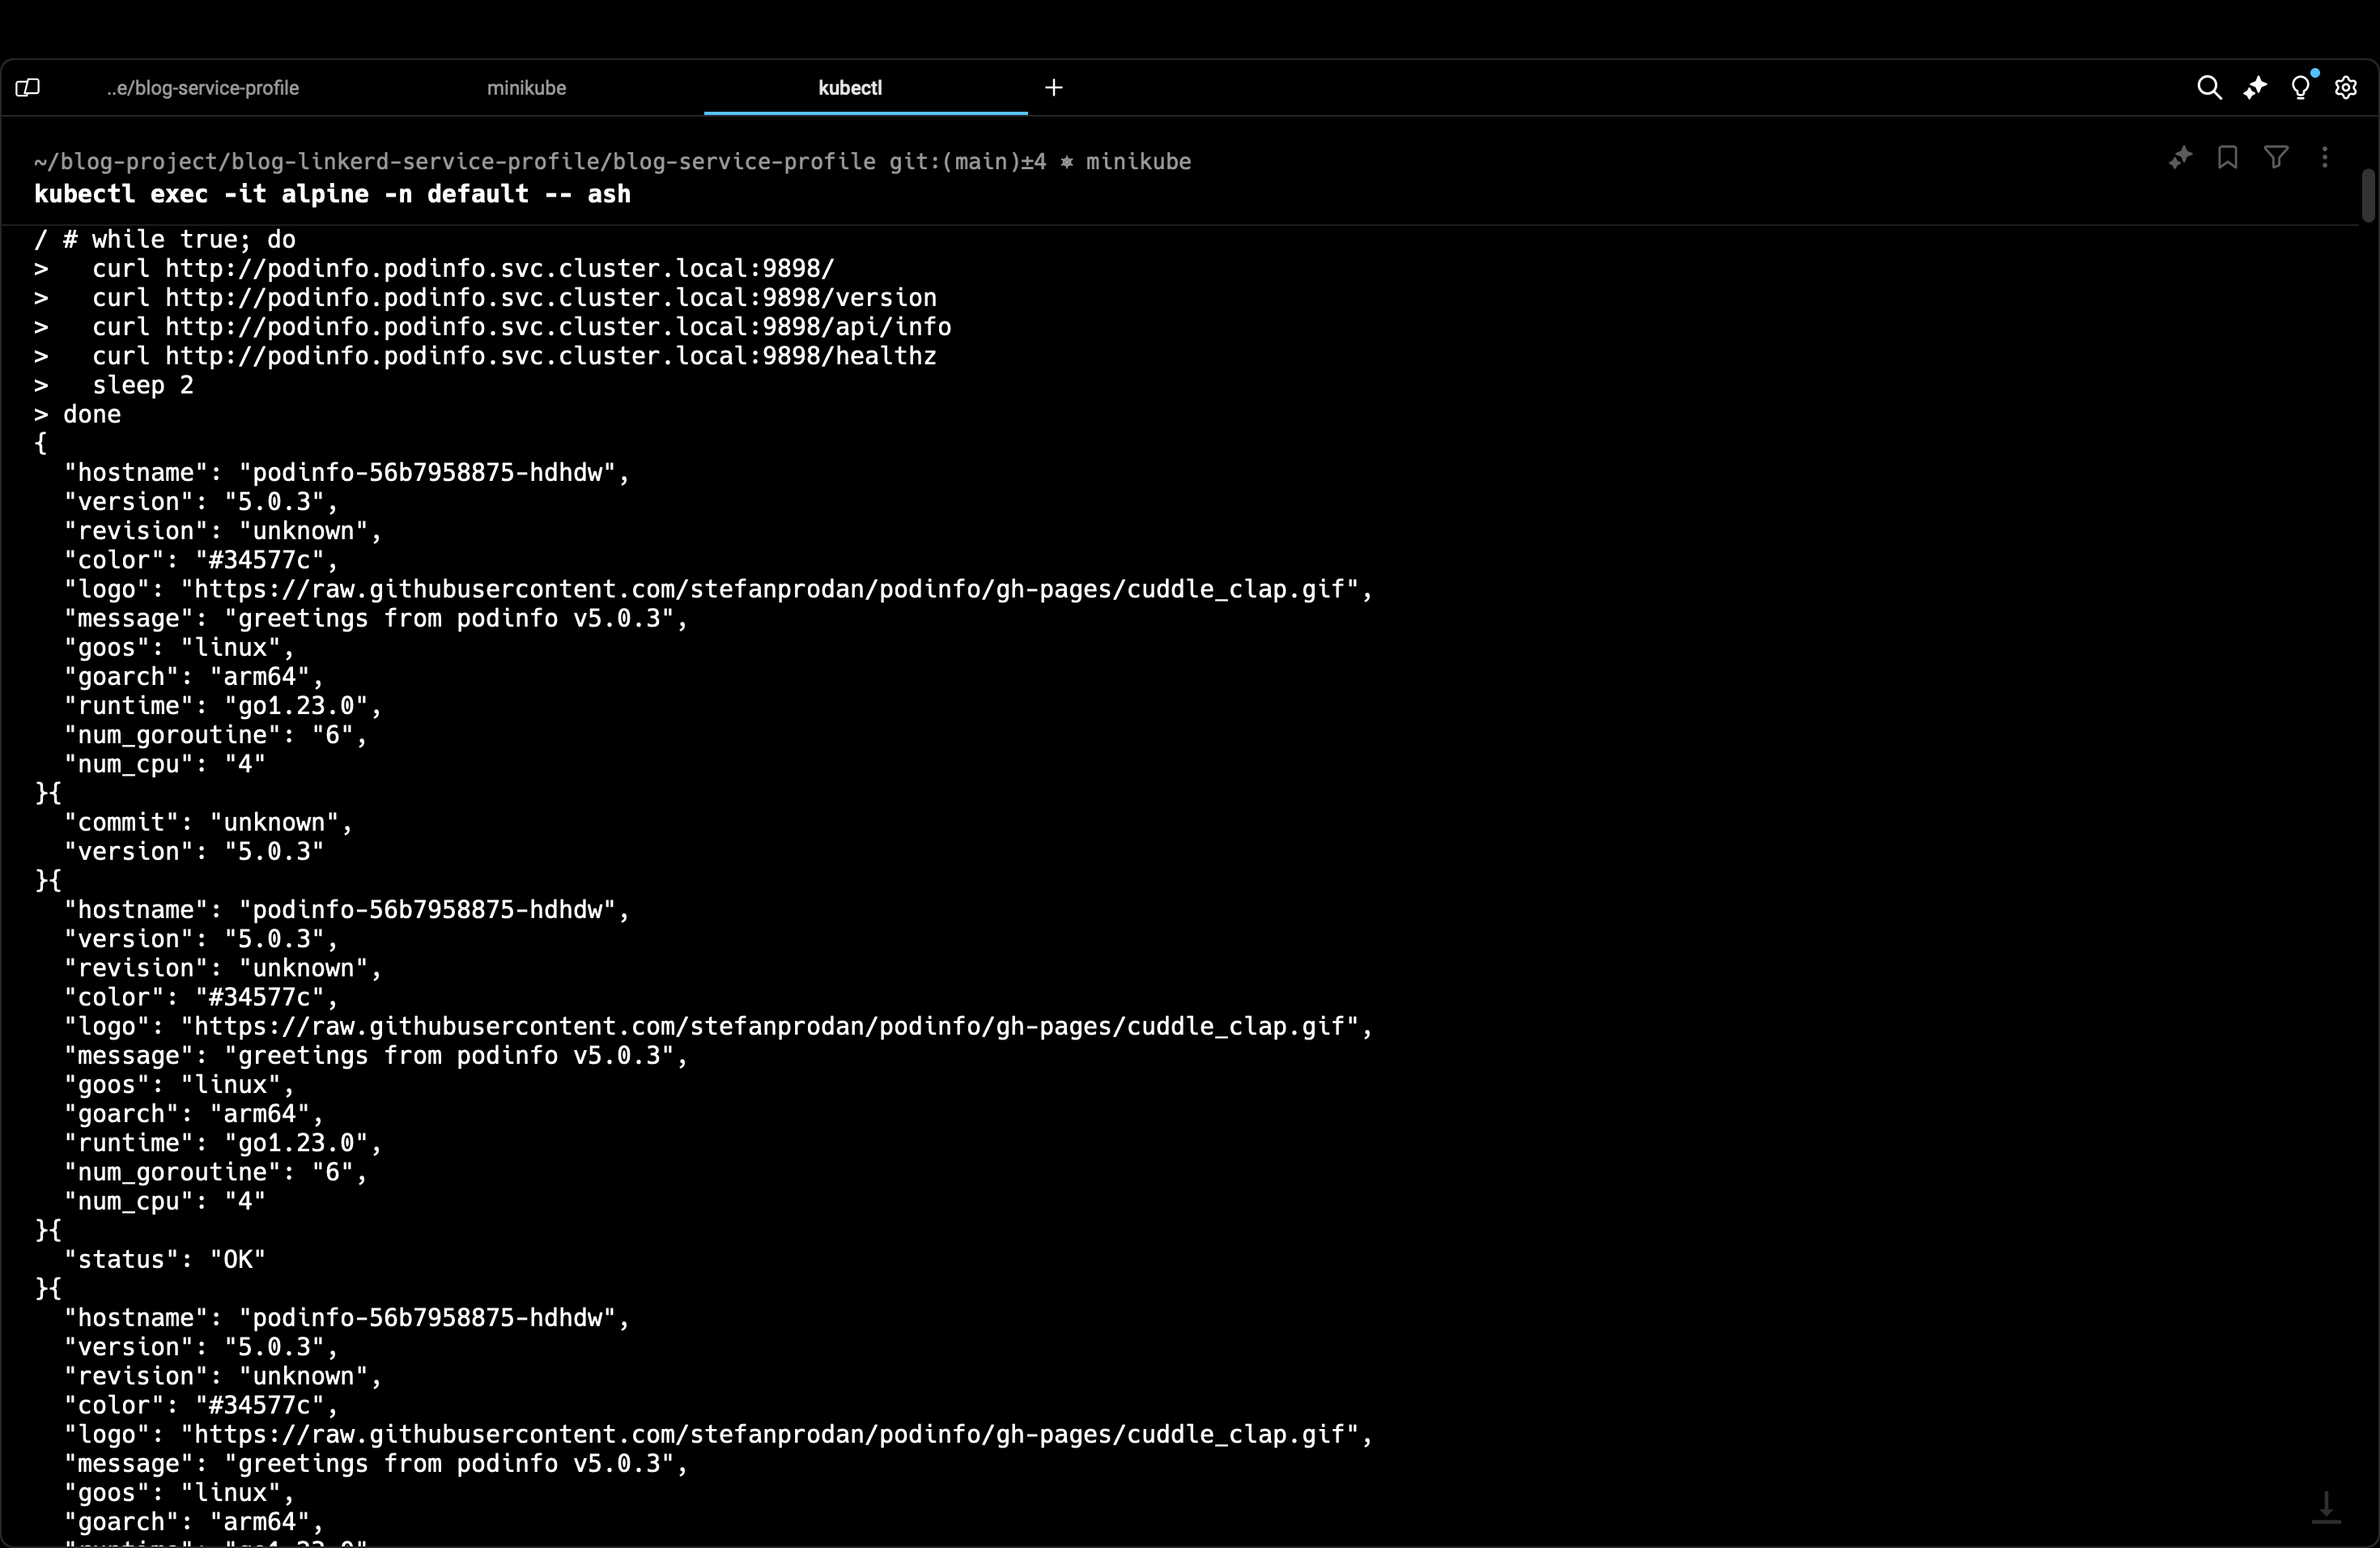
Now, we run the while traffic again but this time not on localhost but via the FQDN we used earlier.
while true; do
  curl http://podinfo.podinfo.svc.cluster.local:9898/
  curl http://podinfo.podinfo.svc.cluster.local:9898/version
  curl http://podinfo.podinfo.svc.cluster.local:9898/api/info
  curl http://podinfo.podinfo.svc.cluster.local:9898/healthz
  sleep 2
done
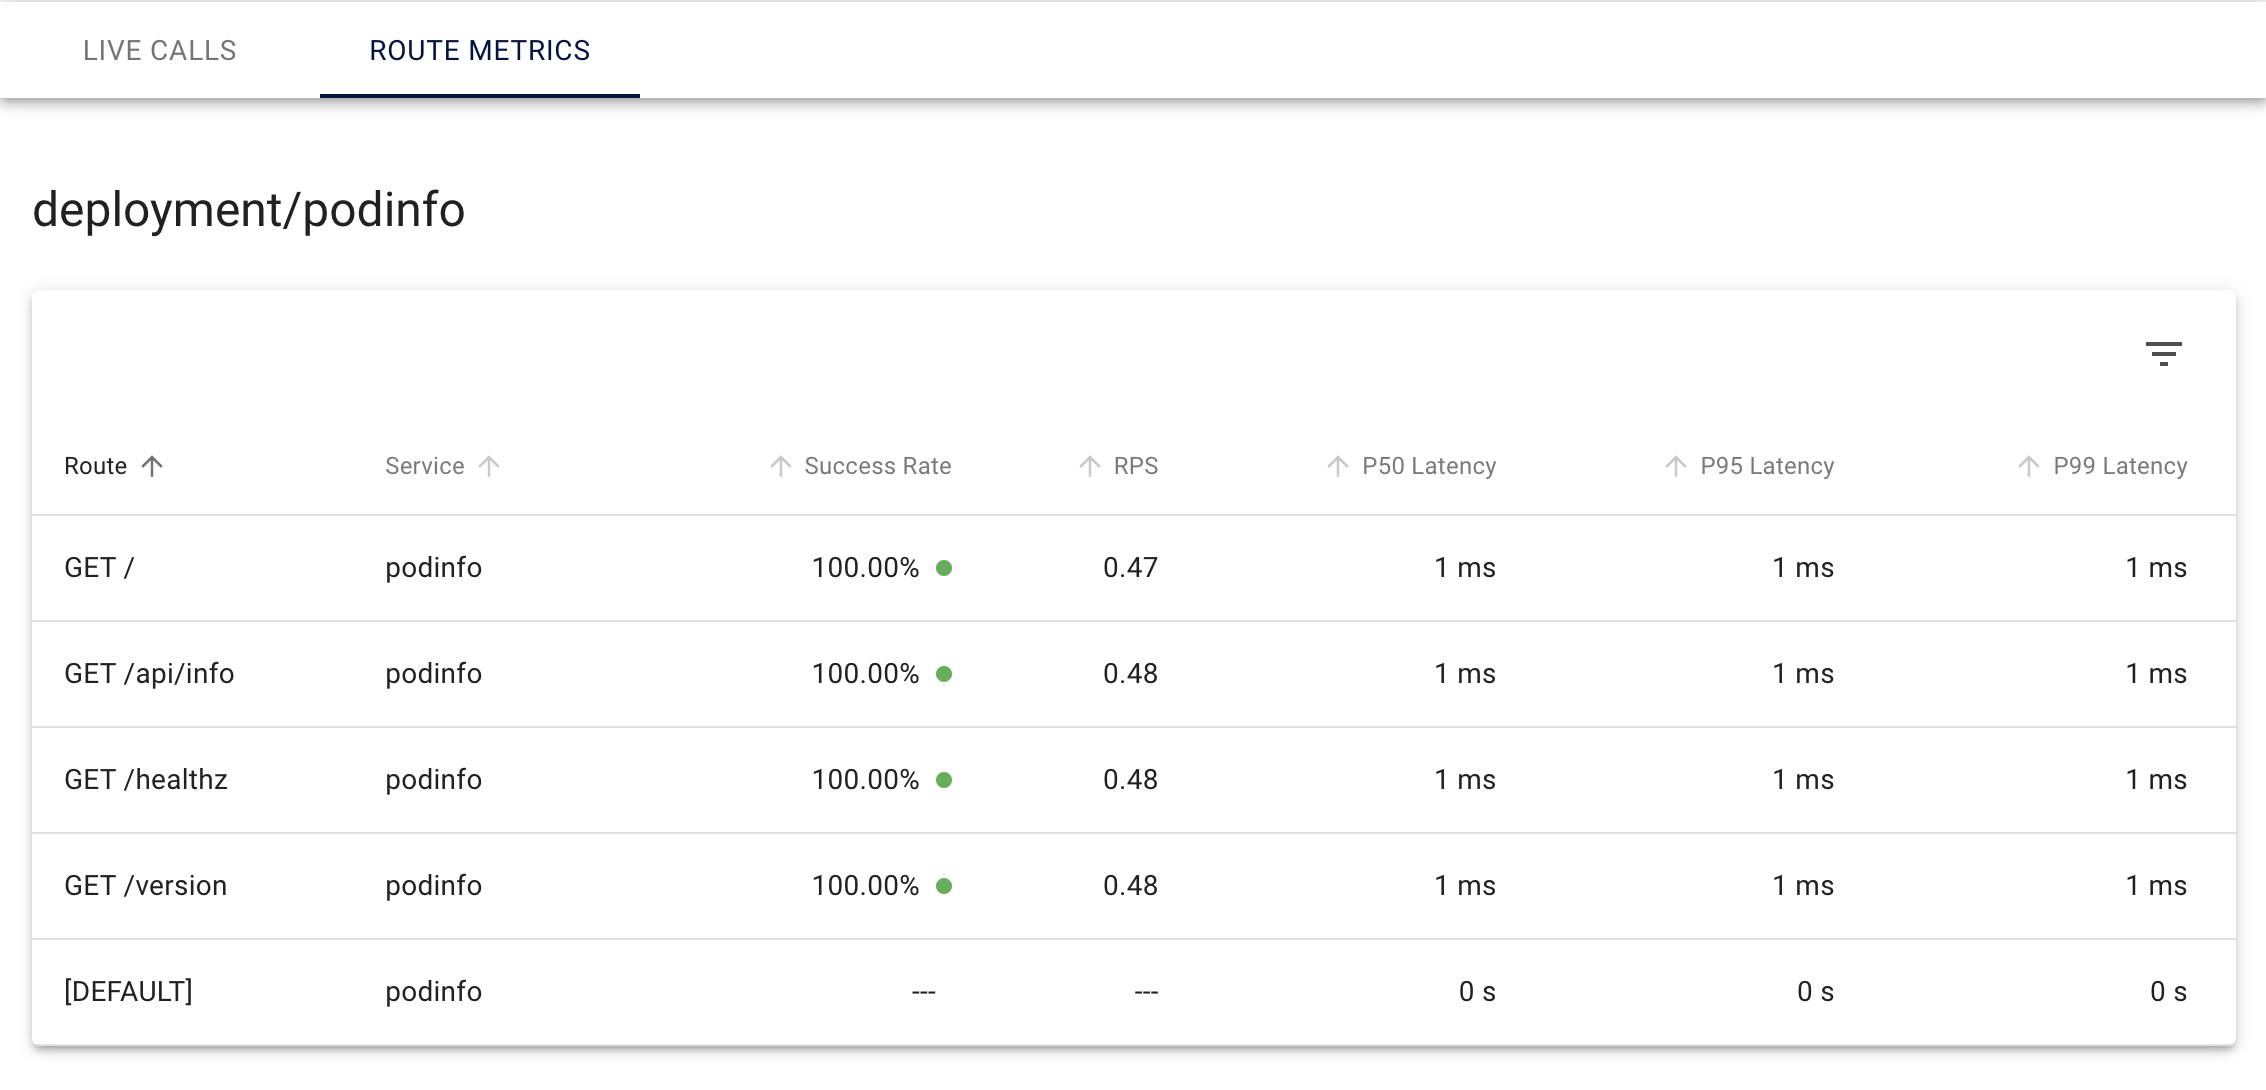
Getting the Route Level RPS
Now finally we can see the route level RPS for all the endpoints we specified in our service profile.
Connect with me: https://linktr.ee/ayusht02
Subscribe to my newsletter
Read articles from Ayush Tripathi directly inside your inbox. Subscribe to the newsletter, and don't miss out.
Written by

Ayush Tripathi
Ayush Tripathi
DevOps Engineer @ IDfy | Mentor @ GSSoC '24 / WoB '24