MACHINE LEARNING College Program
 Developer For College Student
Practical 1:Build a model to classify emails as spam or not spam using a small, labelled dataset
Link: https://colab.research.google.com/drive/1jLB6TDtXbHwfnsE1-R9HscxFz8uoRDSJ?usp=sharing
import pandas as pd

data= {

'email': [
'Free money!!!!' ,
'Hi Bob, how about a game of golf tomorrow?',
'Limited time offer, buy now!',
'Are you available for a meeting tomorrow?',
'Congratulations, you have won a lottery!!' ],

'label': ['spam', 'not spam', 'spam', 'not spam', 'spam']

}

df=pd.DataFrame(data)

print(df)
Output :
email label
0 Free money!!!! spam
1 Hi Bob, how about a game of golf tomorrow? not spam
2 Limited time offer, buy now! spam
3 Are you available for a meeting tomorrow? not spam
4 Congratulations, you have won a lottery!! spam
from sklearn.feature_extraction.text import CountVectorizer
from sklearn.model_selection import train_test_split
from sklearn.naive_bayes import MultinomialNB
from sklearn.metrics import accuracy_score, classification_report
#Convert text to lowercase
df['email']=df['email'].str.lower()
#Split the data into training and testing sets
X_train, X_test, y_train, y_test = train_test_split(df['email'], df['label'], test_size=0.2,
random_state=42)
#Vectorize the text data
vectorizer = CountVectorizer()
X_train_vec= vectorizer.fit_transform(X_train)
X_test_vec=vectorizer.transform(X_test)
#Train the model
model=MultinomialNB()
model.fit(X_train_vec, y_train)
#Model evaluation
y_pred=model.predict(X_test_vec)
accuracy = accuracy_score(y_test, y_pred)
report=classification_report(y_test, y_pred, zero_division=0)
print(f'Accuracy: {accuracy}')
print('Classification Report:')
print(report)
Output:
Accuracy: 0.0
Classification Report:
precision recall f1-score support
not spam 0.00 0.00 0.00 1.0
spam 0.00 0.00 0.00 0.0
accuracy 0.00 1.0
macro avg 0.00 0.00 0.00 1.0
weighted avg 0.00 0.00 0.00
1.0

Practical 2:
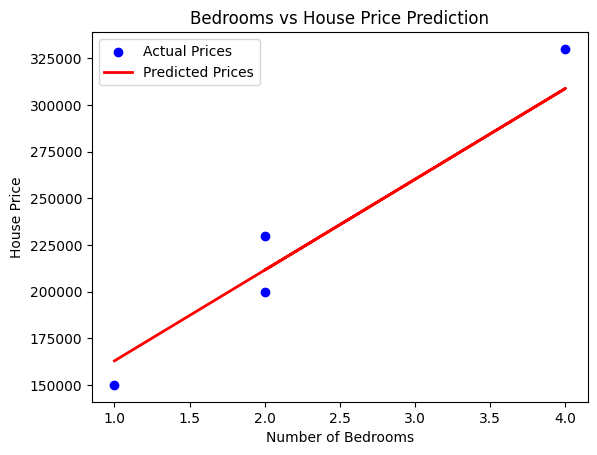
Develop and implement an algorithm to predict house prices based on the number of bedrooms in a dataset of real estate listings. Determine all the performance metrics.
Link: https://colab.research.google.com/drive/18kZ7kBhQPyasUtKlkd4vgvyRiHfAfrUs?usp=sharing
import pandas as pd
import numpy as np
from sklearn.model_selection import train_test_split
from sklearn.linear_model import LinearRegression
from sklearn.metrics import mean_absolute_error, mean_squared_error, r2_score
import matplotlib.pyplot as plt
rmse = np.sqrt(mse)
r2=r2_score(y_test, y_pred)
print(f"Mean Absolute Error (MAE): {mae}")
print(f"Mean Squared Error (MSE): {mse}")
print(f"Root Mean Squared Error (RMSE): {rmse}")
print(f"R-squared (R2): {r2}")
#Visualize the results
plt.scatter(X_test, y_test, color='blue', label='Actual Prices')
plt.plot(X_test, y_pred, color='red', linewidth=2, label='Predicted Prices')
plt.xlabel('Number of Bedrooms')
plt.ylabel('House Price')
plt.title('Bedrooms vs House Price Prediction')
plt.legend()
plt.show()
Output:
Mean Absolute Error (MAE): 16019.417475728143
Mean Squared Error (MSE): 272297695.35300165
Root Mean Squared Error (RMSE): 16501.445250431905
R-squared (R2): 0.9369498824074
Practical 3
Logistic and Linear Regression
Link: https://colab.research.google.com/drive/1YdnKP288CXjkV0-llrR1OEObBQCKCkih?usp=sharing
# Import necessary libraries
from sklearn.datasets import load_iris
from sklearn.model_selection import train_test_split
from sklearn.preprocessing import StandardScaler
from sklearn.linear_model import LogisticRegression
from sklearn.metrics import accuracy_score, precision_score, recall_score, f1_score, confusion_matrix, classification_report

# Load the Iris dataset
iris = load_iris()
X, y = iris.data, iris.target

# Split the data into training and testing sets
X_train, X_test, y_train, y_test = train_test_split(X, y, test_size=0.3, random_state=42)

# Standardize the features
scaler = StandardScaler()
X_train = scaler.fit_transform(X_train)
X_test = scaler.transform(X_test)

# Train a Logistic Regression model
model = LogisticRegression(max_iter=200)
model.fit(X_train, y_train)

# Make predictions on the test set
y_pred = model.predict(X_test)

# Calculate performance metrics
accuracy = accuracy_score(y_test, y_pred)
precision = precision_score(y_test, y_pred, average='weighted')
recall = recall_score(y_test, y_pred, average='weighted')
f1 = f1_score(y_test, y_pred, average='weighted')
conf_matrix = confusion_matrix(y_test, y_pred)
class_report = classification_report(y_test, y_pred, target_names=iris.target_names)

# Print the results
print(f"Accuracy: {accuracy:.2f}")
print(f"Precision: {precision:.2f}")
print(f"Recall: {recall:.2f}")
print(f"F1 Score: {f1:.2f}")
print("\nConfusion Matrix:")
print(conf_matrix)
print("\nClassification Report:")
print(class_report)
Output:
Accuracy: 1.00
Precision: 1.00
Recall: 1.00
F1 Score: 1.00 Confusion Matrix:
[[19 0 0]
[ 0 13 0]
[ 0 0 13]]
Classification Report:
precision recall f1-score support setosa
1.00 1.00 1.00 19 versicolor
1.00 1.00 1.00 13 virginica
1.00 1.00 1.00 13 accuracy
1.00 45
macro avg
1.00 1.00 1.00 45
weighted avg
1.00 1.00 1.00 45
Logistics regression using Sklearn
import numpy as np
from sklearn.model_selection import train_test_split
from sklearn.linear_model import LinearRegression, LogisticRegression
from sklearn.metrics import accuracy_score, confusion_matrix, classification_report
from sklearn.datasets import load_breast_cancer
data = load_breast_cancer()
X = data.data
y = data.target
X_train, X_test, y_train, y_test = train_test_split(X, y, test_size=0.2, random_state=42)
linear_model = LinearRegression()
linear_model.fit(X_train, y_train)
y_pred_linear = linear_model.predict(X_test)
y_pred_linear_class = np.where(y_pred_linear >= 0.5, 1, 0)
# Evaluate Linear Regression model
print("Linear Regression for Classification:")
print(f"Accuracy: {accuracy_score(y_test, y_pred_linear_class)}")
print(f"Confusion Matrix:\n{confusion_matrix(y_test, y_pred_linear_class)}")
print(f"Classification Report:\n{classification_report(y_test, y_pred_linear_class)}\n")
# 2. Logistic Regression for Classification
# Initialize the Logistic Regression model
logistic_model = LogisticRegression(max_iter=10000)  # Increase max_iter if convergence warnings occur
logistic_model.fit(X_train, y_train)
# Predict using Logistic Regression
y_pred_logistic = logistic_model.predict(X_test)
# Evaluate Logistic Regression model
print("Logistic Regression for Classification:")
print(f"Accuracy: {accuracy_score(y_test, y_pred_logistic)}")
print(f"Confusion Matrix:\n{confusion_matrix(y_test, y_pred_logistic)}")
print(f"Classification Report:\n{classification_report(y_test, y_pred_logistic)}")
Output:
Linear Regression for Classification:
Accuracy: 0.956140350877193
Confusion Matrix:
[[39 4]
[ 1 70]]
Classification Report:
precision recall f1-score support
0 0.97 0.91 0.94 43
1 0.95 0.99 0.97 71
accuracy 0.96 114
macro avg 0.96 0.95 0.95 114
weighted avg 0.96 0.96 0.96 114
Logistic Regression for Classification:
Accuracy: 0.956140350877193
Confusion Matrix:
[[39 4]
[ 1 70]]
Classification Report:
precision recall f1-score support
0 0.97 0.91 0.94 43
1 0.95 0.99 0.97 71
accuracy 0.96 114
macro avg 0.96 0.95 0.95 114
weighted avg 0.96 0.96
Practical 3
Use the Iris dataset to classify iris flowers into three species. Determine all the performance metrics.
Link: https://colab.research.google.com/drive/1ad3IouBBwFtiD_PxYVpzE_fNKmA3eCEU?usp=sharing
import pandas as pd
import numpy as np
import matplotlib.pyplot as plt
import seaborn as sns
from sklearn.datasets import load_iris
from sklearn.model_selection import train_test_split
from sklearn.linear_model import LogisticRegression
from sklearn.metrics import classification_report, confusion_matrix, accuracy_score
iris = load_iris()
X = iris.data  # Features: sepal length, sepal width, petal length, petal width
y = iris.target  # Target: species (setosa, versicolor, virginica)
X_train, X_test, y_train, y_test = train_test_split(X, y, test_size=0.2, random_state=42)
model = LogisticRegression(max_iter=200)
model.fit(X_train, y_train)
y_pred = model.predict(X_test)
# Performance metrics
accuracy = accuracy_score(y_test, y_pred)
classification_rep = classification_report(y_test, y_pred, target_names=iris.target_names)
conf_matrix = confusion_matrix(y_test, y_pred)
print(f"Accuracy: {accuracy}")
print(f"Classification Report:\n{classification_rep}")
print(f"Confusion Matrix:\n{conf_matrix}")
Output:

Practical 4:
Develop and implement an algorithm to classify fruits based on color and size. Determine all the performance metrics.
Link: https://colab.research.google.com/drive/1PJ7nz8LXGbKxFNbxlLzlda5s6h_1u7hu?usp=sharing
import pandas as pd
from sklearn.model_selection import train_test_split
from sklearn.ensemble import RandomForestClassifier
from sklearn.metrics import classification_report, accuracy_score
from sklearn.preprocessing import LabelEncoder
data = {
    'color': ['Red', 'Yellow', 'Green', 'Red', 'Yellow', 'Green', 'Red', 'Green', 'Yellow', 'Red'],
    'size': ['Large', 'Small', 'Medium', 'Medium', 'Large', 'Small', 'Small', 'Large', 'Medium', 'Large'],
    'fruit': ['Apple', 'Banana', 'Lime', 'Apple', 'Banana', 'Lime', 'Apple', 'Lime', 'Banana', 'Apple']
}
df = pd.DataFrame(data)
label_encoder = LabelEncoder()
df['color'] = label_encoder.fit_transform(df['color'])
df['size'] = label_encoder.fit_transform(df['size'])
df['fruit'] = label_encoder.fit_transform(df['fruit'])
X = df[['color', 'size']]
y = df['fruit']
X_train, X_test, y_train, y_test = train_test_split(X, y, test_size=0.3, random_state=42)
model = RandomForestClassifier(random_state=42)
model.fit(X_train, y_train)
y_pred = model.predict(X_test)
print("Accuracy:", accuracy_score(y_test, y_pred))
print("Classification Report:\n", classification_report(y_test, y_pred))
OUTPUT:

Practical 5:
Develop and implement an SVM for the classification of the linearly separable and inseparable datasets. Determine all the performance metrics.
Link: https://colab.research.google.com/drive/1d1bEur33_h8p6eRRNYS_b9Ner2_2DDjY?usp=sharing
pip install scikit-learn
# Step 1: Import necessary libraries
import pandas as pd
import numpy as np
from sklearn.model_selection import train_test_split
from sklearn.neighbors import KNeighborsClassifier
from sklearn.metrics import accuracy_score, classification_report, confusion_matrix
from sklearn.model_selection import train_test_split
from sklearn.svm import SVC
from sklearn.datasets import load_iris
from sklearn.metrics import classification_report, accuracy_score
# Load the Iris dataset
data = load_iris()
X = data.data  # Features
y = data.target  # Labels
# Split the dataset into 80% training and 20% test data
X_train, X_test, y_train, y_test = train_test_split(X, y, test_size=0.2, random_state=42)
# Split the dataset into 80% training and 20% test data
X_train, X_test, y_train, y_test = train_test_split(X, y, test_size=0.2, random_state=42)
# Create an SVM classifier with an RBF (Radial Basis Function) kernel
svm = SVC(kernel='rbf', C=1.0, gamma='scale')  # You can tune these parameters
# Train the model
svm.fit(X_train, y_train)
# Make predictions on the test data
y_pred = svm.predict(X_test)
# Evaluate the model using accuracy and classification report
print(f"Accuracy: {accuracy_score(y_test, y_pred)}")
print(classification_report(y_test, y_pred))
# Evaluate the model using accuracy and classification report
print(f"Accuracy: {accuracy_score(y_test, y_pred)}")
print(classification_report(y_test, y_pred))
OUTPUT:

Practical 6
Implement the K-Means clustering algorithm. Determine all the performance metrics.
Link: https://colab.research.google.com/drive/1AegixfkYWb1BxOiwP5X7-xy2p1kV9I9j?usp=sharing
import numpy as np
import matplotlib.pyplot as plt
from sklearn.datasets import load_iris
from sklearn.cluster import KMeans
from sklearn.metrics import silhouette_score
X, y = load_iris(return_X_y=True)
inertias = []
K_range = range(1, 11)
for k in K_range:
    # Indent the lines within the for loop with 4 spaces
    kmeans = KMeans(n_clusters=k, random_state=42)
    kmeans.fit(X)
    inertias.append(kmeans.inertia_)
plt.figure(figsize=(8, 5))
plt.plot(K_range, inertias, marker='o')
plt.title('Elbow Method For Optimal k')
plt.xlabel('Number of clusters (k)')
plt.ylabel('Inertia')

plt.grid()
plt.show()
optimal_k = 3
kmeans = KMeans(n_clusters=optimal_k, random_state=42)
kmeans.fit(X)
centers = kmeans.cluster_centers_
labels = kmeans.labels_
plt.figure(figsize=(8, 5))

plt.scatter(X[:, 0], X[:, 1], c=labels, cmap='viridis', marker='o')
plt.scatter(centers[:, 0], centers[:, 1], c='red', marker='X', s=200)
plt.title('K-Means Clustering')
plt.xlabel('Feature 1')
plt.ylabel('Feature 2')
plt.grid()
plt.show()
print(f'Inertia: {kmeans.inertia_}')
silhouette_avg = silhouette_score(X, labels)
print(f'Silhouette Score: {silhouette_avg}')

PRACTICAL 7
Implement the Naive Bayes algorithm. Determine all the performance metrics.
Link: https://colab.research.google.com/drive/15Scjd_DPT1VTAVVup91Q_o_wghQRSDHX?usp=sharing
import numpy as np
import pandas as pd
import matplotlib.pyplot as plt
from sklearn.datasets import load_iris
from sklearn.model_selection import train_test_split
from sklearn.naive_bayes import GaussianNB
from sklearn.metrics import confusion_matrix, accuracy_score, classification_report

X, y = load_iris(return_X_y=True)
X_train, X_test, y_train, y_test = train_test_split(X, y, test_size=0.3, random_state=42)
model = GaussianNB()
model.fit(X_train, y_train)
y_pred = model.predict(X_test)
conf_matrix = confusion_matrix(y_test, y_pred)
print("Confusion Matrix:\n", conf_matrix)
accuracy = accuracy_score(y_test, y_pred)
print(f'Accuracy: {accuracy:.2f}')
class_report = classification_report(y_test, y_pred)
print("Classification Report:\n", class_report)

plt.figure(figsize=(8, 6))
plt.imshow(conf_matrix, interpolation='nearest', cmap=plt.cm.Blues)
plt.title('Confusion Matrix')
plt.colorbar()
tick_marks = np.arange(len(np.unique(y)))
plt.xticks(tick_marks, np.unique(y))
plt.yticks(tick_marks, np.unique(y))
plt.ylabel('True label')
plt.xlabel('Predicted label')
plt.tight_layout()
plt.show()

Practical 8:
Implement the decision tree algorithm for a suitable problem. Determine all the performance metrics.
Link: https://colab.research.google.com/drive/1AStU5IaxuGVmPwYNZiXtErbpd_MKvwcM?usp=sharing
// Classification Matrix

import numpy as np
from sklearn.model_selection import train_test_split
from sklearn.neighbors import KNeighborsClassifier # KNeighborsClassifier is already imported here
# The following line was incorrectly indented. Removed the leading space
#import KNeighborsClassifier #This line was the problem, remove it
from sklearn.metrics import accuracy_score, confusion_matrix, classification_report, roc_auc_score
from sklearn.datasets import make_classification
X, y = make_classification(n_samples=1000, n_features=20, n_classes=2, random_state=42)
X_train, X_test, y_train, y_test = train_test_split(X, y, test_size=0.3, random_state=42)
knn_classifier = KNeighborsClassifier(n_neighbors=5)
knn_classifier.fit(X_train, y_train)
y_pred_class = knn_classifier.predict(X_test)
accuracy = accuracy_score(y_test, y_pred_class)
cm = confusion_matrix(y_test, y_pred_class)
report = classification_report(y_test, y_pred_class)
roc_auc = roc_auc_score(y_test, knn_classifier.predict_proba(X_test)[:, 1])
print(f"Classification Accuracy: {accuracy:.4f}")
print(f"Confusion Matrix:\n{cm}")
print(f"Classification Report:\n{report}")
print(f"ROC AUC Score: {roc_auc:.4f}")

// regression Matrix
from sklearn.neighbors import KNeighborsRegressor
from sklearn.metrics import mean_squared_error, r2_score
from sklearn.datasets import make_regression
X_reg, y_reg = make_regression(n_samples=1000, n_features=20, noise=0.1, random_state=42)
X_train_reg, X_test_reg, y_train_reg, y_test_reg = train_test_split(X_reg, y_reg, test_size=0.3, random_state=42)
knn_regressor = KNeighborsRegressor(n_neighbors=5)
knn_regressor.fit(X_train_reg, y_train_reg)
y_pred_reg = knn_regressor.predict(X_test_reg)
mse = mean_squared_error(y_test_reg, y_pred_reg)
r2 = r2_score(y_test_reg, y_pred_reg)
print(f"Regression Mean Squared Error (MSE): {mse:.4f}")
print(f"Regression R-squared (R²): {r2:.4f}")

Practical 9: Implement the K-Nearest neighbor algorithm for classification and regression. Determine all the performance metrics.
Link: https://colab.research.google.com/drive/1q7QM0XWFW8BqdPvmt4WwJjyhSaeXqaiq?usp=sharing
import math

def classifyAPoint(points,p,k=3):
    '''
     This function finds the classification of p using
     k nearest neighbor algorithm. It assumes only two
     groups and returns 0 if p belongs to group 0, else
      1 (belongs to group 1).

      Parameters -
          points: Dictionary of training points having two keys - 0 and 1
                   Each key have a list of training data points belong to that

          p : A tuple, test data point of the form (x,y)

          k : number of nearest neighbour to consider, default is 3
    '''

    distance=[]
    for group in points:
        for feature in points[group]:

            #calculate the euclidean distance of p from training points
            euclidean_distance = math.sqrt((feature[0]-p[0])**2 +(feature[1]-p[1])**2)

            # Add a tuple of form (distance,group) in the distance list
            distance.append((euclidean_distance,group))

    # sort the distance list in ascending order
    # and select first k distances
    distance = sorted(distance)[:k]

    freq1 = 0 #frequency of group 0
    freq2 = 0 #frequency og group 1

    for d in distance:
        if d[1] == 0:
            freq1 += 1
        elif d[1] == 1:
            freq2 += 1

    return 0 if freq1>freq2 else 1

# driver function
def main():

    # Dictionary of training points having two keys - 0 and 1
    # key 0 have points belong to class 0
    # key 1 have points belong to class 1

    points = {0:[(1,12),(2,5),(3,6),(3,10),(3.5,8),(2,11),(2,9),(1,7)],
              1:[(5,3),(3,2),(1.5,9),(7,2),(6,1),(3.8,1),(5.6,4),(4,2),(2,5)]}

    # testing point p(x,y)
    p = (2.5,7)

    # Number of neighbours
    k = 3

    print("The value classified to unknown point is: {}".\
          format(classifyAPoint(points,p,k)))

if __name__ == '__main__':
    main()
OUTPUT:

Subscribe to my newsletter
Read articles from Developer For College Student directly inside your inbox. Subscribe to the newsletter, and don't miss out.
Written by