The Power of Logging: Building a Seamless Pipeline with Fluentd, Elasticsearch, and Kibana
 Shubham Taware
In today's data-driven world, effective logging is essential for monitoring applications, troubleshooting issues, and gaining insights into system performance. Logging refers to the practice of recording events, errors, and other significant activities within software systems. These logs serve as a vital resource for developers and system administrators, helping them understand application behaviour, identify bottlenecks, and ensure security compliance.
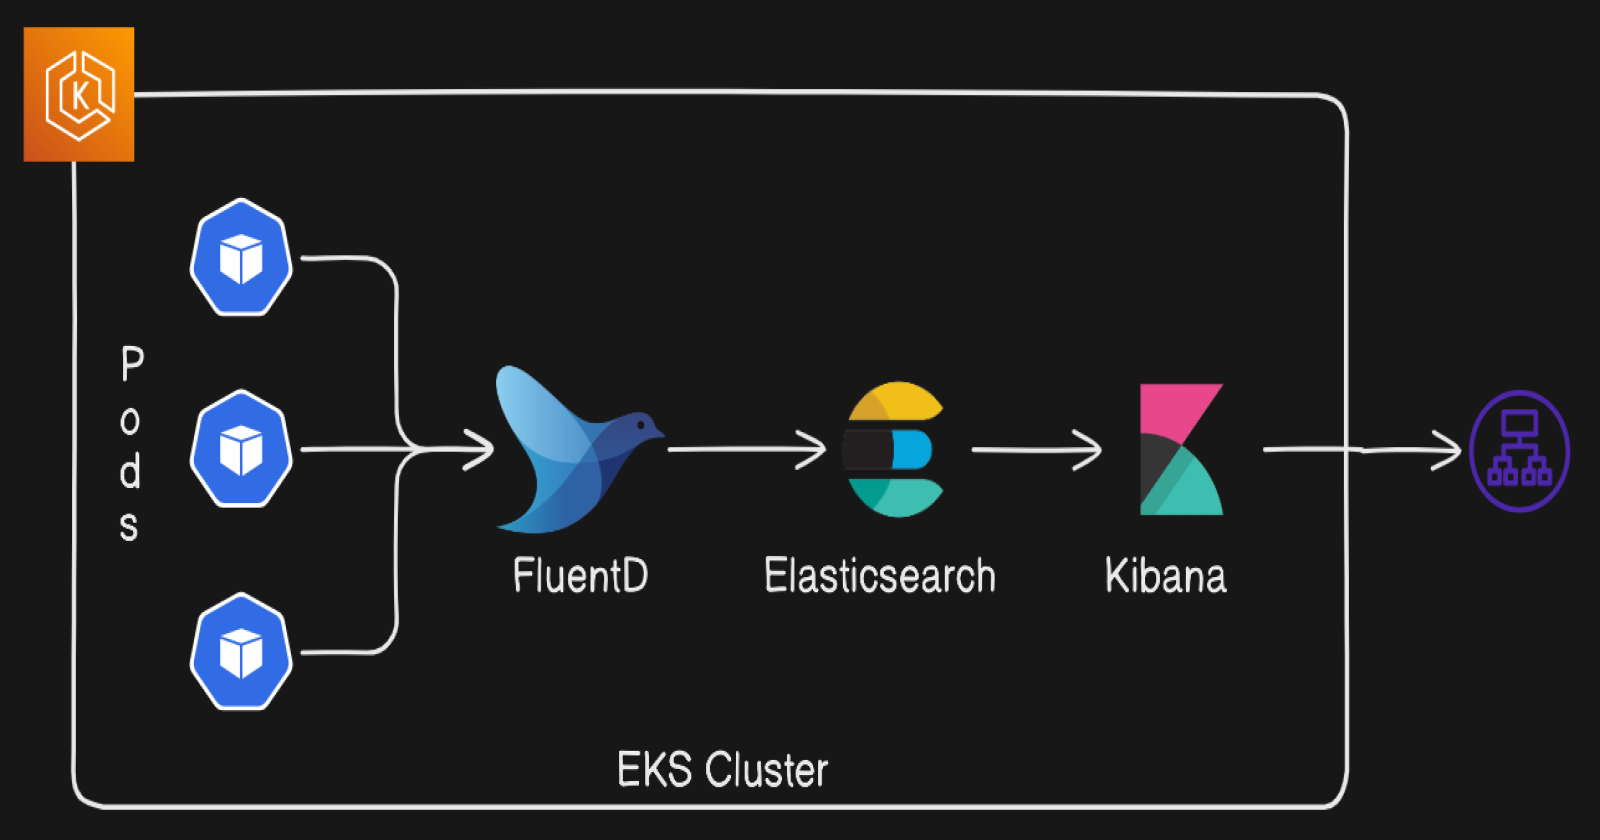
As the volume of data generated by applications continues to grow, traditional logging methods can quickly become unwieldy. This is where powerful tools like Fluentd, Elasticsearch, and Kibana come into play. Together, they form a robust logging stack that streamlines the process of collecting, storing, and visualizing log data.
In this blog, we will explore how these three components work together to create a comprehensive logging solution. We'll dive into the setup process, configuration, and the advantages of using this powerful trio for effective log management. Join me as we unravel the intricacies of logging with Fluentd, Elasticsearch, and Kibana, and discover how they can enhance your application's performance and reliability.
Fluentd
Fluentd is a tool that collects logs from different sources, like servers or applications. It helps to organize and send these logs to other places for storage or analysis.
Elasticsearch
Elasticsearch is a powerful search engine that stores large amounts of data. It allows you to quickly search through that data and find specific information, making it great for analyzing logs.
Kibana
Kibana is a visualization tool that works with Elasticsearch. It helps you create charts and dashboards to see and understand your data better, allowing you to spot trends and insights from your logs.
Prerequisites:
EKS/Kubernetes Cluster Running.
Bastion Host for accessing cluster.
Clone manifests using github-url: https://github.com/shubzz-t/EFK-Elastisearch-FluentD-Kibana.git
Demo app or your application pod running whose logs we want to capture. In my case I am running counter pod.
Step 1 : Setting Up Fluentd as a DaemonSet
The first step in our logging pipeline is to run Fluentd, which will collect logs from all running pods in your Kubernetes cluster. To achieve this, we’ll configure Fluentd to run as a DaemonSet. This means that Fluentd will automatically deploy an instance on each node in the cluster, ensuring that it collects logs from every pod running on those nodes. Also we have implemented RBAC for FluentD.
Firstly create namespace for the fluentD:
kubectl create namespace fluentdCreate Service Account, Role and Role binding using file:
kubectl apply -f fluentd-rbac.ymlNext we will have configuration settings in a ConfigMap and apply it using:
kubectl apply -f fluentd-configmap.yamlFinally, deploy the Fluentd DaemonSet, making sure it uses the Service Account and mounts the ConfigMap.
kubectl apply -f fluentd.yaml
Step 2: Setting up Elasticsearch
To store and manage the logs collected by Fluentd, we’ll deploy Elasticsearch as a StatefulSet in Kubernetes. StatefulSets are ideal for managing stateful applications like Elasticsearch because they provide stable network identities and persistent storage.
Deploy Elasticsearch:
kubectl apply -f elasticsearch.ymlOur Elasticsearch StatefulSet manifest indeed doesn't include persistent storage volumes, which means that Elasticsearch will store its data in ephemeral storage.
You can use Persistent Volumes.
Next we will be creating secret for the Elasticsearch in default namespace where we will be having Kibana and in fluentd namespace for fluentd to authenticate so that it can send logs to Elasticsearch.
  #For default namespace
  kubectl create secret generic elasticsearch-credentials --from-literal=password='kibana'

  #For fluentd namespace
  kubectl create secret generic elasticsearch-credentials --from-literal=username='elastic' --from-literal=password='kibana' --namespace=fluentd
Here username = elastic is by default username for elasticsearch and password here is kibana.
Step 3: Setting up Kibana:
To visualise and analyse the logs stored in Elasticsearch, we’ll deploy Kibana in your Kubernetes cluster. Kibana serves as the frontend for Elasticsearch, providing a user-friendly interface to create visualisations, dashboards, and perform searches on your log data.
Set up Kibana as a deployment or StatefulSet (depending on your needs).
kubectl apply -f kibana.ymlWe have configured the service for kibana as type LoadBalancer so that we can access the kibana using the external ip.
Accessing Kibana, check the status of the service to get the external IP address:
kubectl get servicesLook for the kibana service in the output. It may take a few moments for the external IP address to be provisioned. Once it's ready, you can access Kibana using:
http://<external-ip>:5601Default namespace:

fluentd namespace:

Configure an Index Pattern in Kibana:
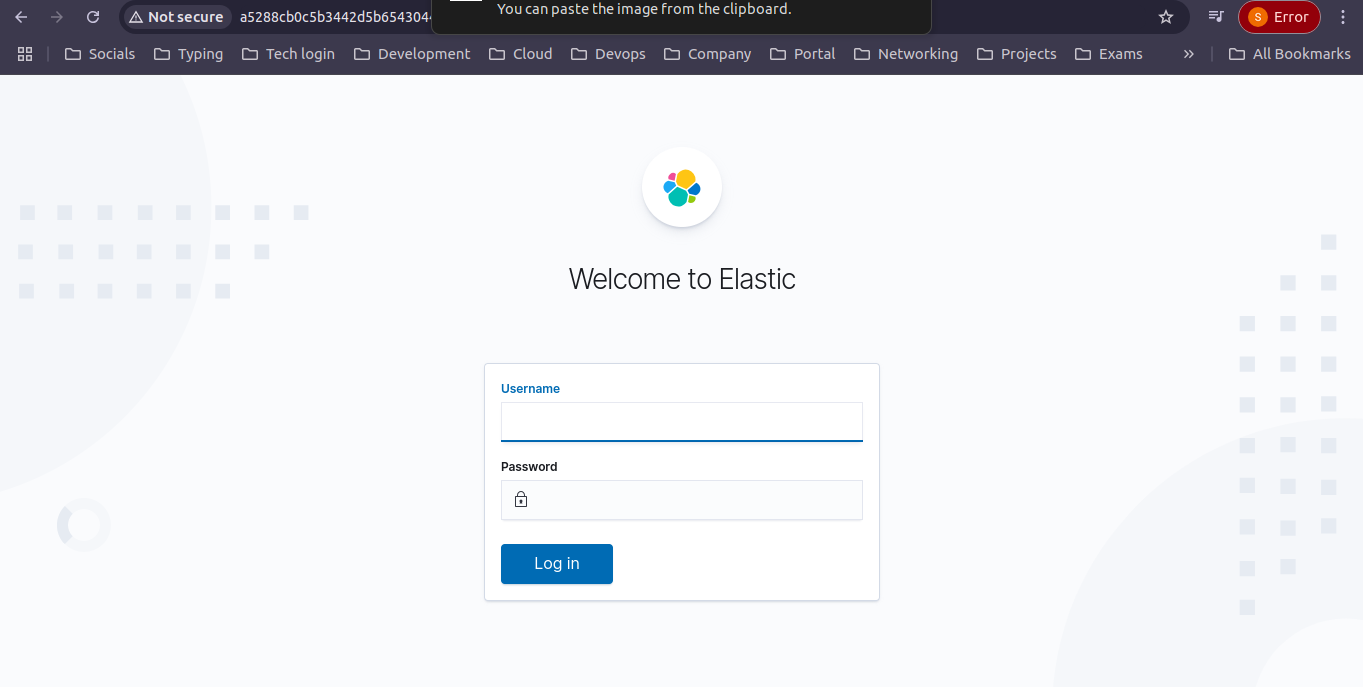
Access Kibana: Go to
http://<external-ip>:5601.Log In: Use the
elasticusername andkibanapassword (if haven’t changed).
Create Index Pattern:
Click "Management" > "Index Patterns".Click "Create index pattern".
Enter index name (e.g.,
logs-*) and click "Next step".Select timestamp field (if needed) and click "Create index pattern".
Verify:
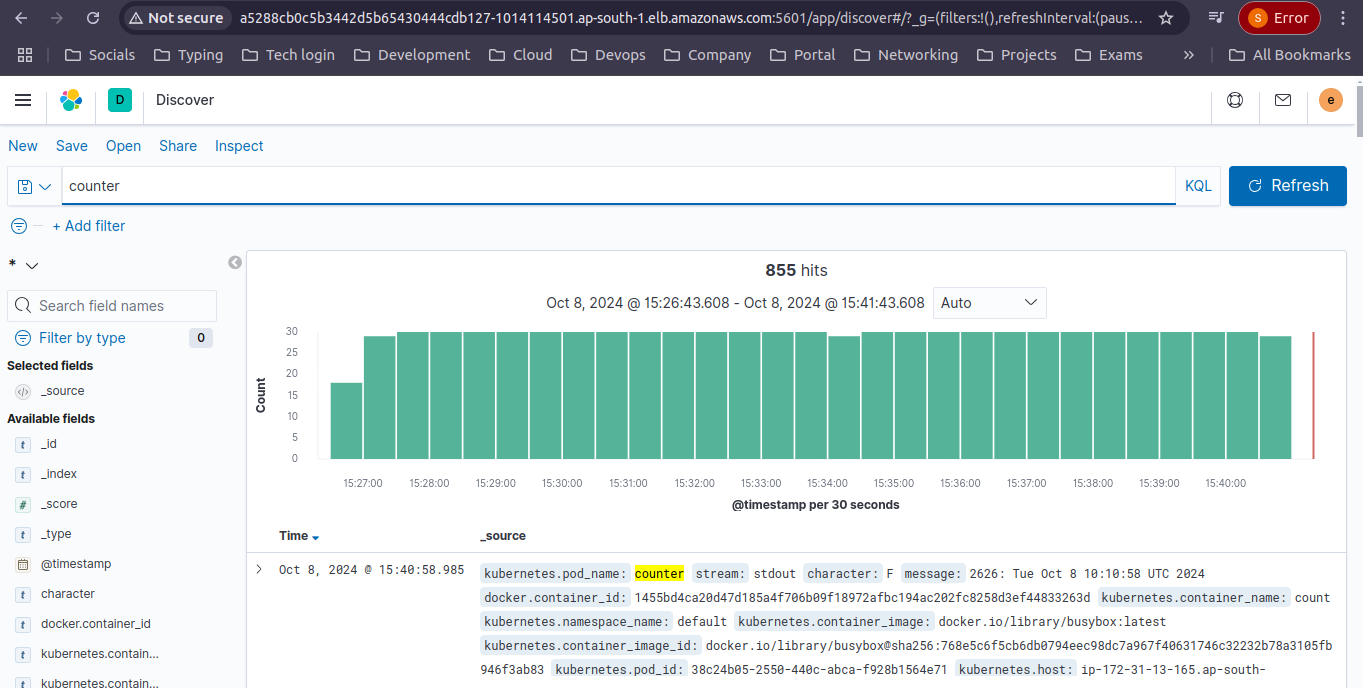
Go to "Discover" and select your index pattern to view logs.

Done with setting up the EFK (Elasticsearch, FluentD, Kibana).
Conclusion
In this blog, we set up a robust logging solution using Fluentd, Elasticsearch, and Kibana in a Kubernetes environment. We configured Fluentd to collect logs, Elasticsearch to store them persistently, and Kibana to visualize the data.
This stack enhances monitoring, troubleshooting, and performance analysis, providing valuable insights for better decision-making. With this logging infrastructure in place, you can effectively manage and analyze your logs, leading to improved application performance.
For more insightful content on technology, AWS, and DevOps, make sure to follow me for the latest updates and tips. If you have any questions or need further assistance, feel free to reach out—I’m here to help!
Streamline, Deploy, Succeed-- Devops Made Simple!☺️
Subscribe to my newsletter
Read articles from Shubham Taware directly inside your inbox. Subscribe to the newsletter, and don't miss out.
Written by

Shubham Taware
Shubham Taware
👨💻 Hi, I'm Shubham Taware, a Systems Engineer at Cognizant with a passion for all things DevOps. While my current role involves managing systems, I'm on an exciting journey to transition into a career in DevOps by honing my skills and expertise in this dynamic field. 🚀 I believe in the power of DevOps to streamline software development and operations, making the deployment process faster, more reliable, and efficient. Through my blog, I'm here to share my hands-on experiences, insights, and best practices in the DevOps realm as I work towards my career transition. 🔧 In my day-to-day work, I'm actively involved in implementing DevOps solutions, tackling real-world challenges, and automating processes to enhance software delivery. Whether it's CI/CD pipelines, containerization, infrastructure as code, or any other DevOps topic, I'm here to break it down, step by step. 📚 As a student, I'm continuously learning and experimenting, and I'm excited to document my progress and share the valuable lessons I gather along the way. I hope to inspire others who, like me, are looking to transition into the DevOps field and build a successful career in this exciting domain. 🌟 Join me on this journey as we explore the world of DevOps, one blog post at a time. Together, we can build a stronger foundation for successful software delivery and propel our careers forward in the exciting world of DevOps. 📧 If you have any questions, feedback, or topics you'd like me to cover, feel free to get in touch at shubhamtaware15@gmail.com. Let's learn, grow, and DevOps together!