Display Your Package Download Rate on GitHub
 Sadra Yahyapour
In this quick tutorial, I’ll show you a GitHub action that lets you add a small, cool-looking chart badge that shows your Python packages' download rate over the past weeks. This method is completely free and open-source.
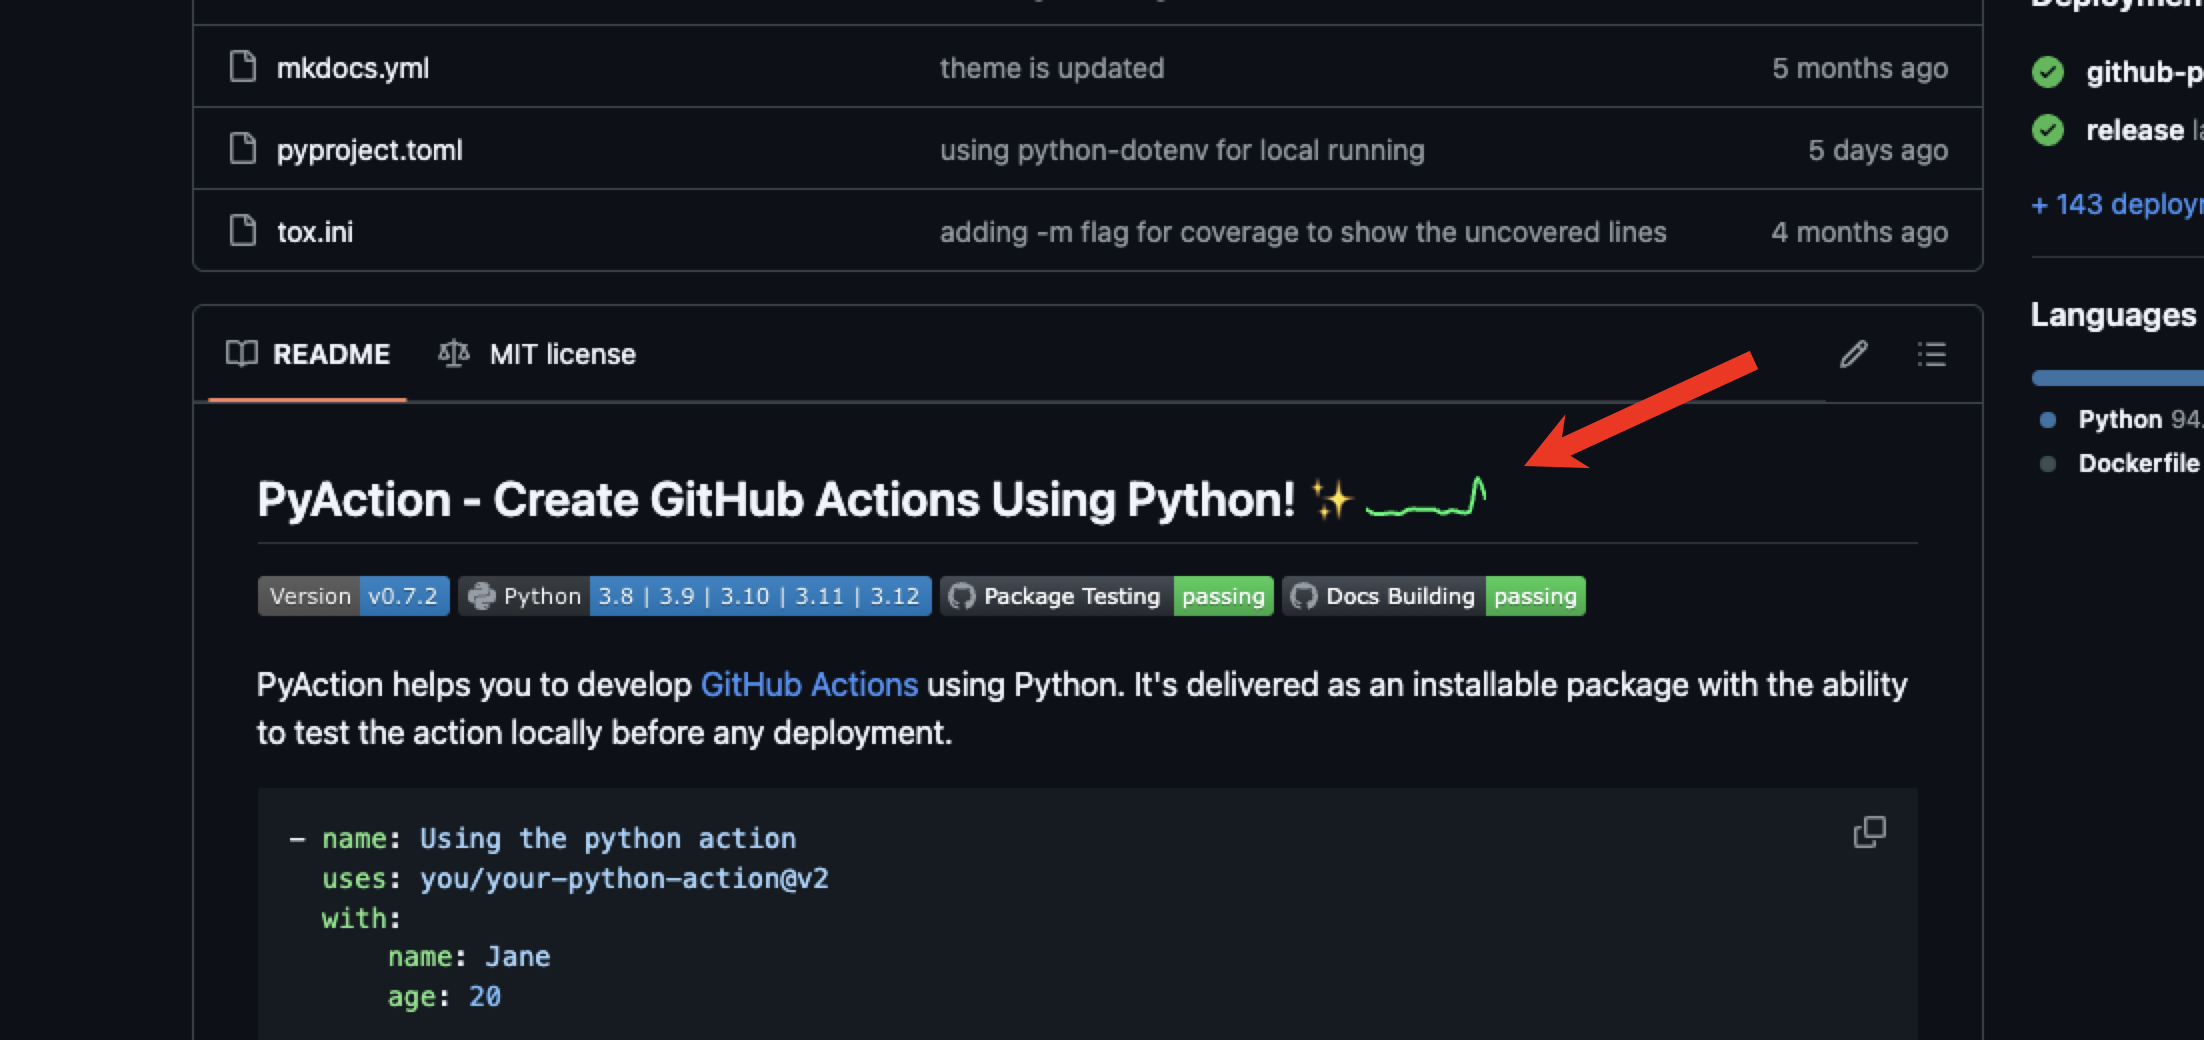
Here's a quick preview of what we'll have by the end of this tutorial. Take a look at this example below.

In the example above, PyAction is a Python library (which I maintain and used to create this project), and I used the action mentioned earlier to create that green graph badge that displays the PyPI download rate of the package over the past 15 days.
Follow the following steps to create and show this badge on your own repositories.
1. Create a new CI pipeline
To use this action, you need a dedicated CI pipeline. To do this, create a .yml or .yaml file in the .github/workflows/ directory of your repository. (If this directory doesn’t exist, create it)
I’m going to name it pypi_chart.yml so its full path would be .github/workflows/pypi_chart.yml in my repository.
2. Paste this action usage in the yml file
Paste the following pipeline usage in the yml file of yours.
name: Update the PyPI chart badge

on:
  schedule:
    - cron: "0 0 1 * *"  # <= runs every month (cron pattern)
  workflow_dispatch:

jobs:
  update-chart-badge:
    name: Updating the pypi chart badge
    runs-on: ubuntu-latest

    steps:
      - name: Checkout
        uses: actions/checkout@v4

      - name: Updating the badge
        uses: lnxpy/pypi-chart-badge@v1
        with:
          package_name: <PACKAGE-NAME> # <= here goes your package name

      - uses: EndBug/add-and-commit@v9
        with:
          default_author: github_actions
          message: 'chart badge updated'
This pipeline will run every month to create or update the badge. You can use any cron pattern and replace it with the one on line 5.
Since this pipeline includes workflow_dispatch:, you can run it manually at any time. We will first run it manually to generate the badge, and then let it run automatically for future executions.
Don't forget to update the package_name parameter on line 20 with the name of your Python package.
On the last line, you can set any commit message you want when the badge is updated in your repository.
3. Giving access to the workflow
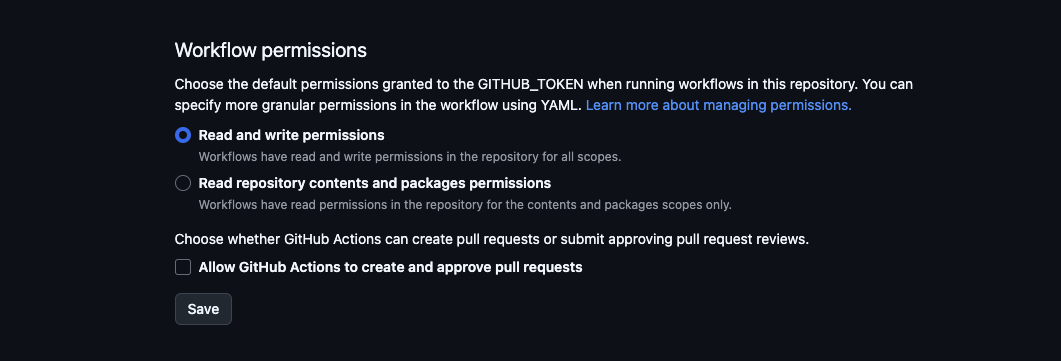
Now, you need to grant write access to the workflow so it can push the updated badge to your repository.
Simply on the repository page, navigate to “Settings”. From the side panel, choose “Actions” > “General”.
Scroll all the way down until you find “Workflow permissions”. Select “Read and write permissions" and hit save.

Now, your workflow has writing access to your repository.
4. Testing
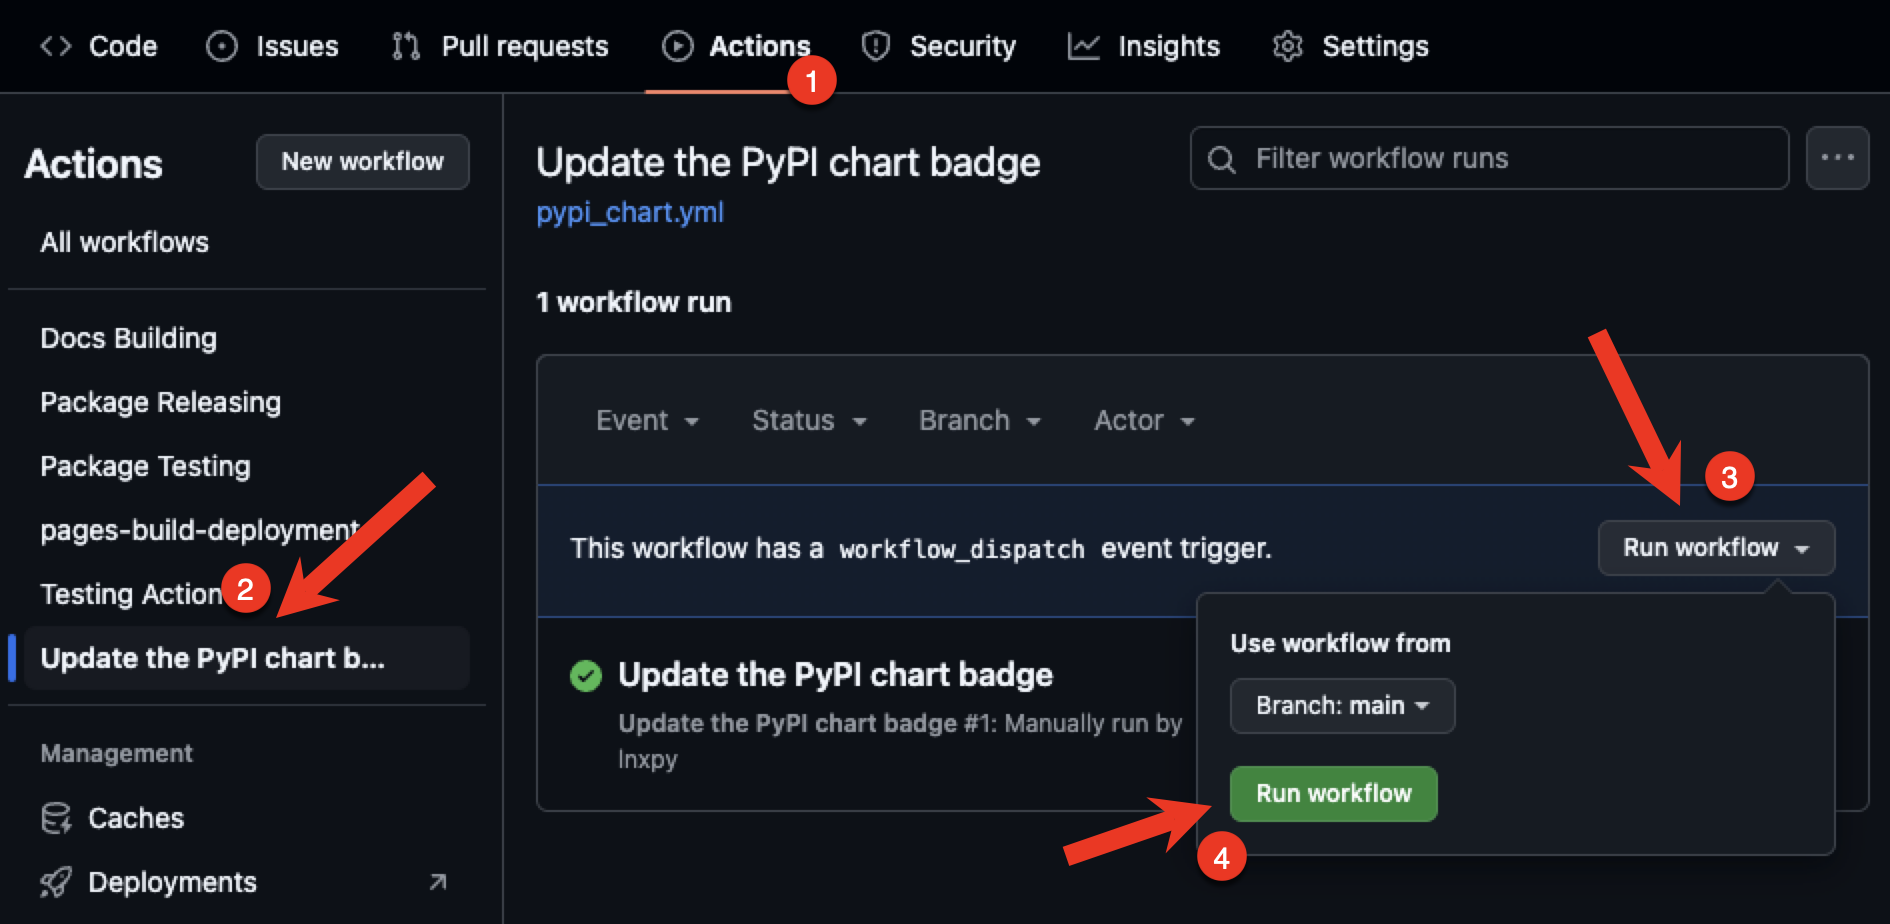
Go to the “Actions” panel of your repository. From the side panel, choose the “Update the PyPI chart badge” workflow and run it.

After a few seconds, you’ll see the .pypi_chart/badge.svg is added to your repository. Now if you edit your README.md file and add that SVG file, you’ll see the badge showing up perfectly.
# Package 

Options
There are a bunch of options that you can use to customize the badge. Copy and paste any of the following options into your pipeline.
      - name: Updating the badge
        uses: lnxpy/pypi-chart-badge@v1
        with:
          package_name: <PACKAGE-NAME>

          # badge width size in px (default: 60)
          badge_width: 200

          # badge height size in px (default: 20)
          badge_height: 65

          # plot color (CSS color or HEX)
          badge_color: '#ff05e6'

          # days limit (default: 15)
          days_limit: 25

          # output path (default: .pypi_chart/)
          output_path: media/

          # output file name (default: badge.svg)
          file_name: badge.png
Links
Action repository: https://github.com/lnxpy/pypi-chart-badge
Action on GitHub marketplace: https://github.com/marketplace/actions/pypi-chart-badge
PyAction repository: https://github.com/lnxpy/pyaction
PyAction docs: https://pyaction.imsadra.me
Subscribe to my newsletter
Read articles from Sadra Yahyapour directly inside your inbox. Subscribe to the newsletter, and don't miss out.
Written by

Sadra Yahyapour
Sadra Yahyapour
A passionate software developer who enjoys sharing his thoughts with others and learning from them vise versa!