Day 76 Build a Grafana dashboard
 Pooja Bhavani
2 min read

Grafana Dashboard
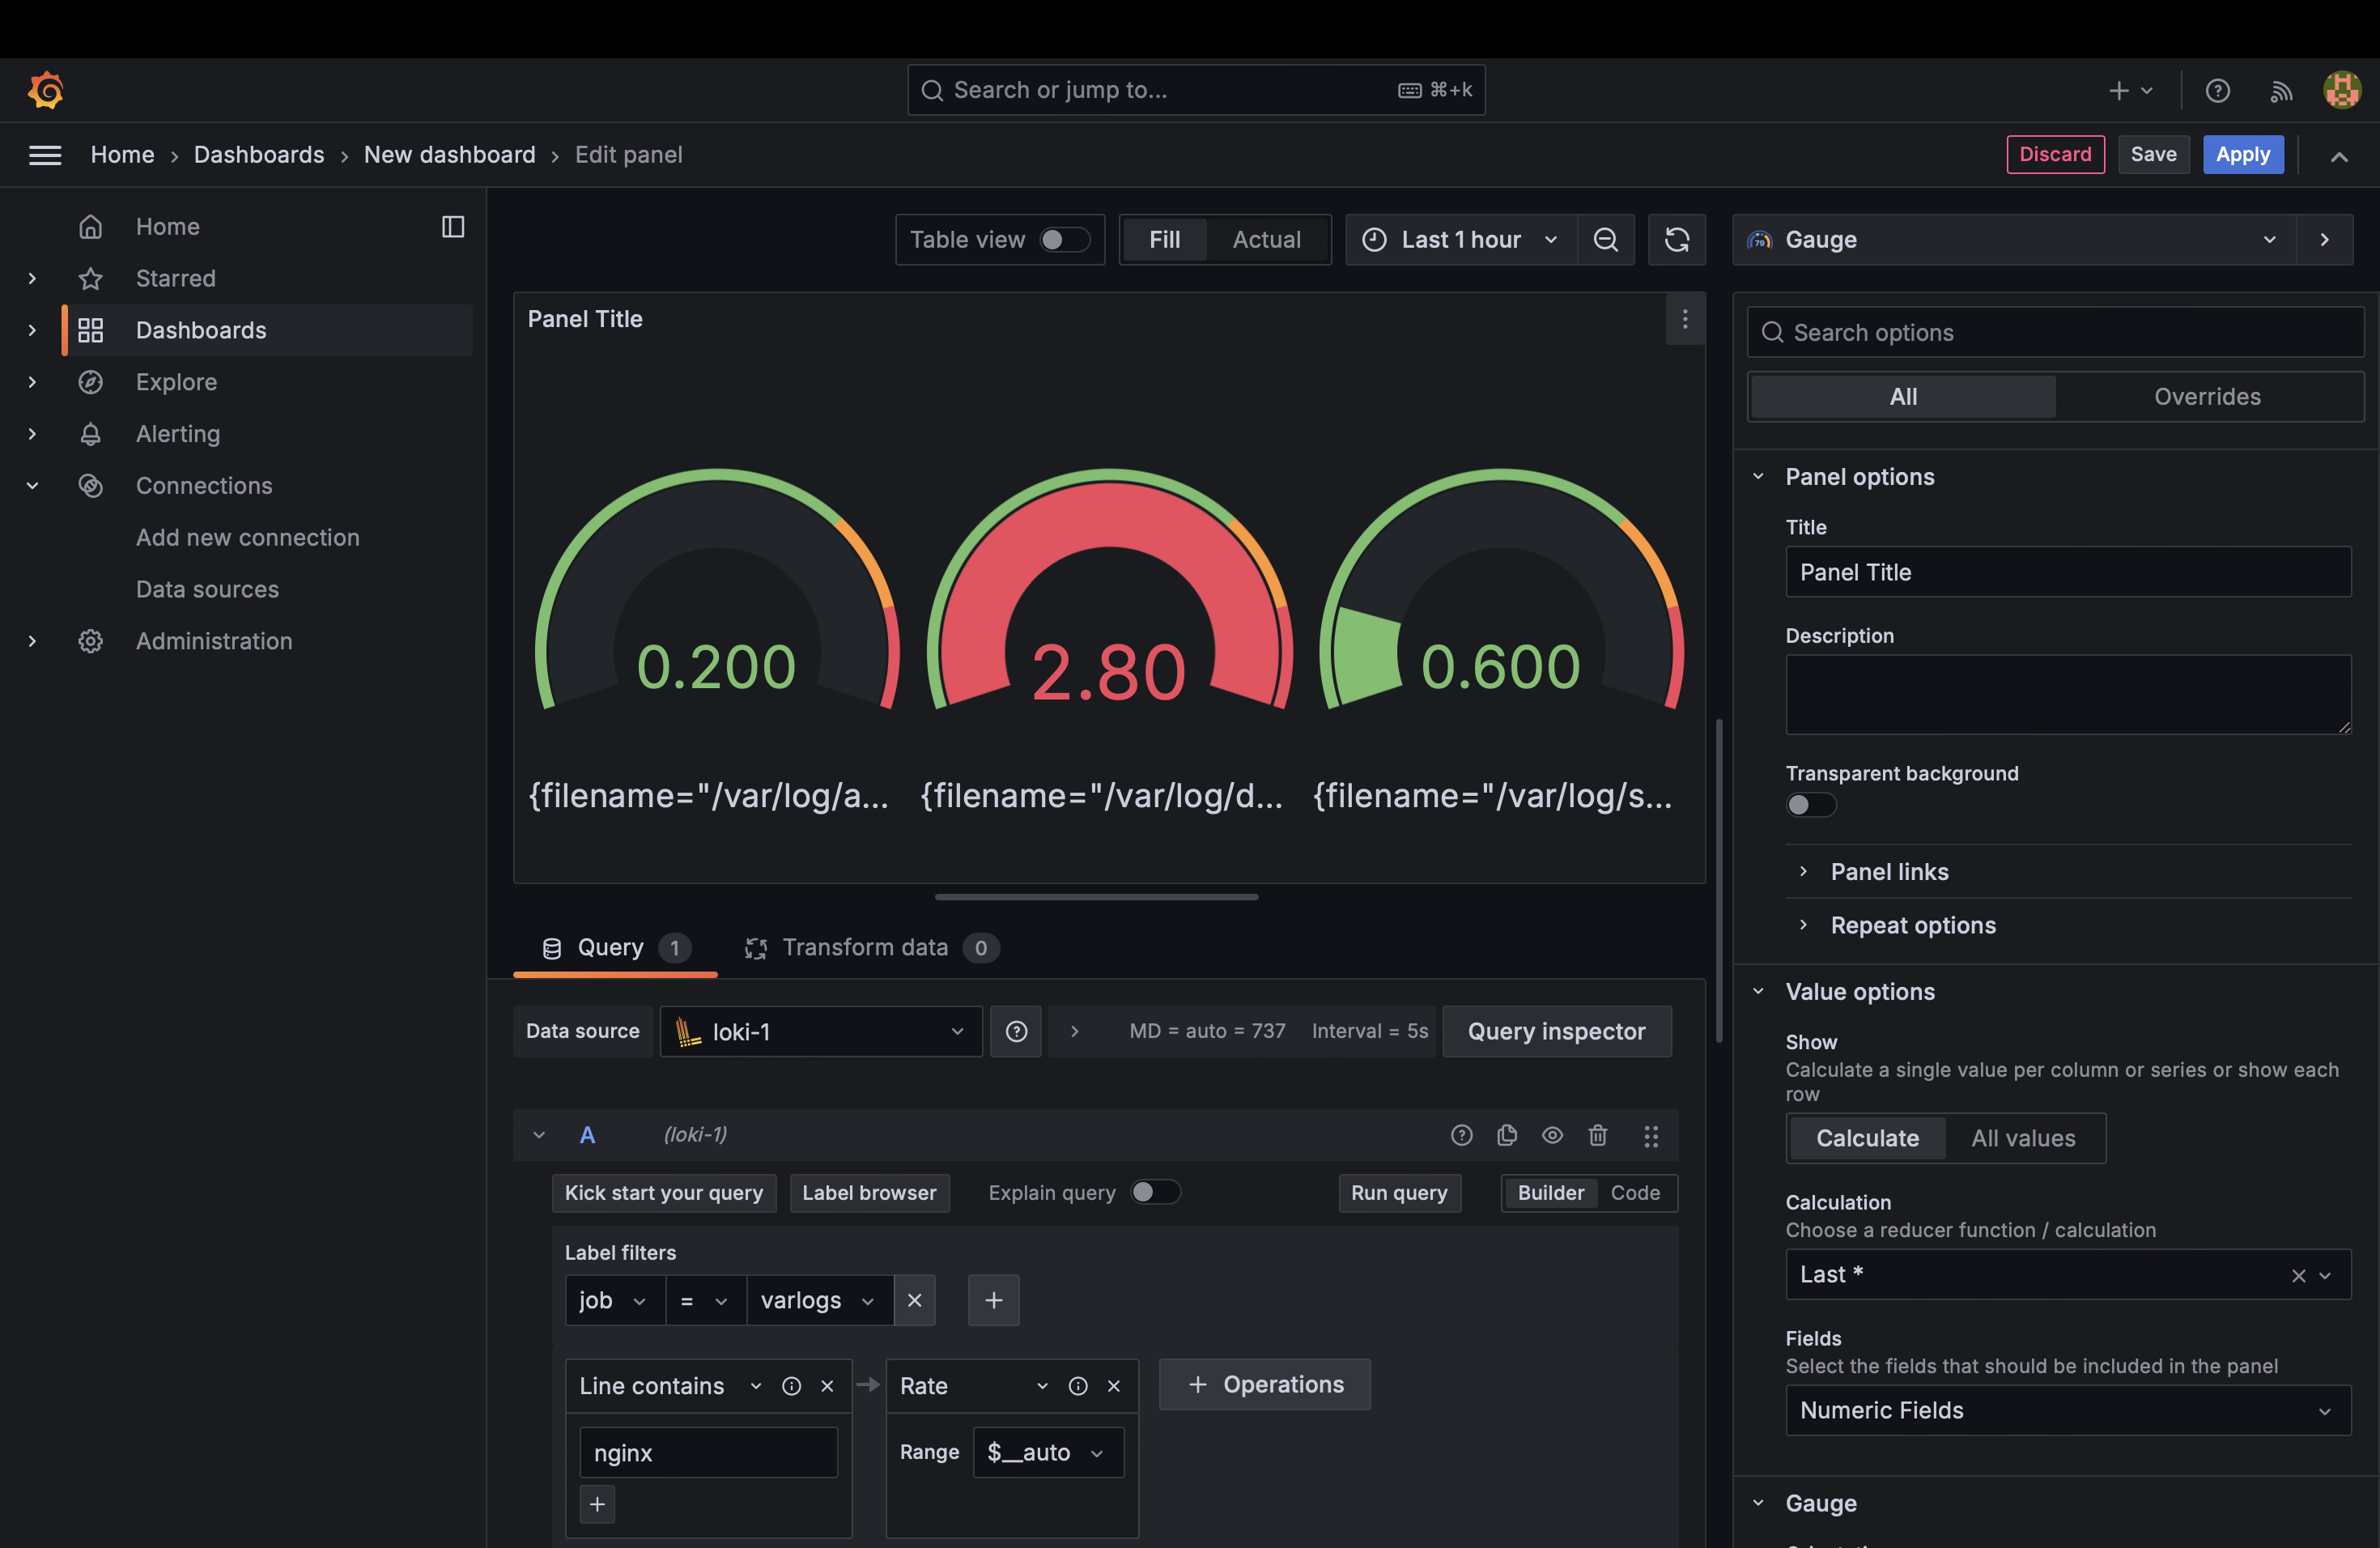
- A Grafana dashboard offers a comprehensive view of your data, allowing you to track metrics and trends through different visualizations. Dashboards are made up of panels, each representing a specific aspect of the data story you want to convey. Each panel consists of a query, defining the data you wish to display, and a visualization, defining how the data is presented.
Task: Build a Simple Grafana Dashboard
- In the sidebar, hover your cursor over the Create (plus sign) icon and then click "New Dashboard".

- Click "Add visualization" and select Prometheus as your data source.


- In the Query editor below the graph, enter the below query and then press Shift + Enter:
100 - (avg by(instance) (irate(node_cpu_seconds_total{mode="idle"}[5m])) * 100)
This query calculates the CPU usage percentage by subtracting the average idle CPU time (node_cpu_seconds_total) from 100.

- In the Panel editor on the right, under Settings, change the panel title to “CPU Usage Percentage”.

- Click "Apply" in the top-right corner to save the panel and go back to the dashboard view.

- Click the "Save dashboard" (disk) icon at the top of the dashboard to save your dashboard.

- Enter a name in the Dashboard name field and then click Save.

0
Subscribe to my newsletter
Read articles from Pooja Bhavani directly inside your inbox. Subscribe to the newsletter, and don't miss out.
Written by
