Day 77 Alerting
 Pooja Bhavani
Grafana Cloud: Simplified and Scalable Monitoring
- Grafana Cloud is a comprehensive and managed observability platform offered by Grafana Labs. It brings together a suite of tools, including Grafana for visualization, Prometheus for monitoring, and Loki for log aggregation, into a unified and fully managed solution. With Grafana Cloud, teams can effortlessly set up, maintain, and scale their monitoring infrastructure, freeing up valuable time and resources for other critical tasks.
Grafana Alerting: Stay Informed, Act Swiftly
- Grafana Alerting is an integral part of Grafana Cloud, enabling us to proactively monitor our systems and respond to anomalies and incidents in real time. With Grafana Alerting, we can define alert rules based on specific thresholds or conditions, and receive instant notifications via various channels like email, Slack, PagerDuty, or custom webhooks when those rules are triggered.
Key Features of Grafana Alerting:
Rule-based Alerts: We can create rules using PromQL (Prometheus Query Language) expressions to evaluate metrics data and define alert conditions.
Multiple Notification Channels: Grafana supports a wide range of notification channels, allowing us to receive alerts in the most convenient and timely manner.
Silencing and Muting: We can silence or mute specific alerts during maintenance or known incidents to avoid unnecessary noise.
Alert History and Tracking: Grafana maintains a history of triggered alerts, giving us insights into past incidents and their resolutions.
Dashboard Integration: We can visualize alerts directly on Grafana dashboards, providing a holistic view of our system's health.
Task: Setup Grafana Cloud and Sample Alerting
Step 1: Setup Grafana Cloud Account
- Navigate to the Grafana Cloud website (https://grafana.com/cloud/) and sign up for an account.

- Follow the on-screen instructions to set up your Grafana Cloud account, including providing the necessary details and configuring preferences.

- Scroll down until you see the Prometheus option and hit the 'Send Metrics' button.

- Follow the instructions on the screen to integrate your Prometheus Server with Grafana Cloud.

- You will have to add the
remote_writemodule to your existingprometheus.ymlconfig file.

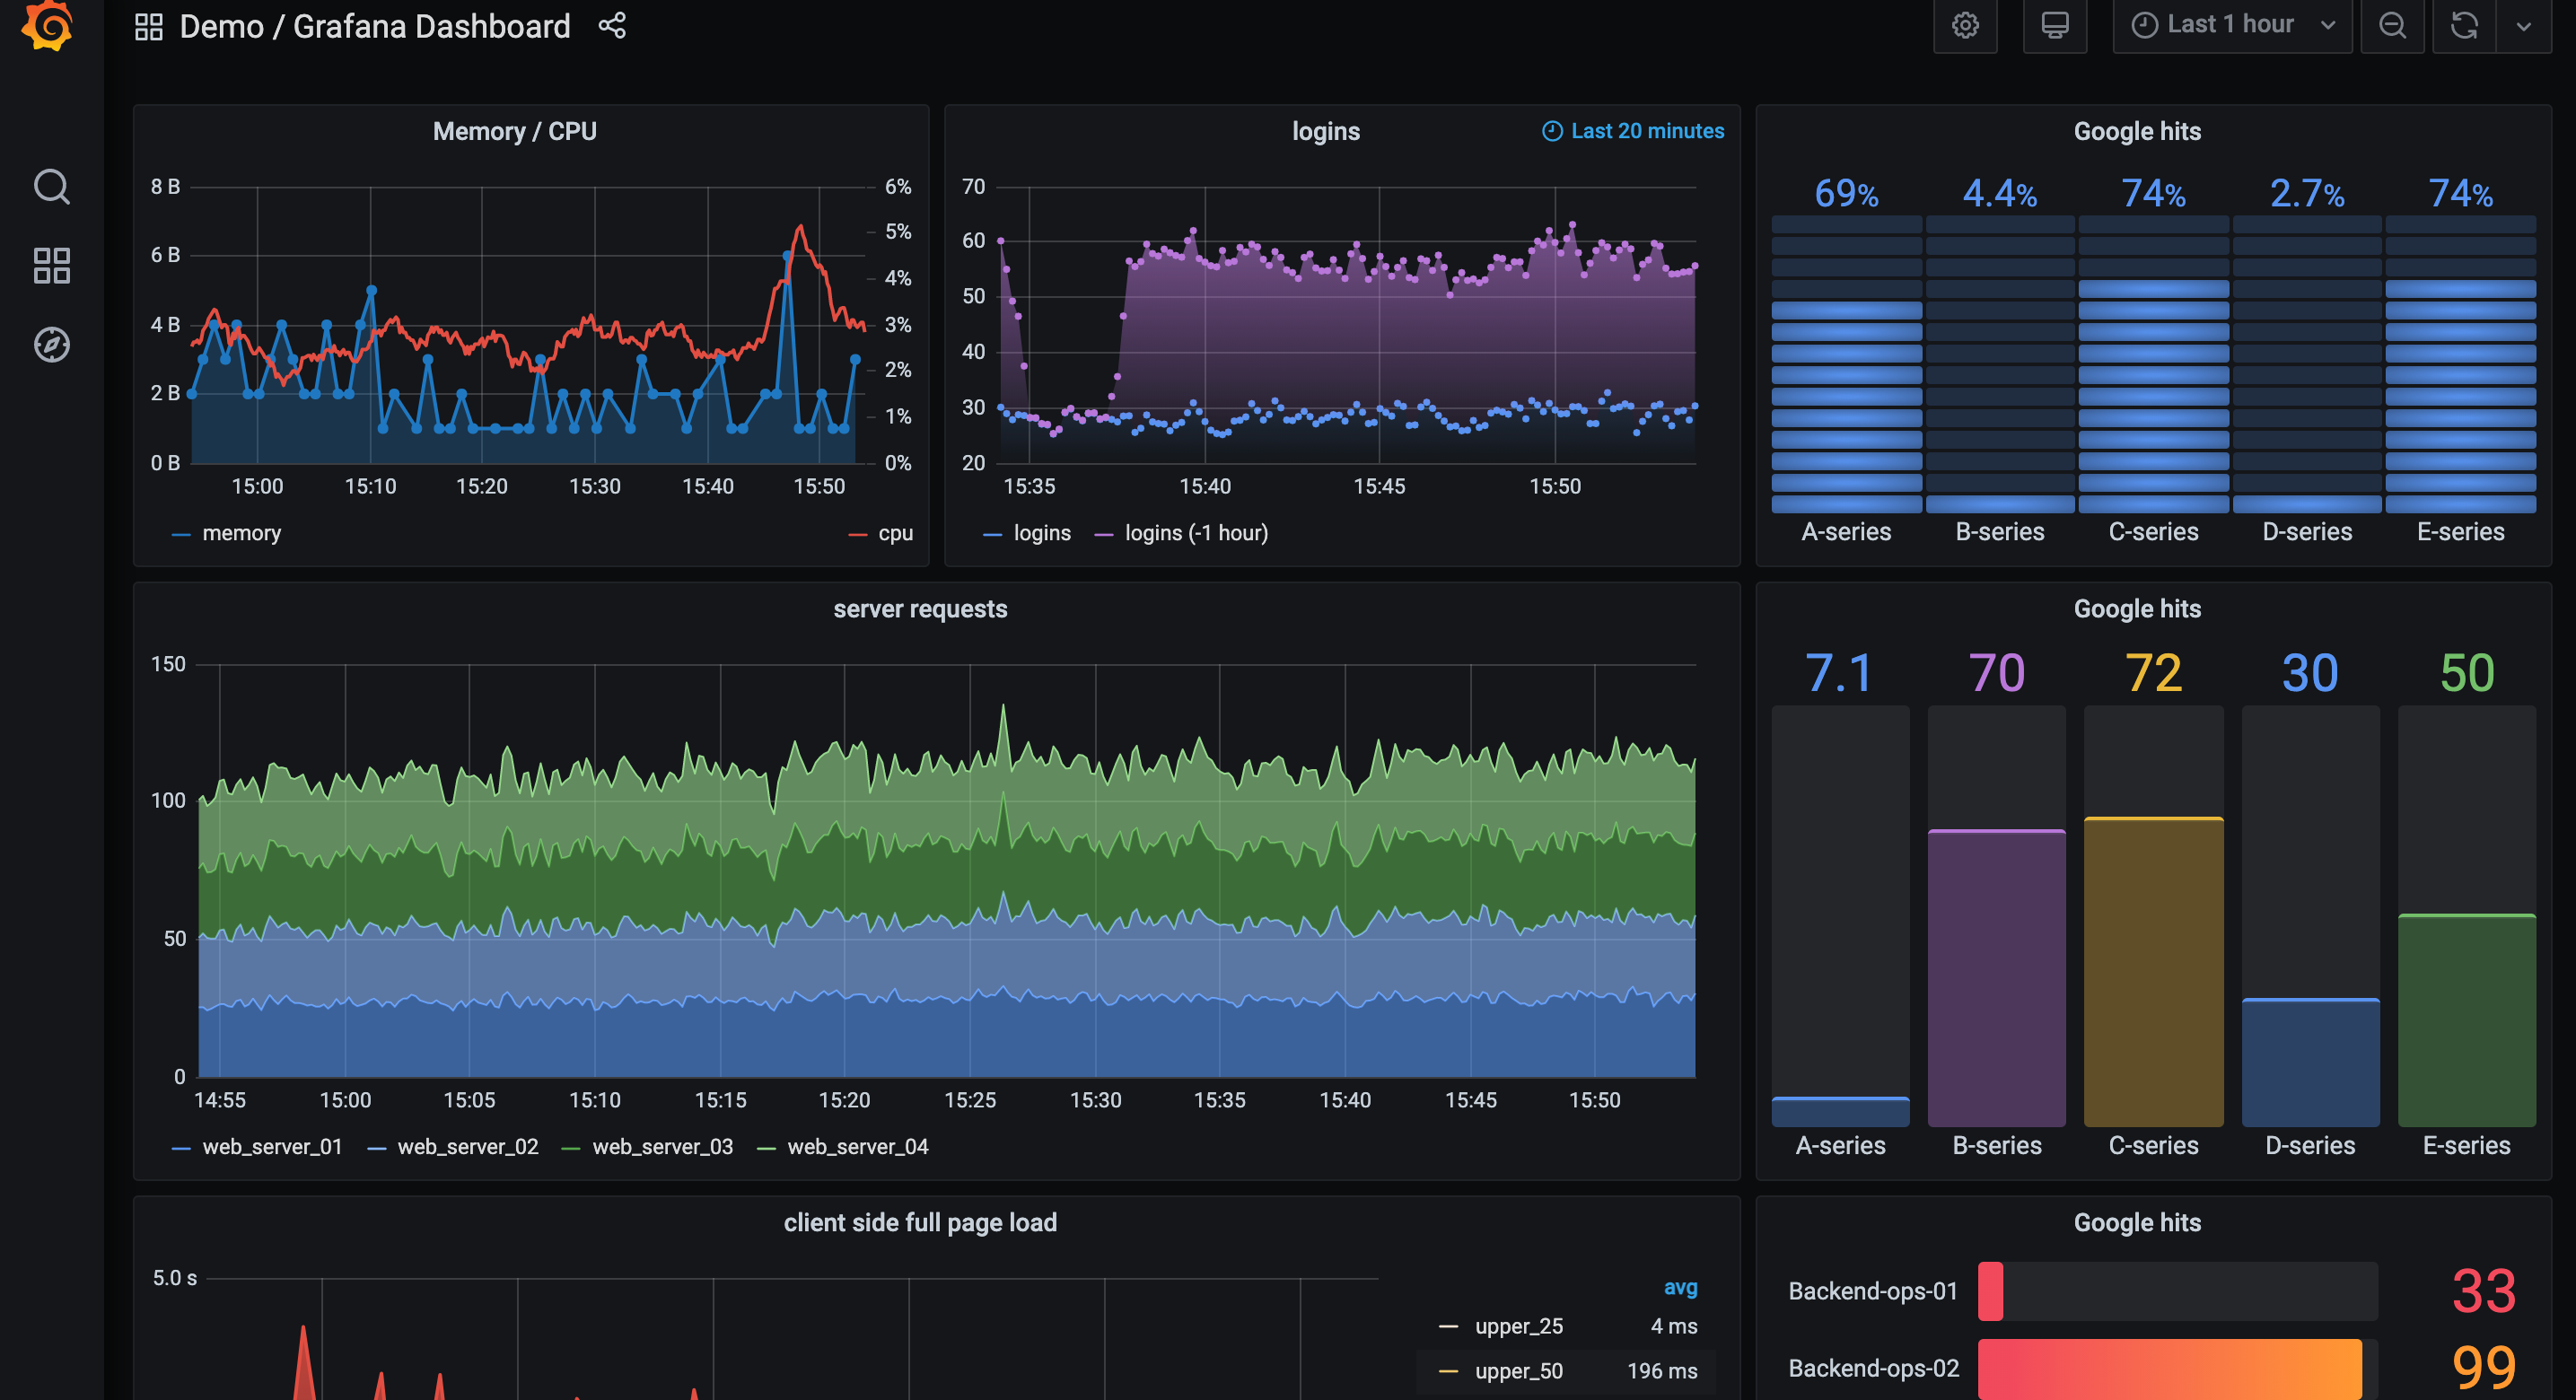
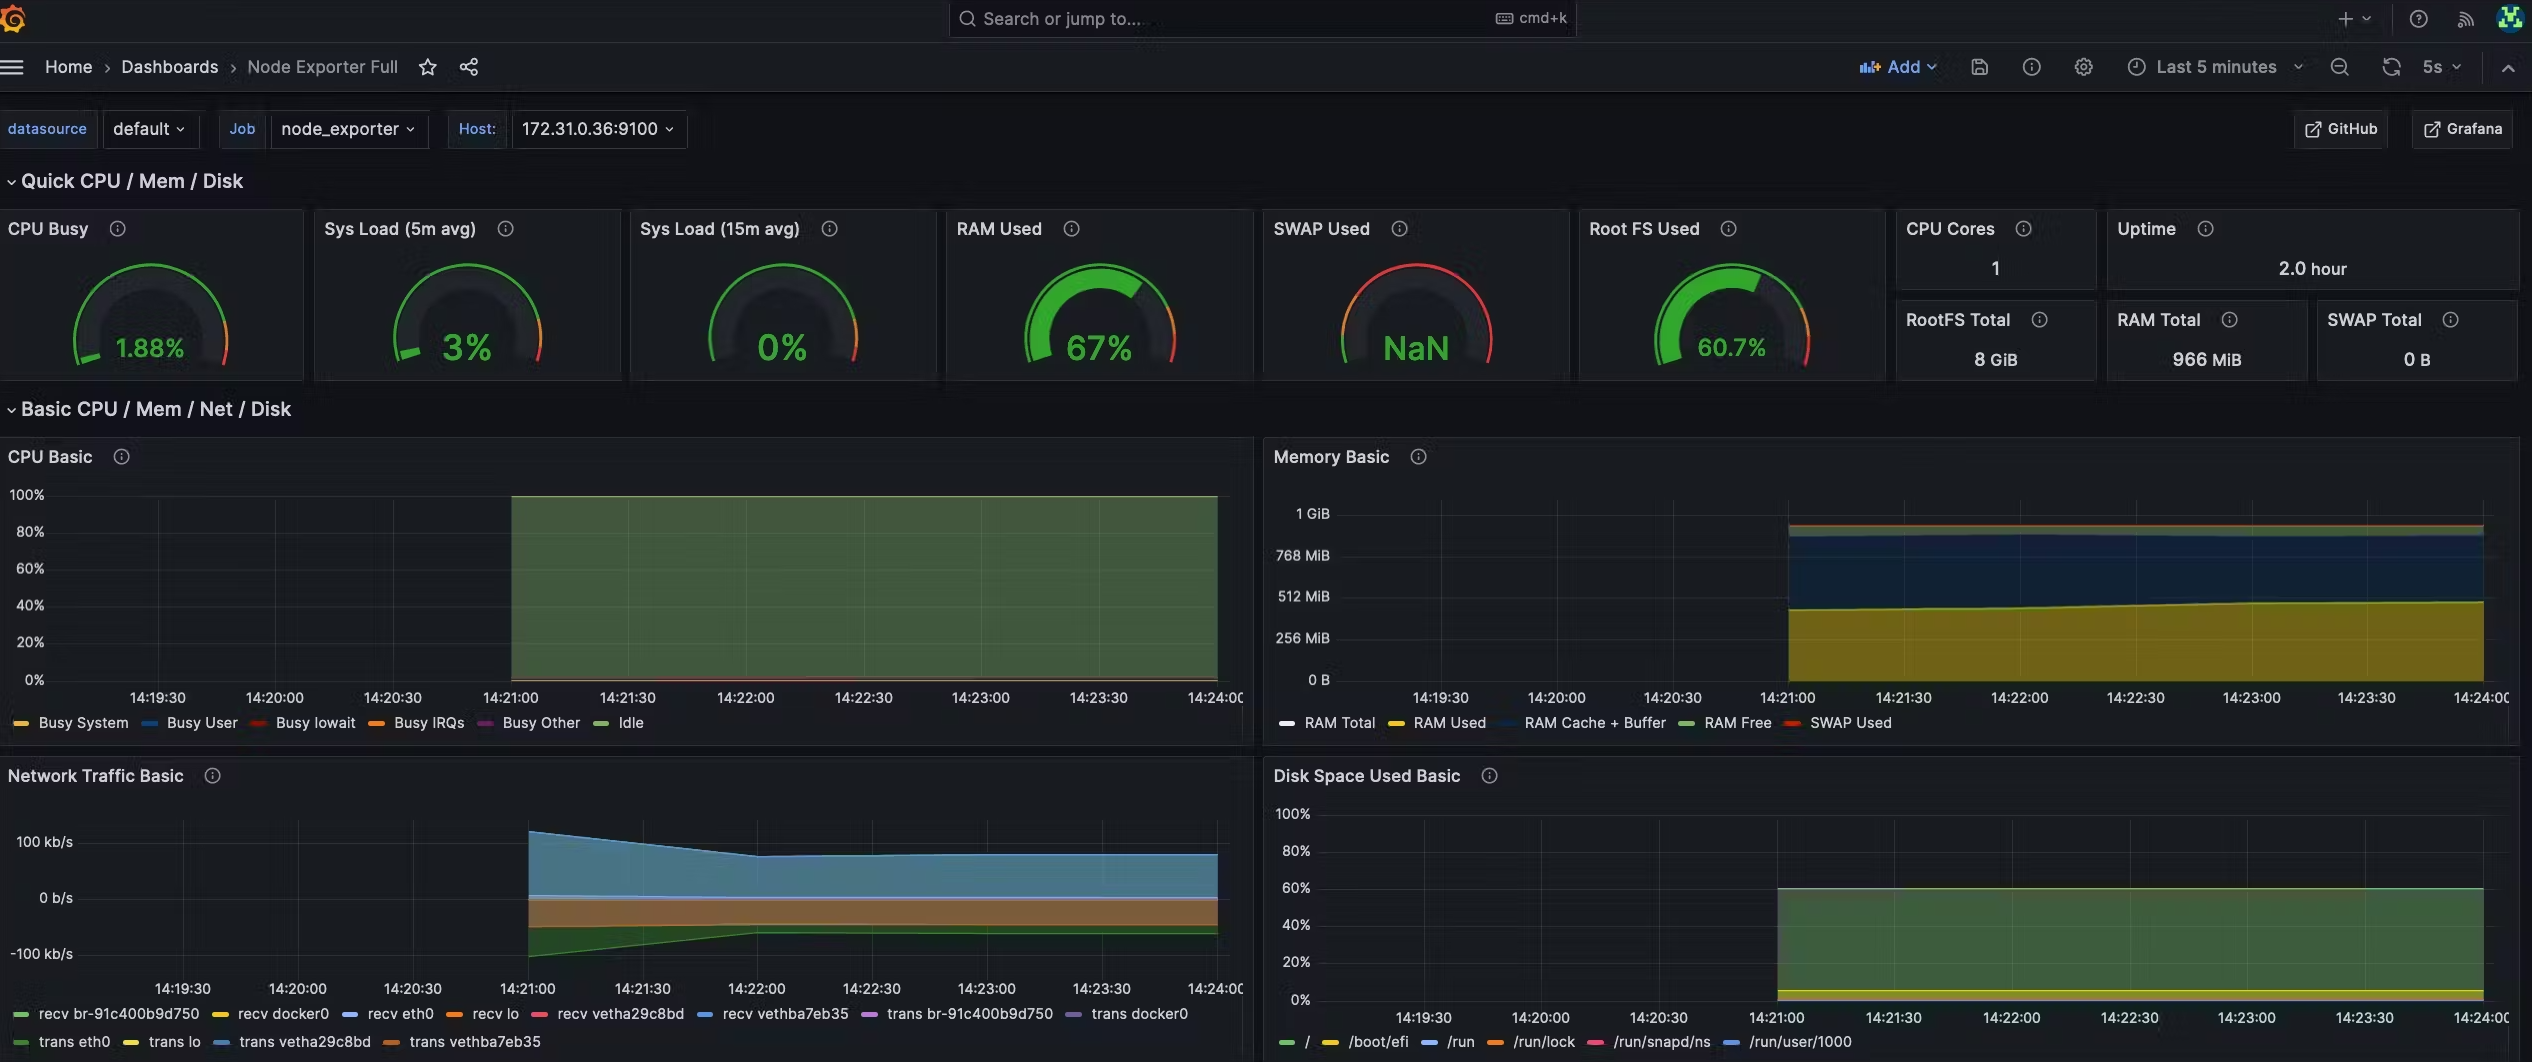
- Once this is set up, we can import our preferred Grafana dashboard or create our own one and start monitoring our infrastructure.

Step 2: Setup Sample Alerting
This step will be completed in Grafana OSS.
Log in to your Grafana dashboard.
Click on "Alerting" in the left-hand sidebar to access the Alerting configuration.

Click on "Create Rule" to set up a new alerting rule.

- Define the conditions for the alerting rule based on your data and requirements. Once done, save the Alert Rule.

- Select Contact Points to specify the notification channels, such as email, Slack, or other integrations, where alerts will be sent when triggered. In this case, I will use Slack. You can follow the steps from the Slack Official Documentation to send messages using Incoming Webhooks.

- Our alert is now in a normal state as the CPU usage is not higher than 2% at the moment.

- Let's stress our system using the below commands and see if the alerting system works as expected.
 sudo apt install stress
 stress --cpu 4
- We can see how our alert rule is now on 'Firing' mode and has triggered and slack alert.


- As soon as we stop the stress test, the system will resolve the alert and notify us via Slack.

Subscribe to my newsletter
Read articles from Pooja Bhavani directly inside your inbox. Subscribe to the newsletter, and don't miss out.
Written by
