Understanding Covariance, Correlation, and Collinearity: A Comprehensive Guide
 Deepak Kumar Mohanty
In the world of statistics and data analysis, understanding how different variables interact is crucial for building effective models. Three important concepts that help us analyze these relationships are covariance, correlation, and collinearity. In this blog post, we’ll explore these concepts, their relationships, and their significance in data analysis using a simple example.
What is Covariance?
Definition:
Covariance measures how two variables change together. It tells us whether they increase or decrease simultaneously, or if one increases while the other decreases.
Key Points:
Direction Only: Covariance indicates the direction of the relationship:
Positive Covariance: When one variable increases, the other tends to increase.
Negative Covariance: When one variable increases, the other tends to decrease.
Interpretation Difficulty: The value of covariance depends on the units of the variables (e.g., height in cm and weight in kg), making it difficult to compare across datasets.
Example:
Consider the height and weight of students:
If taller students tend to weigh more, there’s a positive covariance.
If taller students tend to weigh less, there’s a negative covariance.
Formula:

Where:
Xi and Yi are individual data points for variables X and Y.
Xˉ and Yˉ are the means of X and Y, respectively.
n is the total number of data points.
n-1 is known as Bessel's correction and is used to provide an unbiased estimate of the population covariance.
What is Correlation ?
Definition:
Correlation is a standardized version of covariance (i.e., how two variables relate to each other), telling us both the direction and the strength of the relationship between two variables. It always ranges between -1 and 1.
It is denoted by r.
Key Points:
Standardized Value: Correlation removes the issue of units and provides a clearer interpretation by scaling between -1 and 1.
Interpretation:
r=1: Perfect positive correlation (both variables move together exactly).
r=−1: Perfect negative correlation (one increases while the other decreases).
r=0: No correlation (no relationship between the variables).
Easier Comparison: Because correlation is unit-free, it is easier to compare relationships across different datasets.
Example:
Using the same height and weight example:
If taller students generally weigh more, correlation will be close to 1.
If there’s no clear relationship between height and weight, correlation will be close to 0.
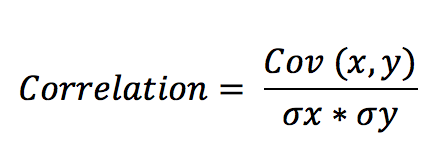
Formula:

Where:
Cov(X,Y) is the covariance between variables x and y.
σx and σy are the standard deviations of x and y.
What is Collinearity?
Definition:
Collinearity occurs when one feature is linearly dependent on another, meaning one variable can be derived from another in a linear manner. This may cause issues in statistical modeling or machine learning, as it leads to redundancy.
Key Points:
- Perfect Collinearity: When one variable is an exact multiple or function of another.
Implications: In models, high collinearity can cause instability and inflate variance in estimates, making it hard to distinguish the effect of individual features.
A Practical Example
Let’s consider a simple dataset with two features x and y:
x = [2, 3, 4, 5]
y = [4, 6, 8, 10]
1. Correlation Analysis
In this case, as x increases, y also increases in a perfectly consistent way (specifically, y=2 * x). This means the correlation between x and y is perfect and positive, resulting in a correlation coefficient of 1.
2. Collinearity Analysis
Since y can be derived directly from x (as y is exactly twice x), this indicates that x and y are perfectly collinear. Including both in a model would not be beneficial, as they convey the same information.
3. Covariance Analysis
The covariance in this case would be positive, indicating that both x and y increase together. Since y increases as x increases, the covariance would be a positive value.
Key Differences Between Covariance, Correlation, and Collinearity :
| Concept | Definition | Interpretation |
| Covariance | Measures how two variables change together. | If the covariance is positive, both variables tend to go up or down together. If it's negative, one variable goes up while the other goes down. |
| Correlation | A measure of how closely two variables are related. | Ranges from -1 to 1: 1 means a perfect positive relationship, -1 means a perfect negative relationship, and 0 means no relationship at all. |
| Collinearity | Happens when one variable can be exactly predicted from another. | Shows redundancy; if two variables are collinear, using both in a model may not add any extra useful information. |
Summary:
To summarize, covariance, correlation, and collinearity provide different perspectives on the relationships between variables:
Covariance tells you if two variables move together and in what direction (positive or negative), but its value can be hard to interpret due to unit dependency.
Correlation not only indicates the direction but also the strength of the relationship, giving a standardized value between -1 and 1 that’s easier to compare across datasets.
Collinearity points out when one variable can be perfectly predicted from another, which can complicate modeling efforts.
Conclusion:
Understanding these concepts is fundamental for effective data analysis. By grasping how covariance, correlation, and collinearity work together, you can derive meaningful insights and build robust predictive models that truly reflect the relationships in your data.
Call to Action:
I’d love to hear your thoughts on this topic! Have you encountered any challenges with correlation, collinearity, or covariance? Feel free to share your experiences in the comments below. If you found this post helpful, please share it with your network!
Connect with Me
To stay updated on my latest posts and insights in data science, follow me on LinkedIn . Let’s Connect and explore the fascinating world of data together!
Subscribe to my newsletter
Read articles from Deepak Kumar Mohanty directly inside your inbox. Subscribe to the newsletter, and don't miss out.
Written by

Deepak Kumar Mohanty
Deepak Kumar Mohanty
Hi there! I'm Deepak Mohanty, a BCA graduate from Bhadrak Autonomous College, affiliated with Fakir Mohan University in Balasore, Odisha, India. Currently, I'm diving deep into the world of Data Science. I'm passionate about understanding the various techniques, algorithms, and applications of data science. My goal is to build a solid foundation in this field and share my learning journey through my blog. I'm eager to explore how data science is used in different industries and contribute to solving real-world problems with data.