Integrate Open Telemetry for Java
 Ankita Lunawat
Prerequisites
Before you start, ensure you have the following installed on your system.
EC2 Instance with t2.micro
Java Development Kit (JDK) and Maven with Open Telemetry collector installed.
Set Up Ubuntu EC2 Instance
If you don't have JDK or Maven installed on your system, you can install them using the following commands.
Update the package list.
sudo apt update
Spring Boot requires Java, so install OpenJDK.
sudo apt install openjdk-17-jdk -y
Verify the Java install.
java -version
Install Maven.
sudo apt install maven -y
Verify the Maven install
mvn -version
Integrate Open Telemetry for Java Project with maven
Maven uses a standard directory layout for easy project management, and you can create a new Maven project using the command line.
Run the following command to create a new project.
mvn archetype:generate -DgroupId=com.example -DartifactId=helloworld -DarchetypeArtifactId=maven-archetype-quickstart -DinteractiveMode=false
groupId: A unique identifier for your project, usually the package name.
artifactId: The name of your project.
archetypeArtifactId: The template for the project;
maven-archetype-quickstartcreates a simple Java project.interactiveMode: Set to
falseto skip interactive prompts..
This command will generate the following directory structure.
helloworld
├── pom.xml
└── src
    ├── main
    │   └── java
    │       └── com
    │           └── example
    │               └── App.java
    └── test
        └── java
            └── com
                └── example
                    └── AppTest.java
Go to the project directory.
cd helloworld
Open the pom.xml file and update it to include Spring Boot dependencies and Open Telemetry dependencies.
The pom.xml (Project Object Model) file is the core of a Maven project and contains configuration details like dependencies, build settings, and project information.
nano pom.xml
replace its content with the following.
<project xmlns="http://maven.apache.org/POM/4.0.0" xmlns:xsi="http://www.w3.org/2001/XMLSchema-instance"
  xsi:schemaLocation="http://maven.apache.org/POM/4.0.0 http://maven.apache.org/maven-v4_0_0.xsd">
  <modelVersion>4.0.0</modelVersion>
  <groupId>com.example</groupId>
  <artifactId>helloworld</artifactId>
  <packaging>jar</packaging>
  <version>1.0-SNAPSHOT</version>
  <name>helloworld</name>
  <url>http://maven.apache.org</url>
  <parent>
    <groupId>org.springframework.boot</groupId>
    <artifactId>spring-boot-starter-parent</artifactId>
    <version>3.0.0</version>
    <relativePath /> <!-- lookup parent from repository -->
  </parent>
  <dependencies>
    <dependency>
      <groupId>junit</groupId>
      <artifactId>junit</artifactId>
      <version>3.8.1</version>
      <scope>test</scope>
    </dependency>
    <dependency>
        <groupId>org.springframework.boot</groupId>
        <artifactId>spring-boot-starter-web</artifactId>
    </dependency>
    <dependency>
        <groupId>org.springframework.boot</groupId>
        <artifactId>spring-boot-starter-test</artifactId>
        <scope>test</scope>
    </dependency>
    <dependency>
      <groupId>io.opentelemetry</groupId>
      <artifactId>opentelemetry-api</artifactId>
    </dependency>
    <dependency>
      <groupId>io.opentelemetry</groupId>
      <artifactId>opentelemetry-sdk-trace</artifactId>
    </dependency>
    <dependency>
      <groupId>io.opentelemetry</groupId>
      <artifactId>opentelemetry-exporter-otlp</artifactId>
    </dependency>
    <dependency>
      <groupId>io.opentelemetry</groupId>
      <artifactId>opentelemetry-sdk</artifactId>
    </dependency>
    <dependency>
      <groupId>io.opentelemetry</groupId>
      <artifactId>opentelemetry-semconv</artifactId>
      <version>1.27.0-alpha</version>
    </dependency>
  </dependencies>
  <dependencyManagement>
    <dependencies>
      <dependency>
        <groupId>io.opentelemetry</groupId>
        <artifactId>opentelemetry-bom</artifactId>
        <version>1.42.1</version>
        <type>pom</type>
        <scope>import</scope>
      </dependency>
    </dependencies>
  </dependencyManagement>
  <build>
    <plugins>
        <plugin>
            <groupId>org.springframework.boot</groupId>
            <artifactId>spring-boot-maven-plugin</artifactId>
        </plugin>
  </plugins>
  </build>
</project>
Edit the App.java in src/main/java/com/example/ and add Open Telemetry instrumentation.
For that first navigate to the directory.
cd src/main/java/com/example
Open a file App.java with following command.
vi App.java
Add the following content into it.
package com.example.helloworld;

import io.opentelemetry.api.GlobalOpenTelemetry;
import io.opentelemetry.api.OpenTelemetry;
import io.opentelemetry.api.trace.Span;
import io.opentelemetry.api.trace.SpanKind;
import io.opentelemetry.api.trace.Tracer;
import io.opentelemetry.context.Scope;
import io.opentelemetry.sdk.OpenTelemetrySdk;
import io.opentelemetry.sdk.resources.Resource;
import io.opentelemetry.sdk.trace.SdkTracerProvider;
import io.opentelemetry.sdk.trace.export.BatchSpanProcessor;
import io.opentelemetry.exporter.otlp.trace.OtlpGrpcSpanExporter;
import io.opentelemetry.semconv.resource.attributes.ResourceAttributes;
import org.springframework.boot.SpringApplication;
import org.springframework.boot.autoconfigure.SpringBootApplication;
import org.springframework.web.bind.annotation.GetMapping;
import org.springframework.web.bind.annotation.RestController;
import io.opentelemetry.api.common.Attributes;

@SpringBootApplication
public class App {

    private static final String SERVICE_NAME = "helloworld-service";
    private static OpenTelemetry openTelemetry;

    public static void main(String[] args) {
        initializeOpenTelemetry();
        SpringApplication.run(App.class, args);
    }

    private static void initializeOpenTelemetry() {
        // Create a resource with service name for identifying the service in traces
        Resource resource = Resource.getDefault()
            .merge(Resource.create(
                Attributes.of(ResourceAttributes.SERVICE_NAME, SERVICE_NAME)
            ));

        // Set up the OpenTelemetry exporter (OTLP in this case)
        OtlpGrpcSpanExporter spanExporter = OtlpGrpcSpanExporter.builder()
                .setEndpoint("http://localhost:4317") // Default OpenTelemetry Collector endpoint
                .build();

        // Create a tracer provider with the span processor and exporter
        SdkTracerProvider sdkTracerProvider = SdkTracerProvider.builder()
                .addSpanProcessor(BatchSpanProcessor.builder(spanExporter).build())
                .setResource(resource)
                .build();

        openTelemetry = OpenTelemetrySdk.builder()
                .setTracerProvider(sdkTracerProvider)
                .buildAndRegisterGlobal();
    }

    @RestController
    class HelloWorldController {
        private final Tracer tracer = GlobalOpenTelemetry.getTracer("example-tracer");

        @GetMapping("/hello")
        public String hello() {
            Span span = tracer.spanBuilder("hello-span")
                    .setSpanKind(SpanKind.SERVER)
                    .startSpan();

            try (Scope scope = span.makeCurrent()) {
                return "Hello World!";
            } finally {
                span.end();
            }
        }
    }
}
Install and Configure the Open Telemetry Collector for java project
The Open Telemetry Collector is a service that receives, processes, and exports telemetry data. Here’s how to install and configure it: exit the directories until you reach the root directory of the application.
cd ../../../../..
Download it using following command.
wget https://github.com/open-telemetry/opentelemetry-collector-releases/releases/download/v0.111.0/otelcol-contrib_0.111.0_linux_amd64.deb
Let's create a new directory to store the OpenTelemetry Collector configuration.
mkdir otelcol-config
Create the configuration file in the new directory.
nano otelcol-config/config.yaml
Add the following configuration into the file.
receivers:
  otlp:
    protocols:
      http:
      grpc:

exporters:
  debug: {}

service:
  pipelines:
    traces:
      receivers: [otlp]
      exporters: [debug]
Extract the contents of the OpenTelemetry Collector .deb package to locate the binary, then create a directory for the extracted files.
mkdir otelcol-extracted
Extract the contents into the directory.
dpkg-deb -x otelcol-contrib_0.111.0_linux_amd64.deb otelcol-extracted
After extraction, locate the binary within the extracted directory.
find otelcol-extracted -name "otelcol-contrib"
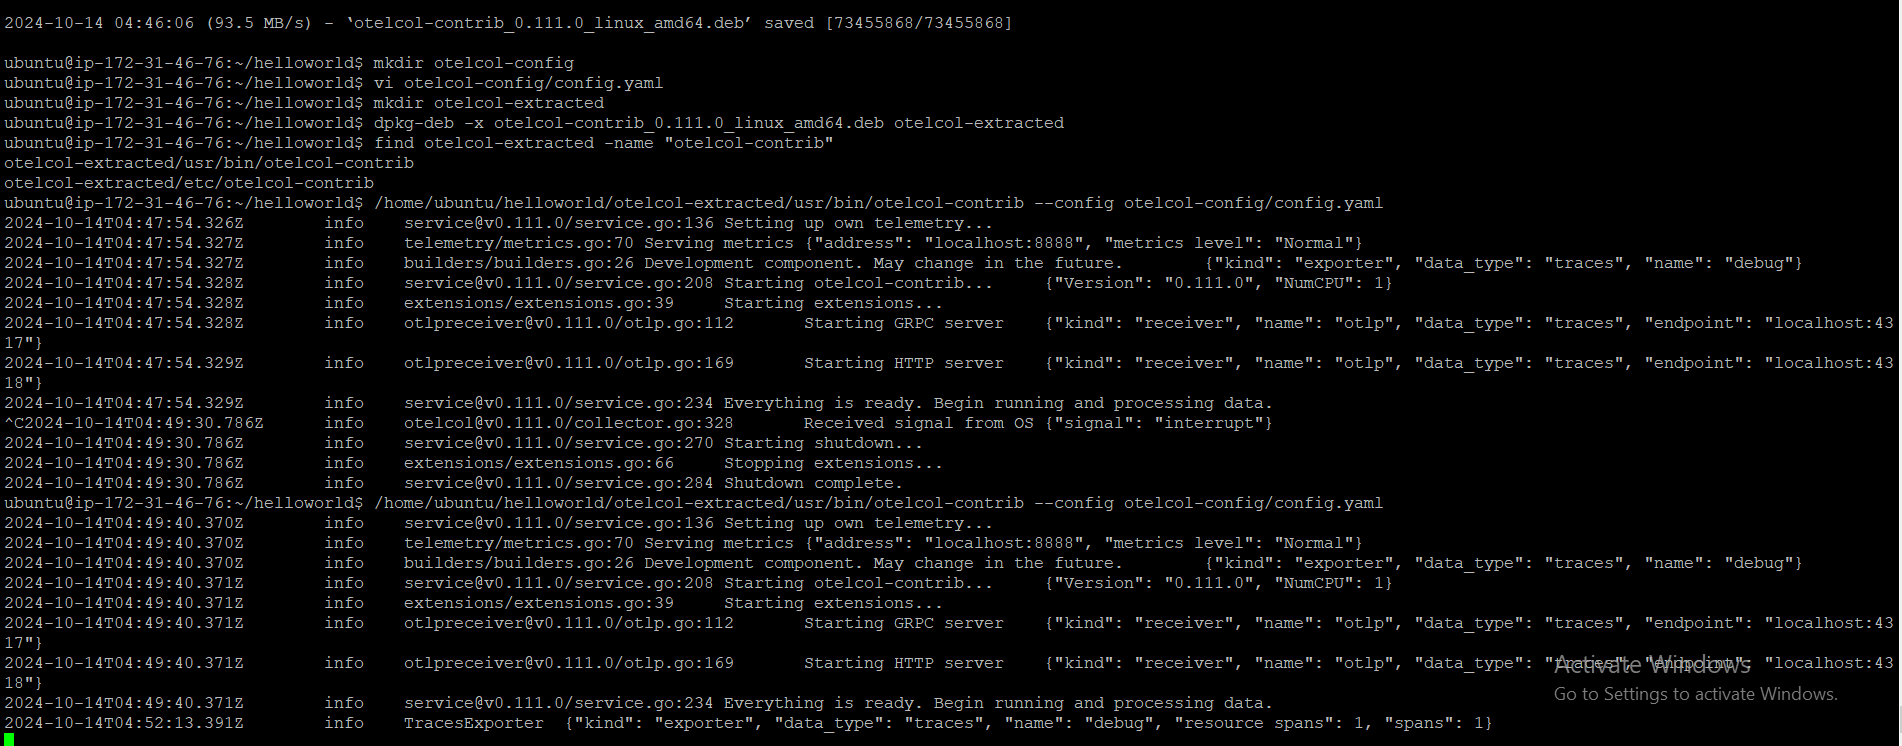
Once you locate the binary, you can execute it directly using its full path.
/home/ubuntu/helloworld/otelcol-extracted/usr/bin/otelcol-contrib --config otelcol-config/config.yaml
Build and Run the Java Application with Open Telemetry
Once the OpenTelemetry Collector is running and listening for traces, you can build and run your Spring Boot application.
mvn clean install
Explanation:
clean deletes the target directory, which contains the compiled code and other build artifacts, while install compiles the code, runs tests, and packages the application into a JAR file, which is stored in the target directory.
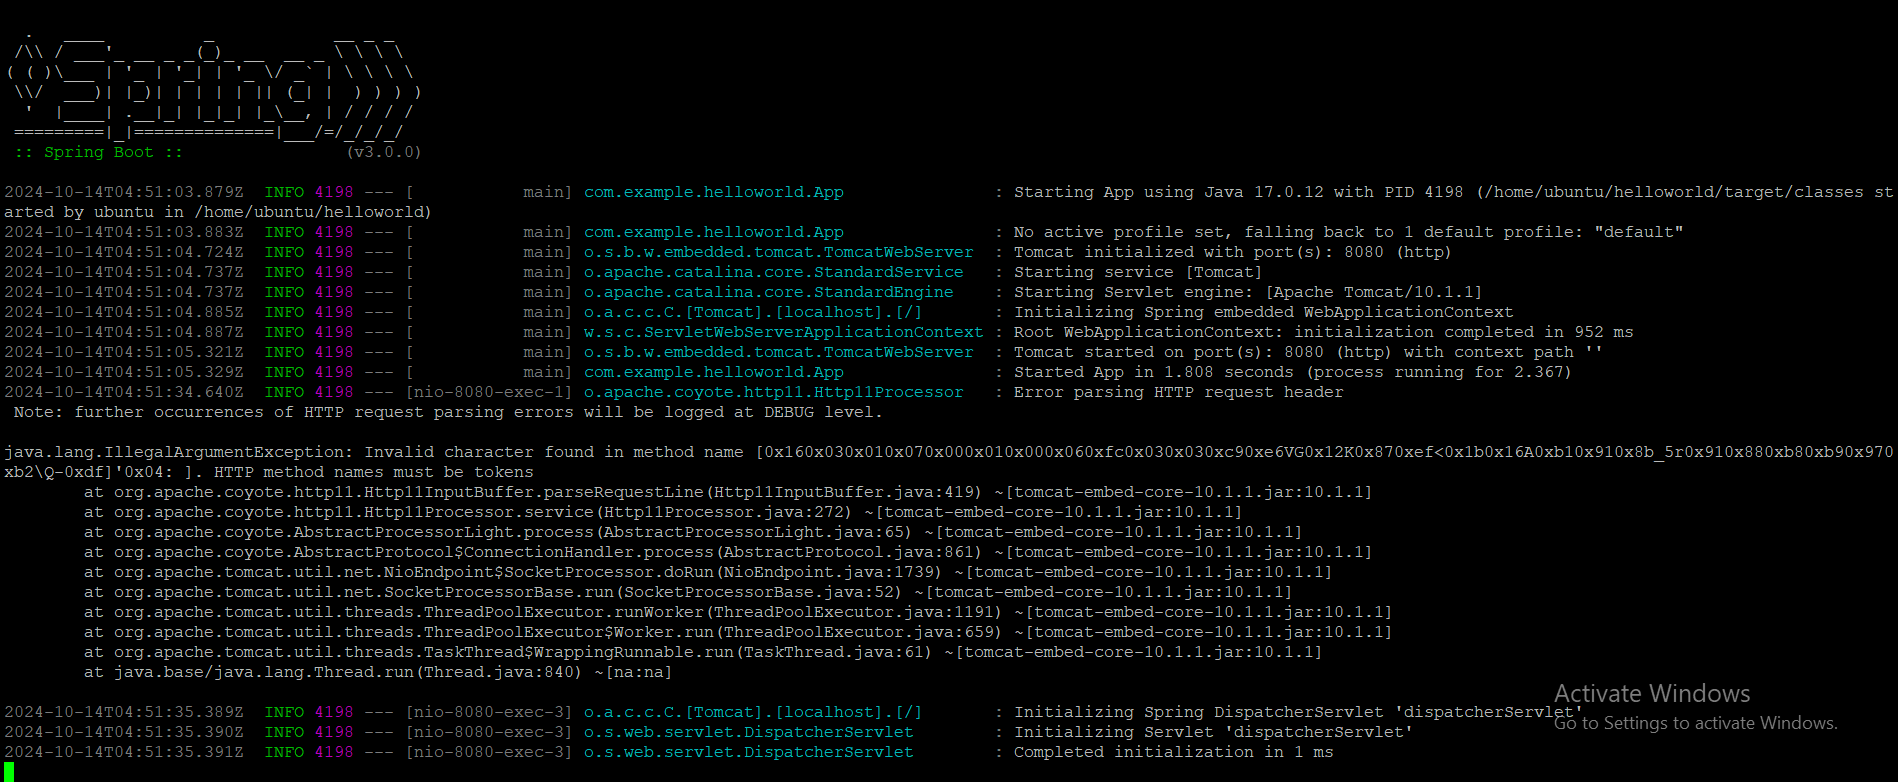
If everything is set up correctly, you should see output indicating a successful build. Run the application from the root of your project directory, where the pom.xml file is located.
mvn spring-boot:run
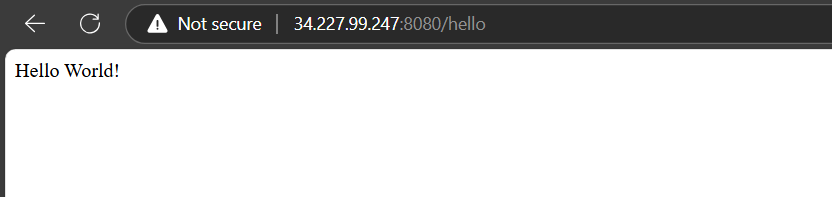
You can test your Spring Boot application by accessing the endpoint that returns "Hello World!" (e.g., http://<EC2-Instance-IP>:8080/hello), which should trigger trace data to be sent to the OpenTelemetry Collector.
With both the OpenTelemetry Collector and your Spring Boot application running, you should see logs in the terminal where the OpenTelemetry Collector is running, showing that it is receiving traces from your application.
The log message shows that the OpenTelemetry Collector's debug exporter successfully received trace data from your Spring Boot application.
“kind”: “exporter”: This indicates that the message is related to an exporter component of the OpenTelemetry Collector.
“data_type”: “traces”: This specifies that the data being handled is trace data.
“name”: “debug”: The name of the exporter that is logging this message.
“resource spans”: 1: This indicates that one resource span has been processed.
“spans”: 1: This indicates that one individual span was sent to the debug exporter.
Here, we have successfully integrate opentelemetry with Java.
Few Output Screenshots:
Subscribe to my newsletter
Read articles from Ankita Lunawat directly inside your inbox. Subscribe to the newsletter, and don't miss out.
Written by
Ankita Lunawat
Ankita Lunawat
Hi there! I'm a passionate AWS DevOps Engineer with 2+ years of experience in building and managing scalable, reliable, and secure cloud infrastructure. I'm excited to share my knowledge and insights through this blog. Here, you'll find articles on: AWS Services: Deep dives into core AWS services like EC2, S3, Lambda, and more. DevOps Practices: Best practices for CI/CD, infrastructure as code, and automation. Security: Tips and tricks for securing your AWS environments. Serverless Computing: Building and deploying serverless applications. Troubleshooting: Common issues and solutions in AWS. I'm always eager to learn and grow, and I hope this blog can be a valuable resource for fellow DevOps enthusiasts. Feel free to connect with me on [LinkedIn/Twitter] or leave a comment below!