Explore and Visualize Netflix Data Using AWS QuickSight
 Keerthi Ravilla Subramanyam
As we continue our journey through AWS services in this series, we now explore data visualization a important skill that helps us transform large data sets into clear, meaningful insights. Whether you're a beginner or have some experience with data, Amazon QuickSight is a great tool for creating beautiful and interactive dashboards. In this article, we'll go through the simple steps of storing Netflix data in an Amazon S3 bucket and visualizing it using Amazon QuickSight. Don't worry if you're new to these services this guide will explain everything in an easy-to-understand way.
Key Concepts
Amazon S3: Think of it as online storage like Dropbox or Google Drive, but more flexible for large datasets. You can store and access any amount of data anytime, anywhere. Features like versioning, lifecycle policies, and cross-region replication keeps your data secure, durable, and accessible.
Amazon QuickSight: Amazon QuickSight connects to various data sources, analyzes data, and shares insights with interactive dashboards. It includes machine learning insights, natural language queries, and collaboration tools, making it a powerful option for understanding data.
Data Visualization: This is turning data into visuals like graphs and charts to understand it better. It helps find patterns, trends, and outliers, aiding in data-driven decisions and clear communication. Tools like Amazon QuickSight provide various options like bar charts, line graphs, pie charts, and heat maps for different analysis needs.
ETL Process: ETL means Extract, Transform, Load. It's used to collect data from different sources, clean and format it, then load it into storage systems. This ensures data is accurate and ready for analysis, enabling better insights and decisions.
Prerequisites
AWS Account: You need an Amazon Web Services (AWS) account to use both S3 and QuickSight. Signing up is free, and the services come with free tiers.
Netflix Dataset: You’ll need a Netflix dataset to work with. You can find one by searching for the "Netflix dataset" on websites like Kaggle, Google Dataset Search or Amazon's AWS Datasets. Click here to navigate to the data, you can simpley download over there.
Familiarity with the AWS Management Console.
Step-by-Step Guide
Creating Your S3 Bucket
Step 1: Log into AWS
- Log in to the AWS Management Console.
Step 2: Create a New S3 Bucket
In the AWS Console, type S3 into the search bar and select S3 from the results.
Click on Create Bucket.
Name your bucket. It must be globally unique across all existing bucket names in Amazon S3. Choose a name that is descriptive and follows the naming conventions, such as including your project name or organization to avoid conflicts. For example, you could name it something like
my-unique-netflix-data-bucket.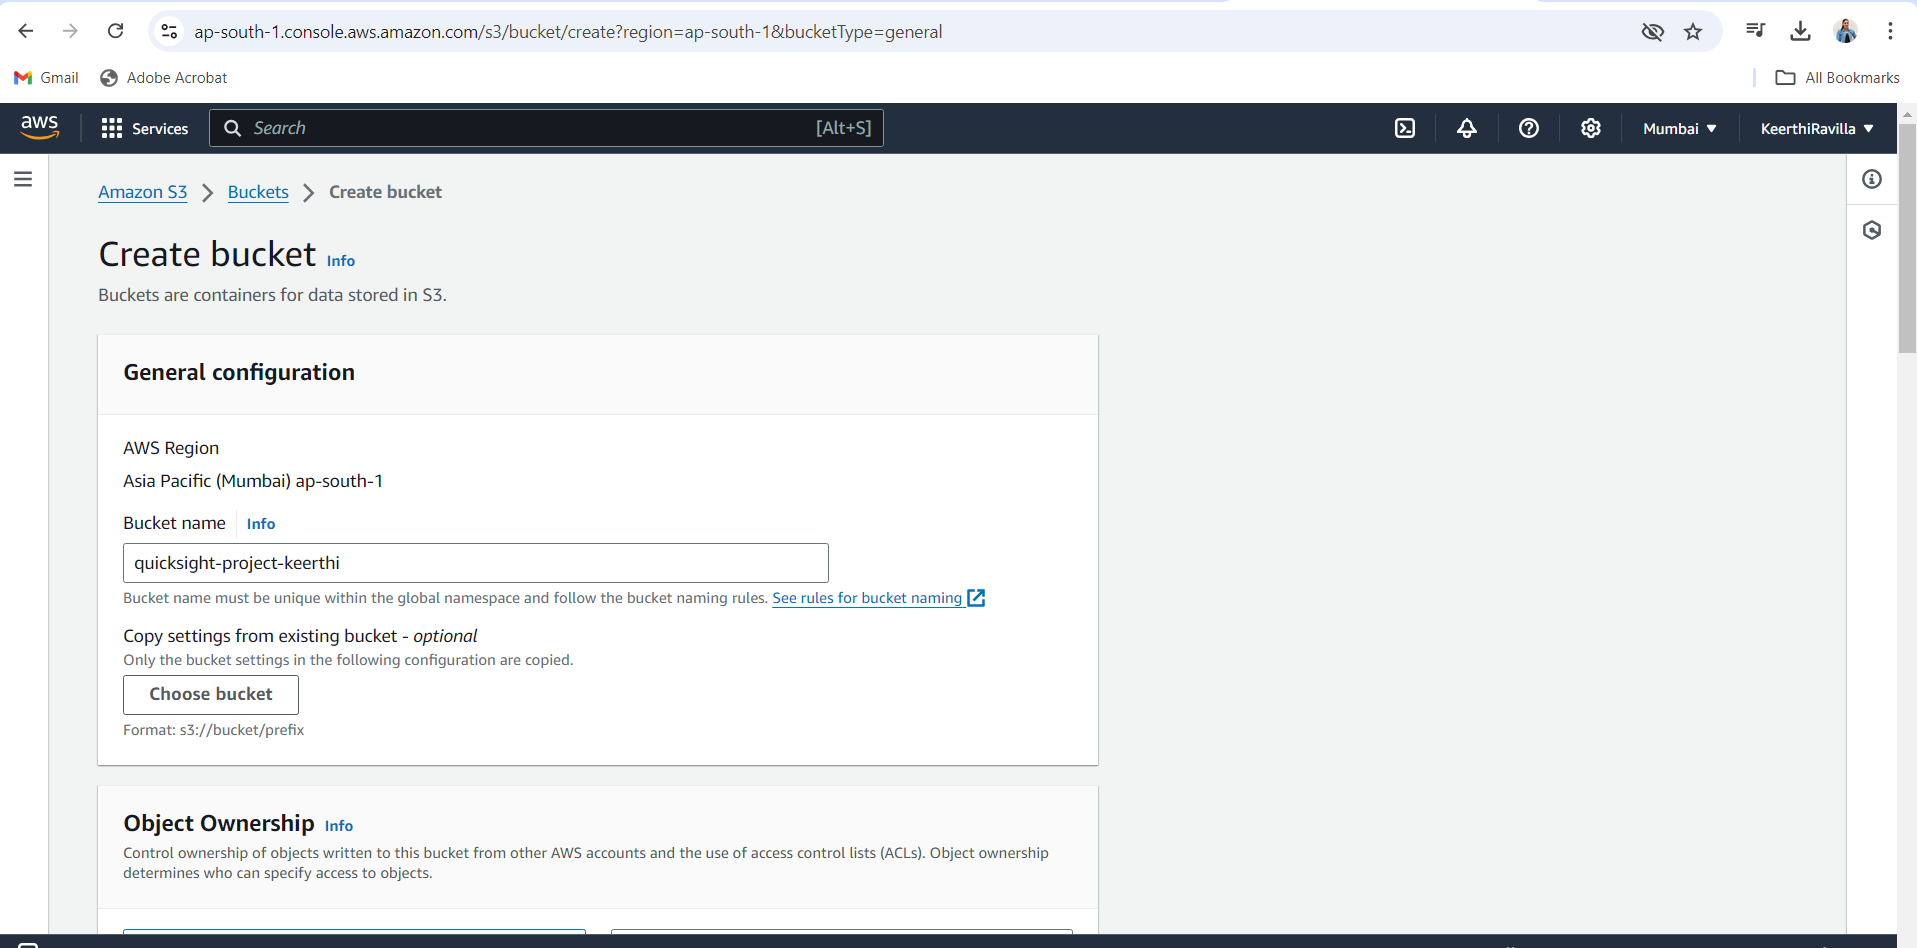
Choose the region closest to you for better performance.
Keep the other settings as default and click Create Bucket.
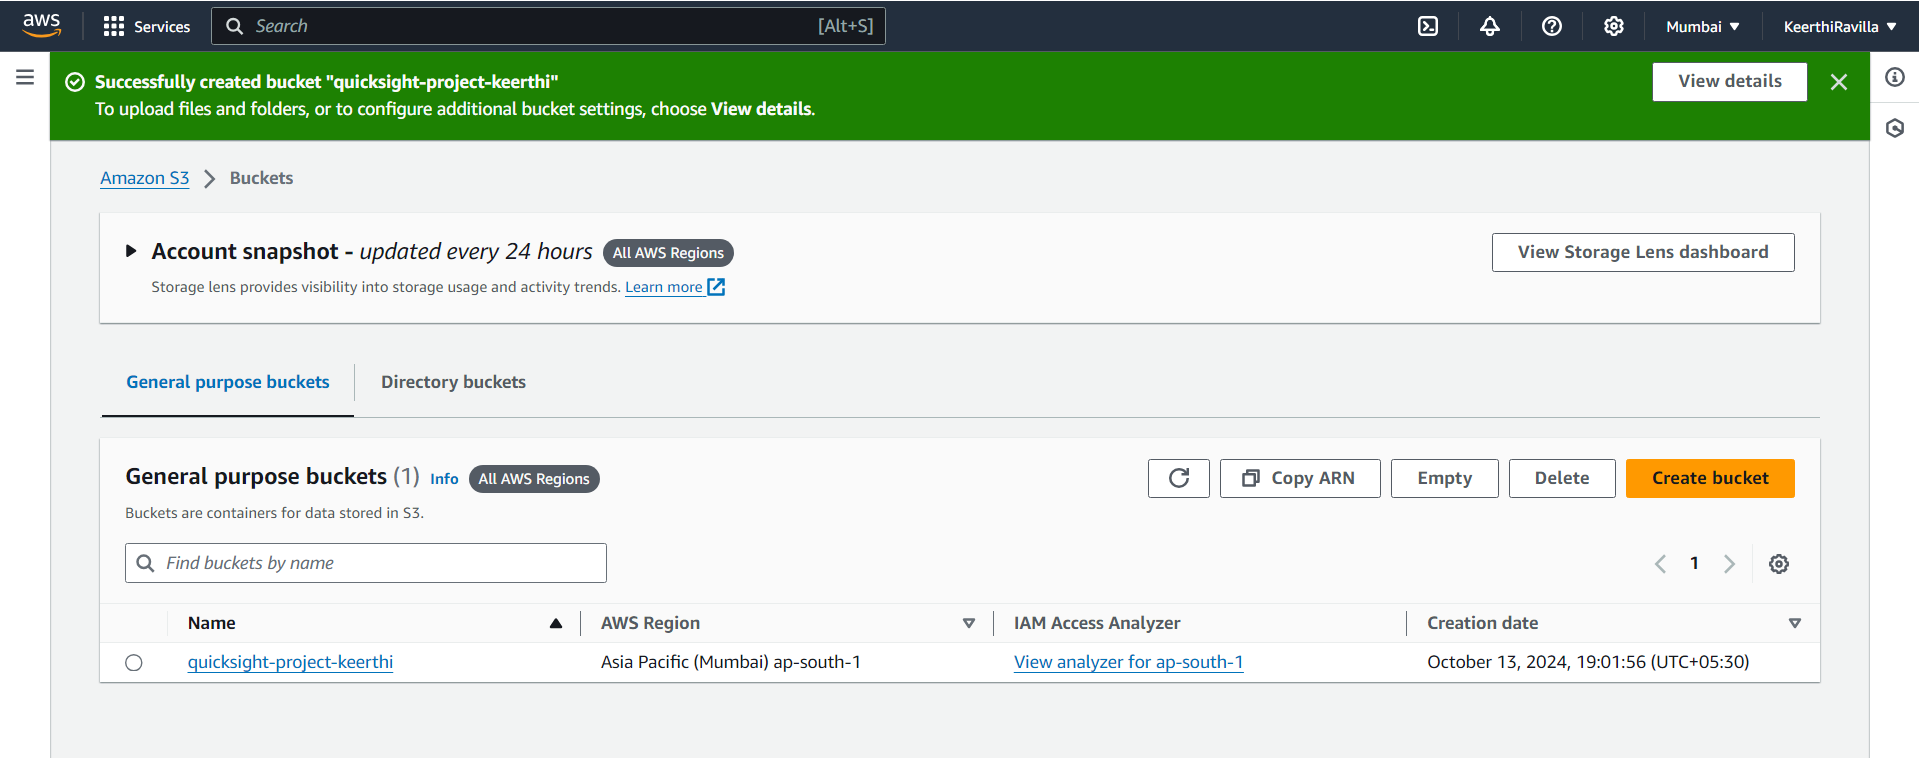
Step 3: Upload the Netflix Dataset
Click on the name of your new bucket to open it.
Click Upload.
Select your Netflix dataset file from your computer and click Upload again to add it to the bucket.
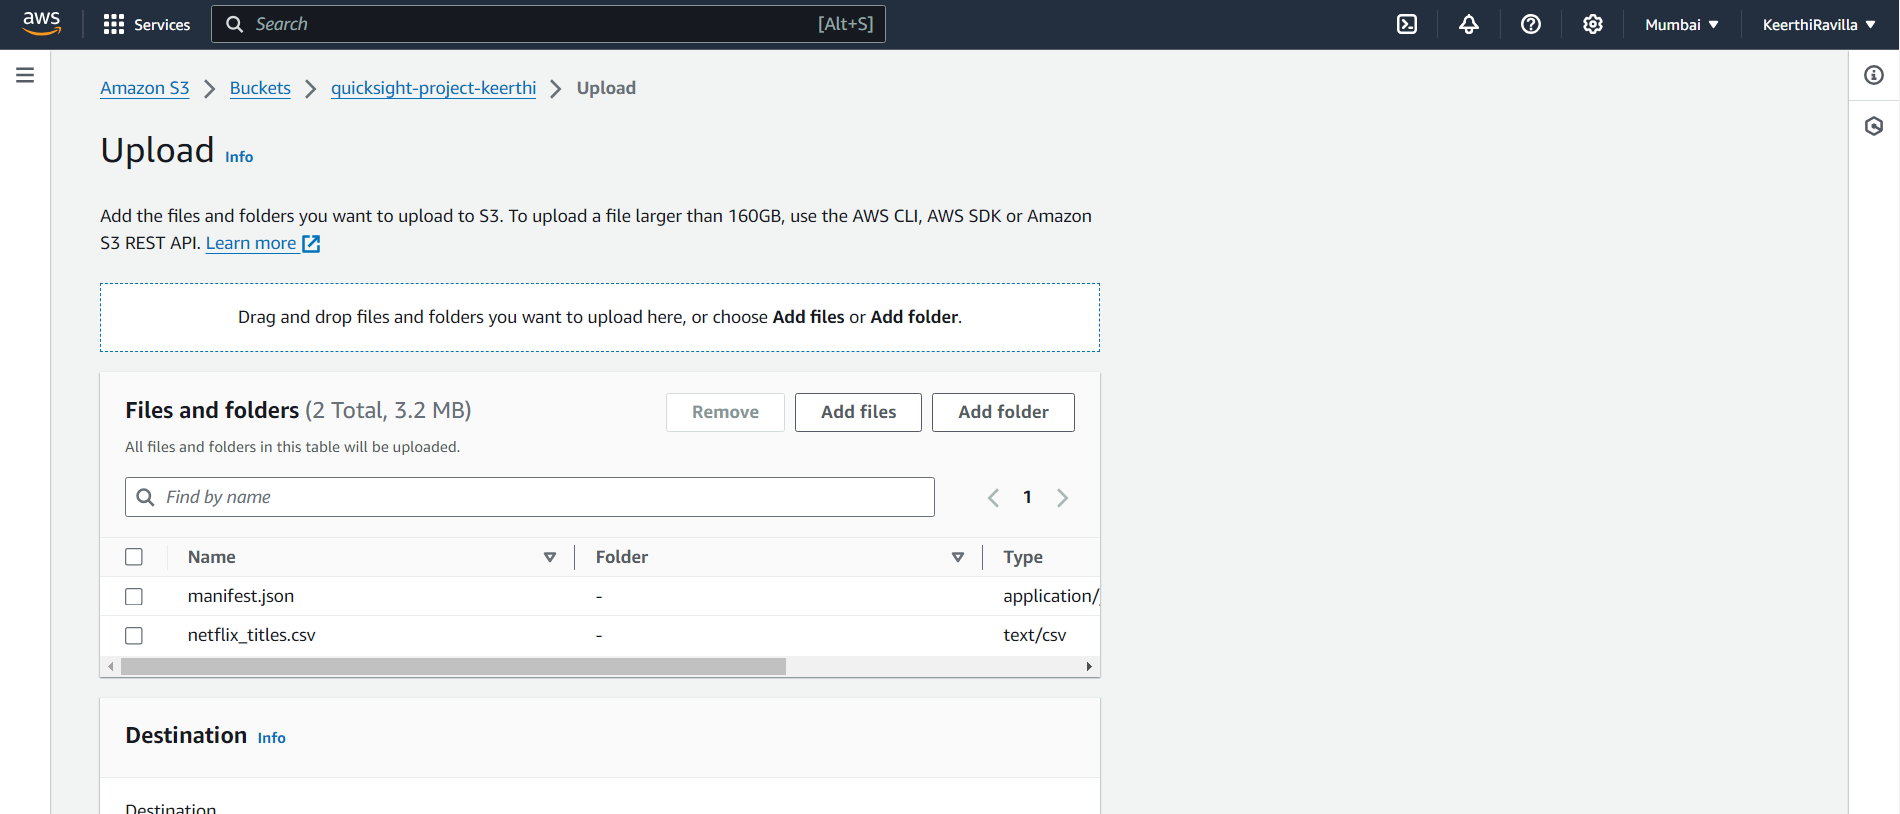
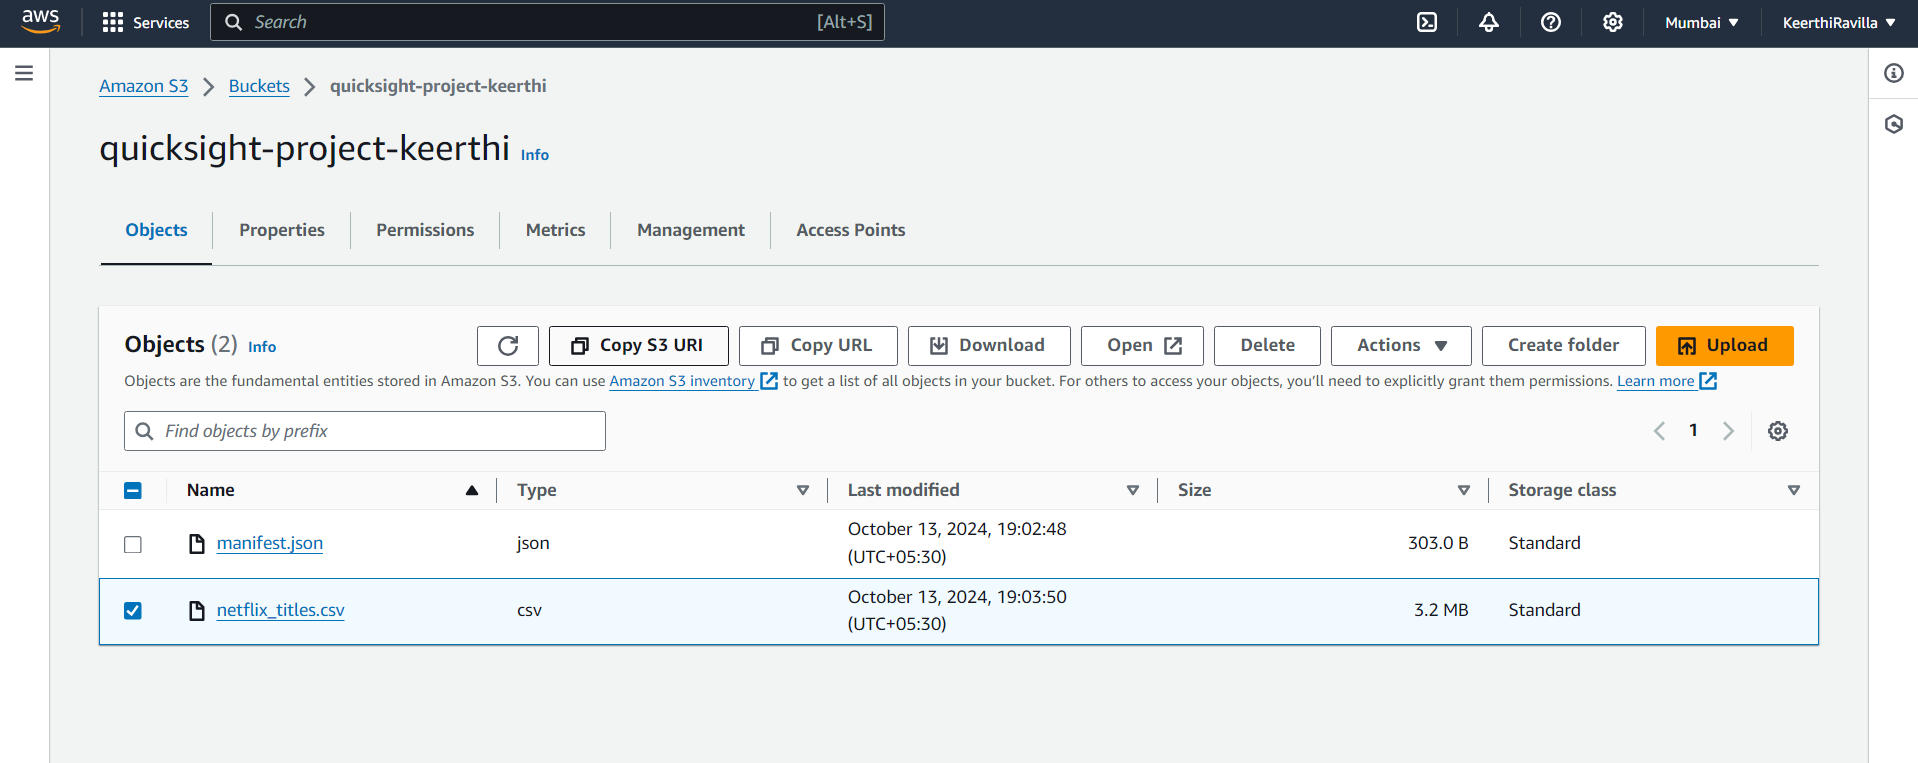
Click on the data CSV file you uploaded and choose the option to copy the S3 URI at the top.
Open your laptop's text editor, then copy and save this manifest.json file. Make sure to change the URIs in the file to your copied URI.
  {
      "fileLocations": [
          {
              "URIs": [
                  # replace this URI with the copied s3 URI of your file
                  "s3://quicksight-project-keerthi/netflix_titles.csv"
              ]
          }
      ],
      "globalUploadSettings": {
          "format": "CSV",
          "delimiter": ",",
          "textqualifier": "\"",
          "containsHeader": "true"
      }
  }
Upload this file to your S3 bucket.
Setting Up Amazon QuickSight
Step 1: Subscribe to Amazon QuickSight
In the AWS Console, type QuickSight into the search bar.
If it’s your first time using QuickSight, follow the instructions to activate your subscription. It offers a free tier for beginners.
Click on the sign-up for QuickSight option.
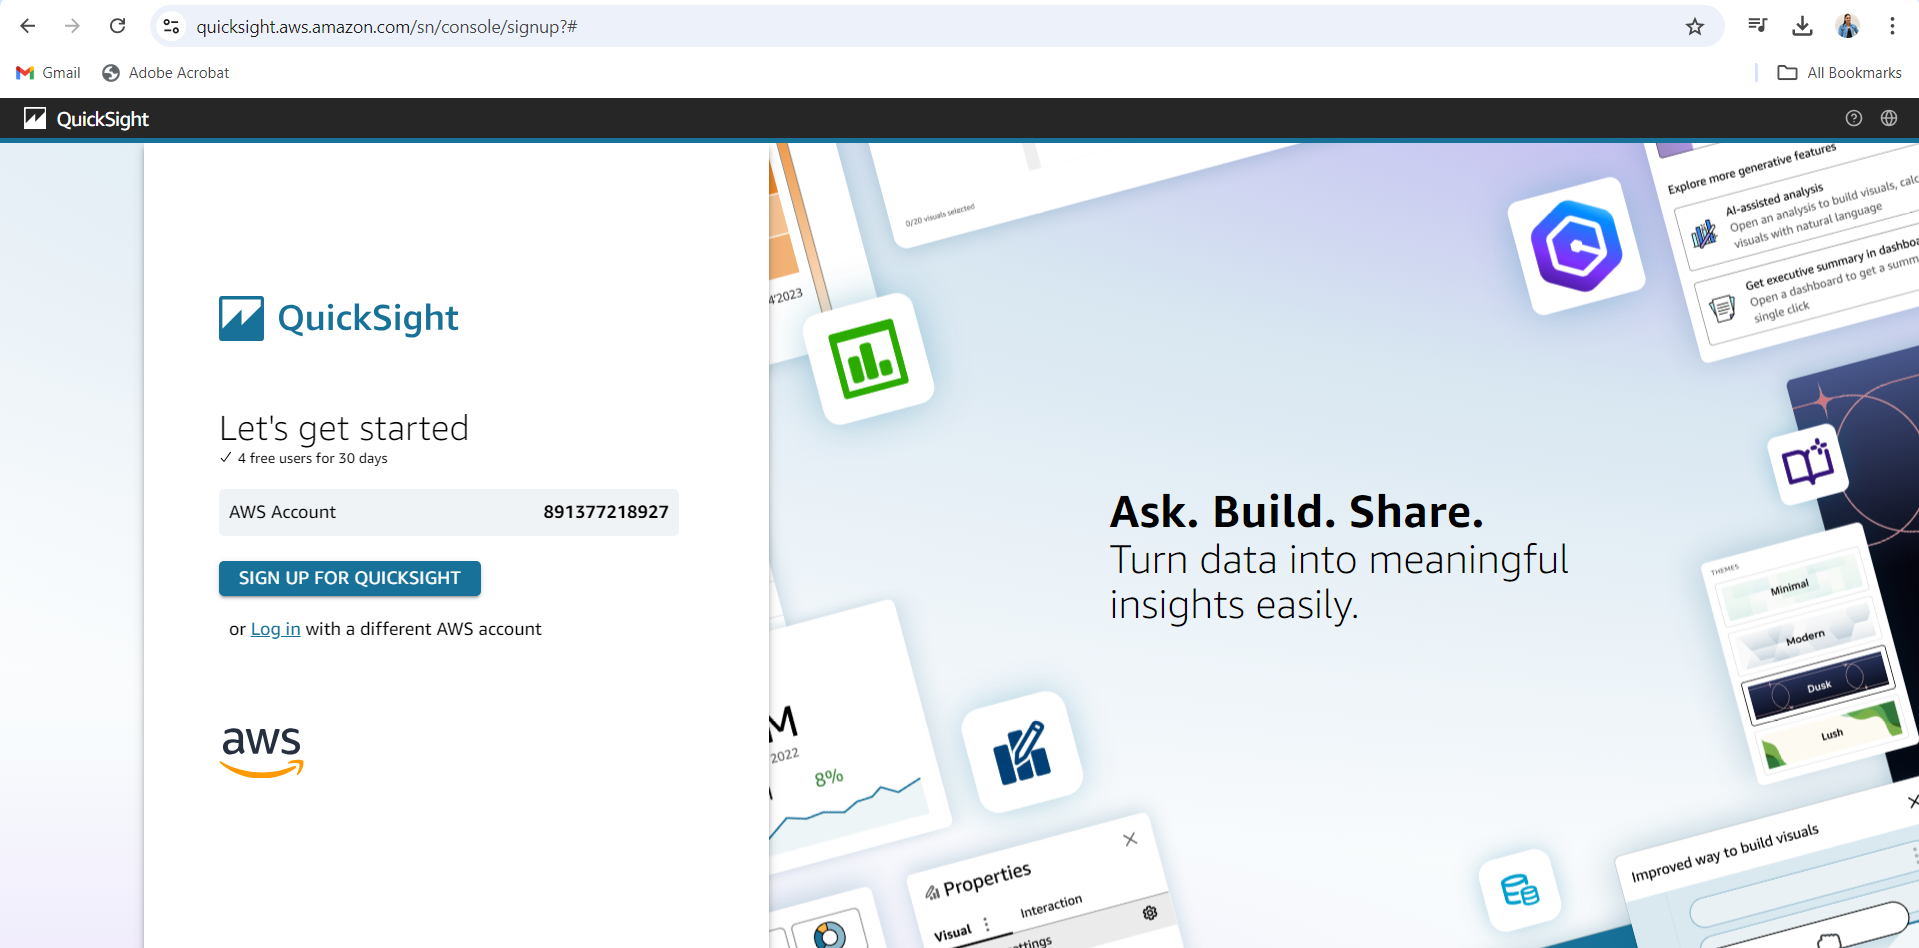
Enter your email ID and keep the authentication method default (don’t change it).
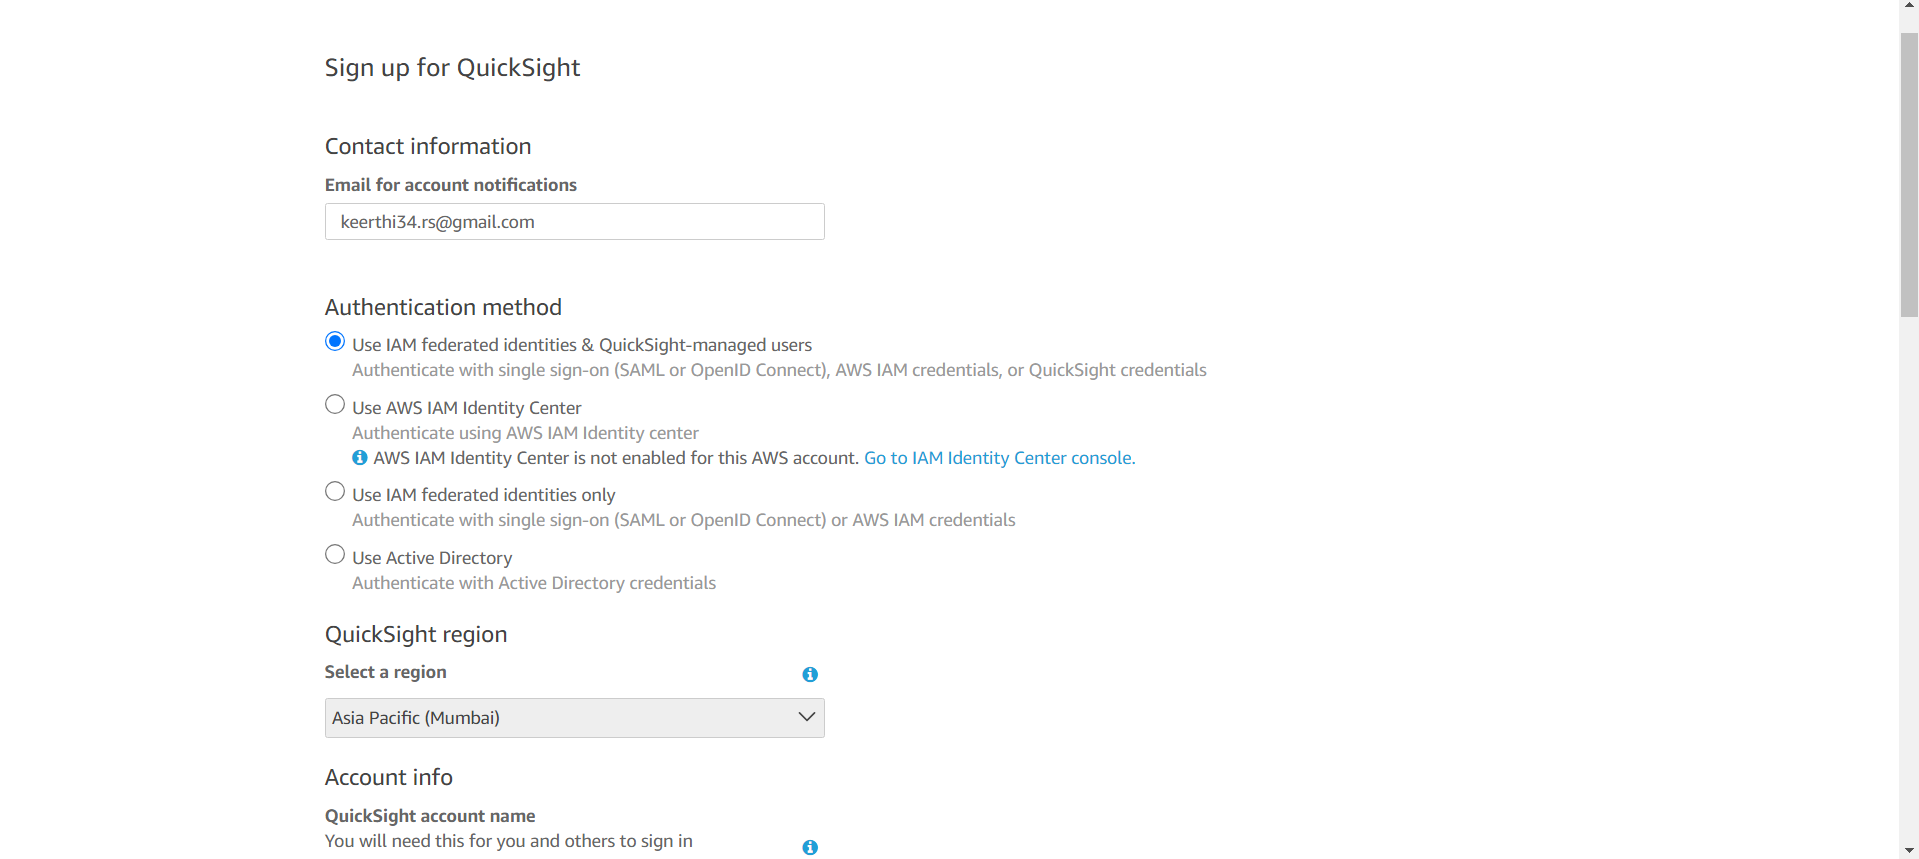

Warning: Make sure to uncheck this option to avoid unnecessary charges.
Name your QuickSight project, such as
Netflix-amazon-projector something unique. This name will be needed for you and others to sign in to your project.
Keep the default settings as it is
Under Allow access and autodiscovery for these resources section, select
Amazon S3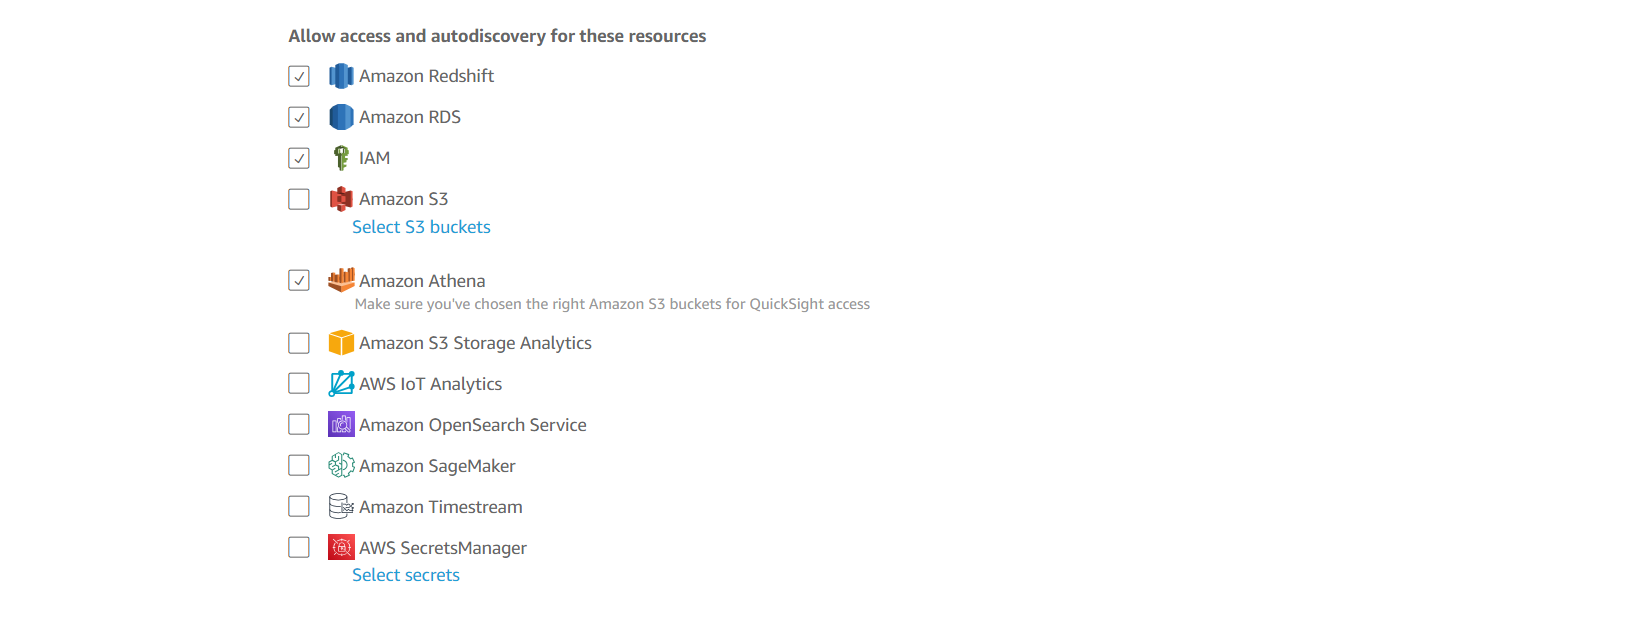
Select the bucket, you have created and hit that finish button.
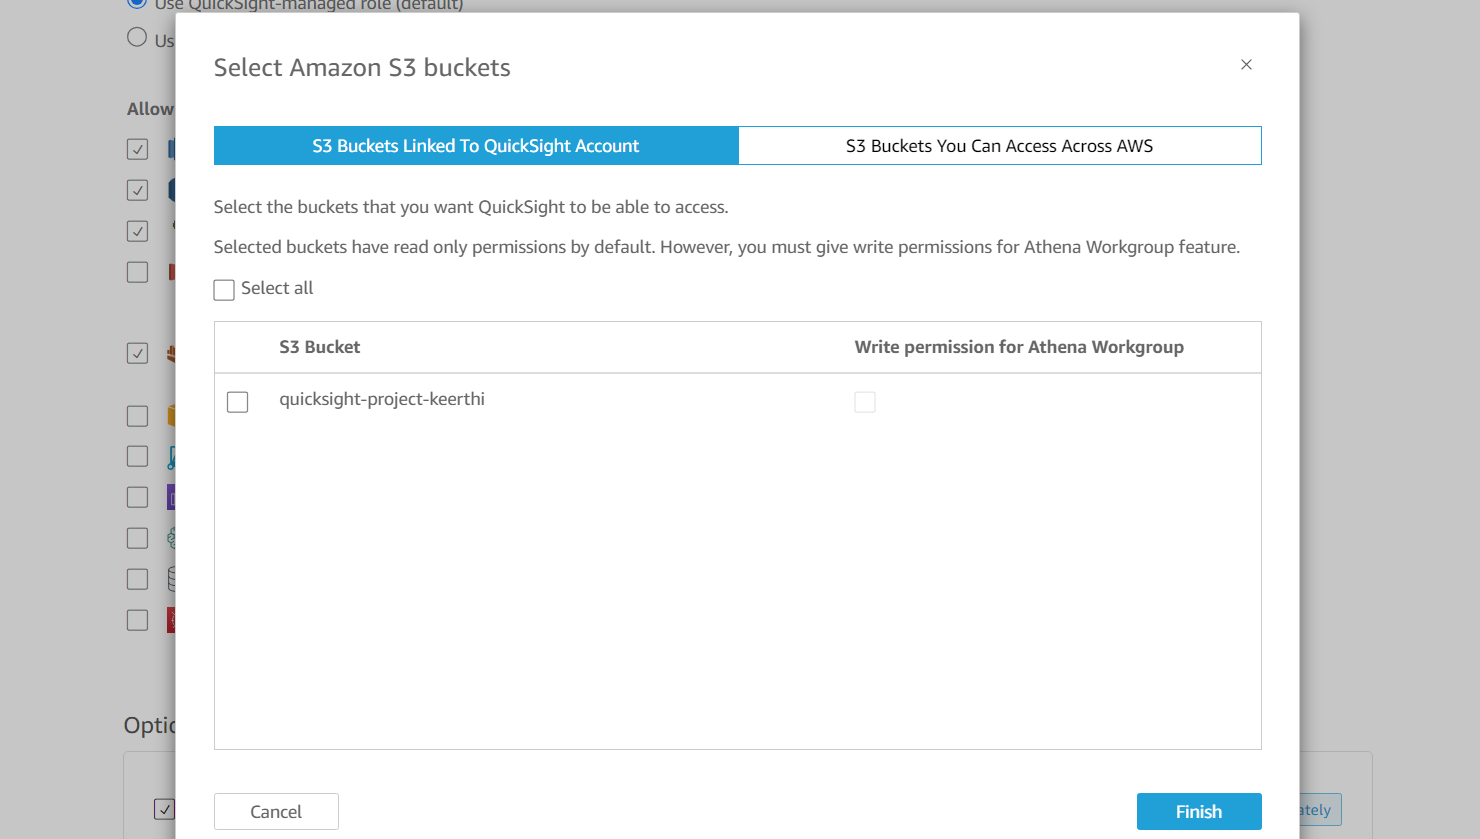
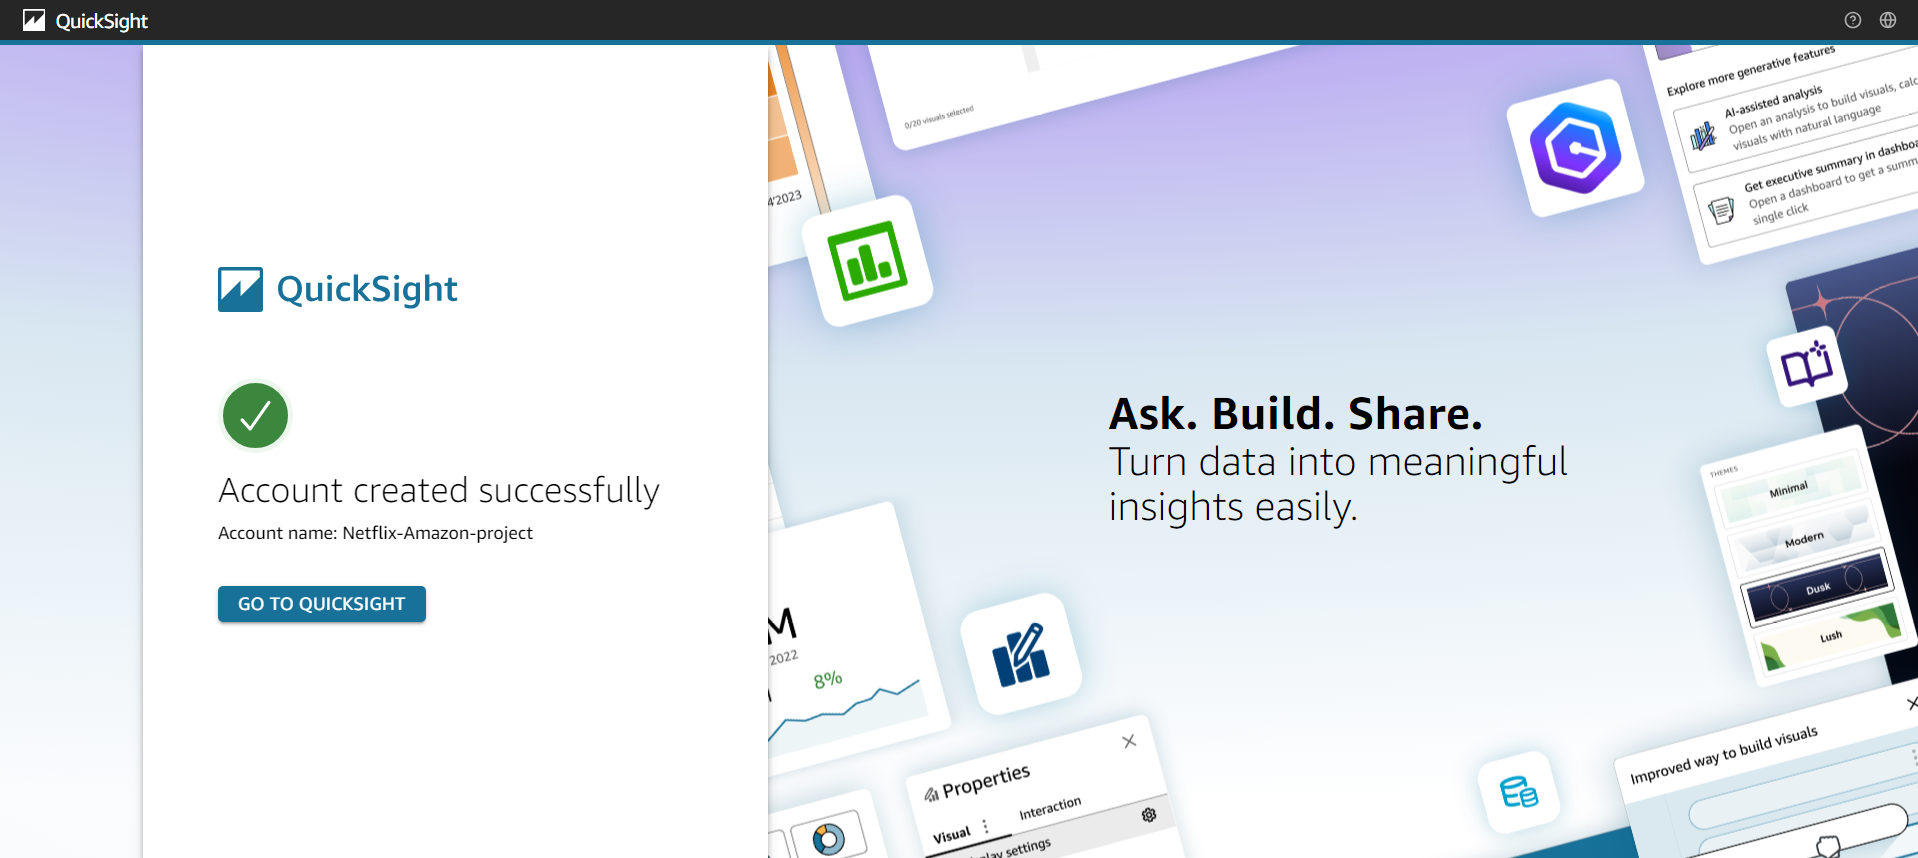
Click "Create," and you should now see this window. Then, click on "Go to Insights."
Step 2: Create a New Dataset
In QuickSight, go to Datasets on the left panel.
Click New Dataset and choose S3 as the data source.
Step 3: Link S3 as the Data Source
Name your dataset, something like
NetflixData.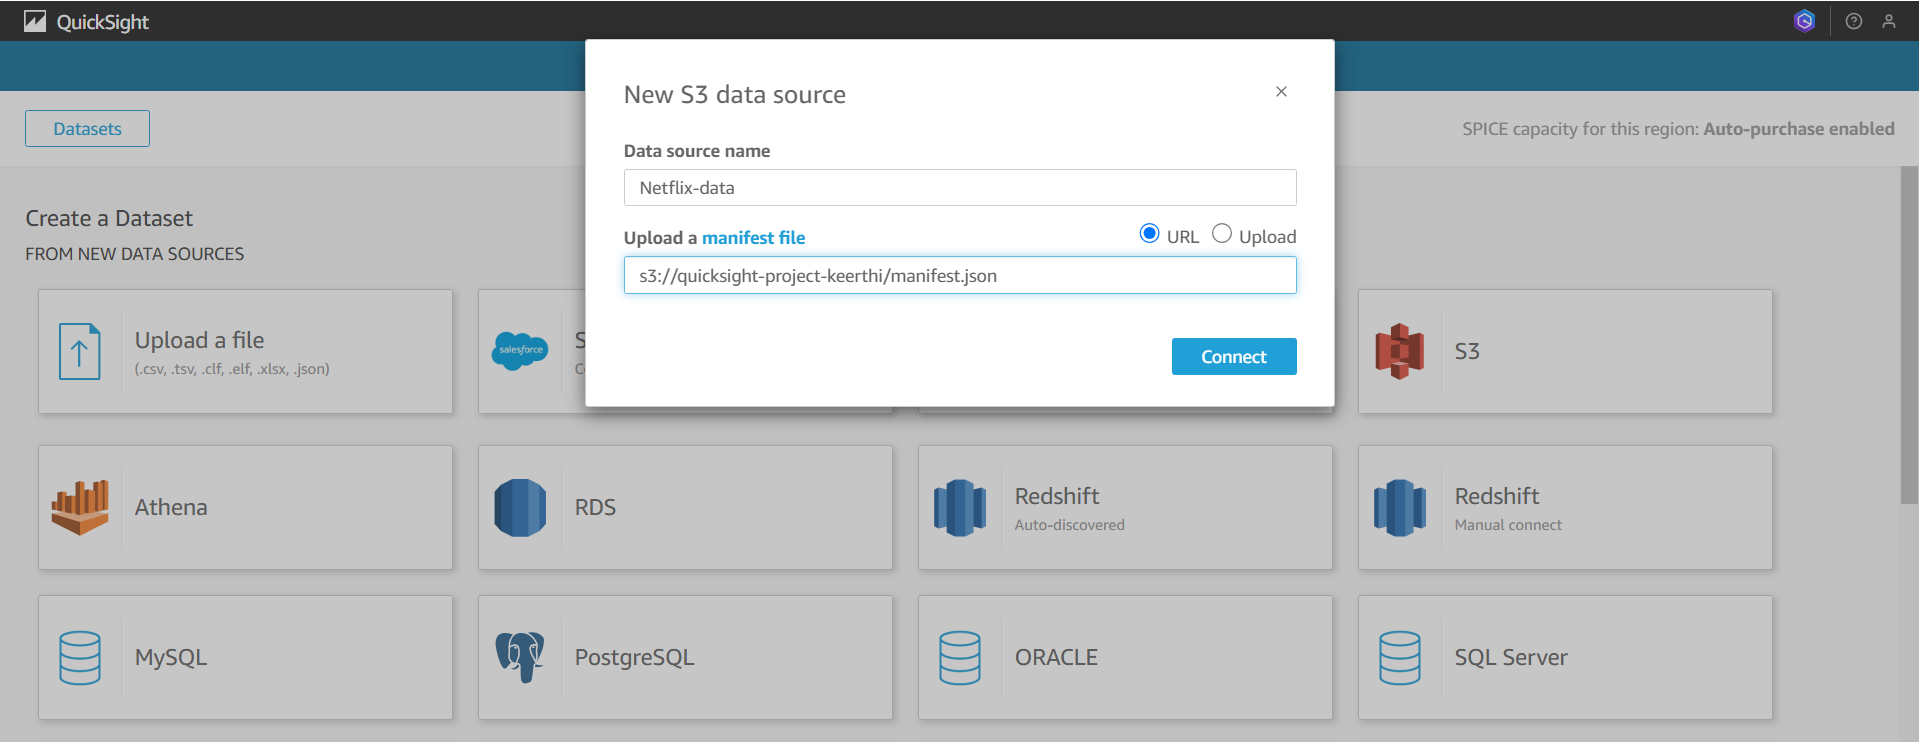
Enter the S3 path where your dataset is stored. (When you click on the data CSV file in your bucket, you will see a copy S3 URI that will be our S3 path.)
Click Connect, and then you will see a pop-up window. In it, click on "Visualize."
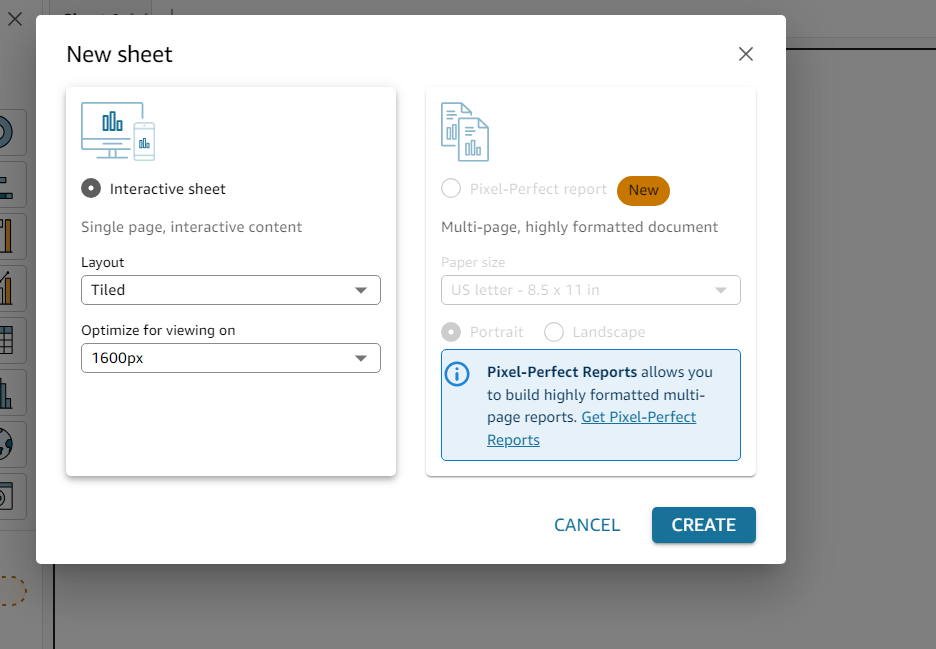
Select Create. Select the Interactive sheet to start creating visualizations.
Getting the Data Ready
Step 1: Data Preview and Preparation
QuickSight will display a preview of your dataset. On the left-hand panel, you can see that the dataset's fields are already imported.
You can clean up the data here by filtering unnecessary rows or columns, but for now, you can click Save & Visualize to move on to the fun part – visualizing the data.
Creating Visualizations
Drag fields into the graph to create visualizations.
Let's go through one example together:
Drag
release_yearinto the Y-Axis heading.Now you can see a breakdown by year.these Netflix-featured TV shows and movies were released.
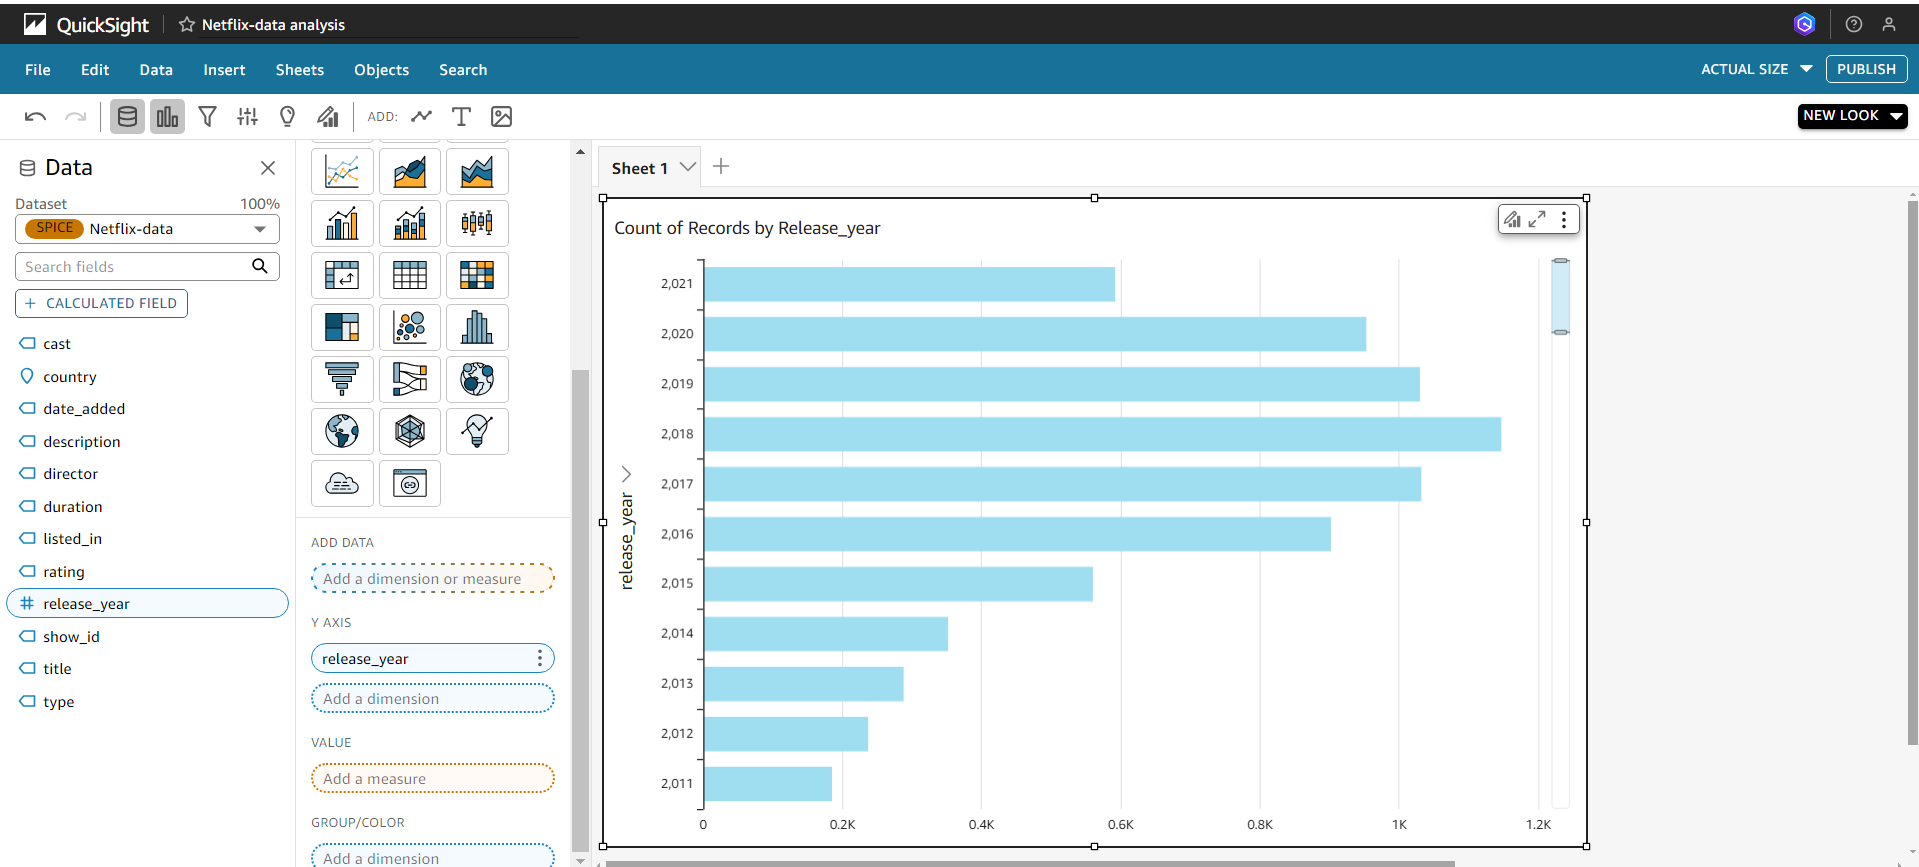
- You can change it to different types of graphs by clicking on the visualize section.
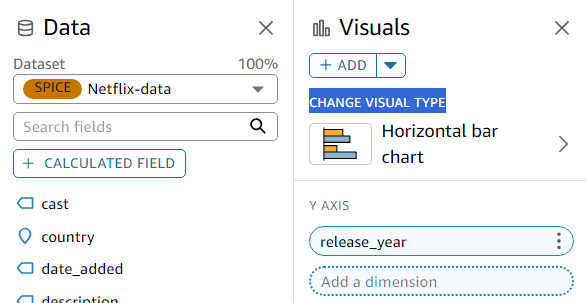
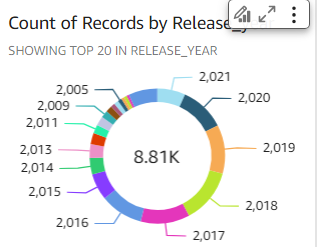
Here, I changed it to a donut chart. you can edit the title on the chats by double-clicking on the chart and edit the default field.
Now let's create a new visual, select + ADD under the Visuals heading on your middle navigation bar, and you'll see another blank frame pop out.
Let’s do, two more samples together and then you can play along with your data. So, what would you do to see a breakdown of TV shows vs movies for every year?
1. Drag the release_year label into the y-axis of the horizontal bar chart.
2. Next, drag the type into the Group/color heading.
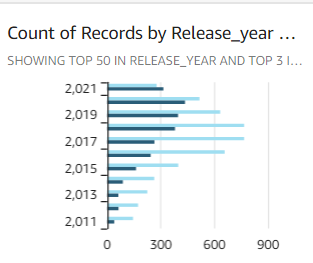
TV shows and movies featured. How many were listed as 'Action & Adventure', 'TV Comedies', and 'Thrillers'? How many were released after 2015?
Click on filter, choose type, and edit the values to the genres above. Then click apply. I chose
Click on add filter, select release_year, choose years from 2015 onward, and click apply.
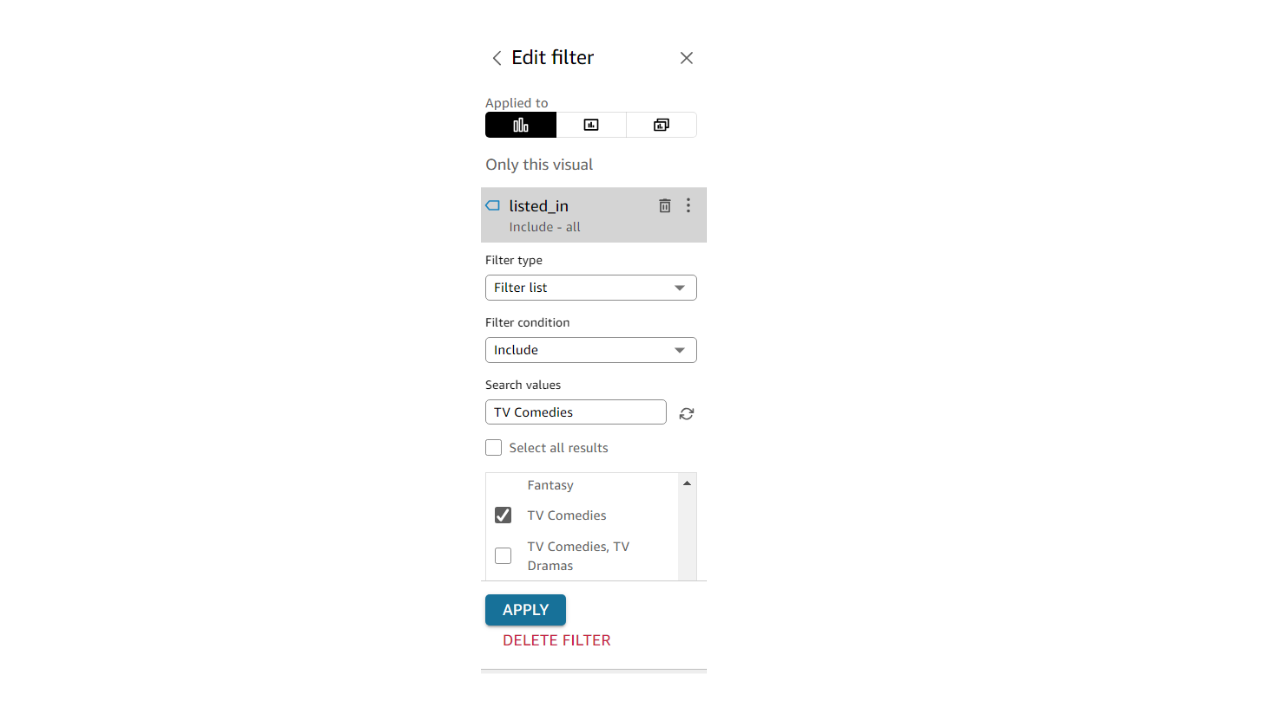
Play around with filters to make your data clearer.
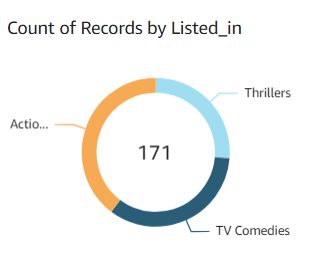
Now you do as many charts, you want and pin them in the dashboard.
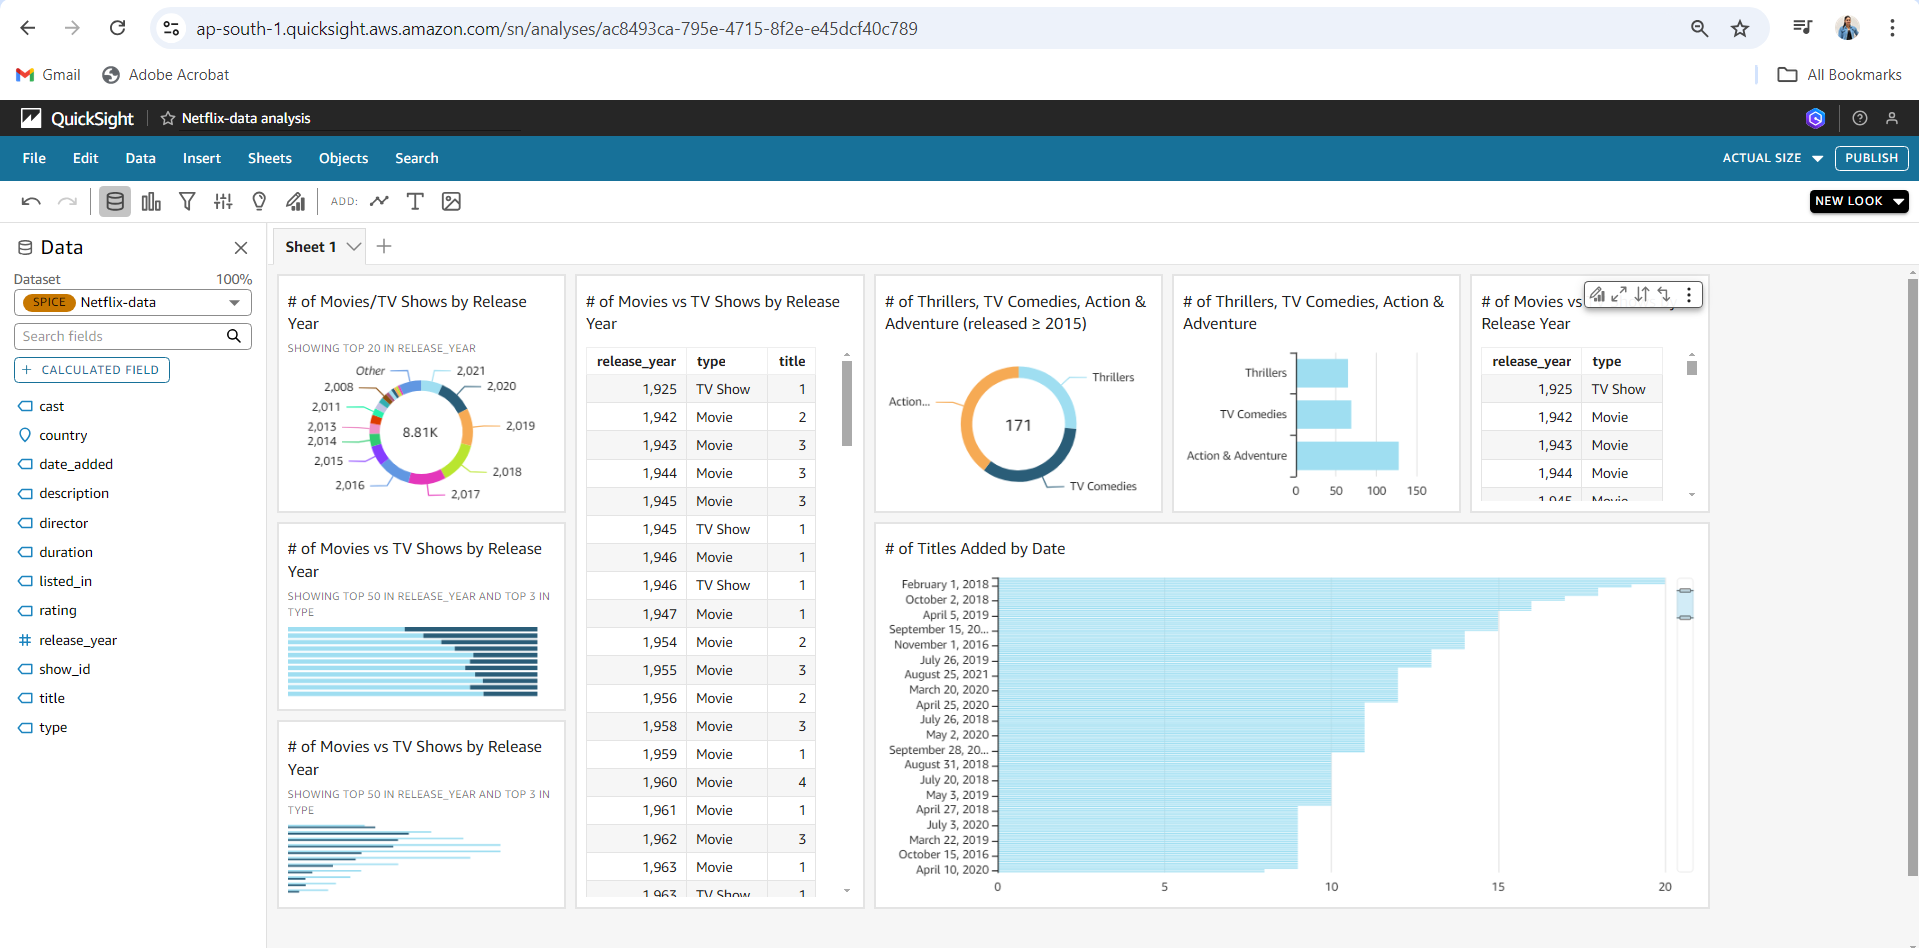
Creating a Dashboard
Step 1: Save and Publish Your Work
When you’re happy with your visualizations, click on Share in the top-right corner.
Choose Publish Dashboard, give it a name, and click Publish.
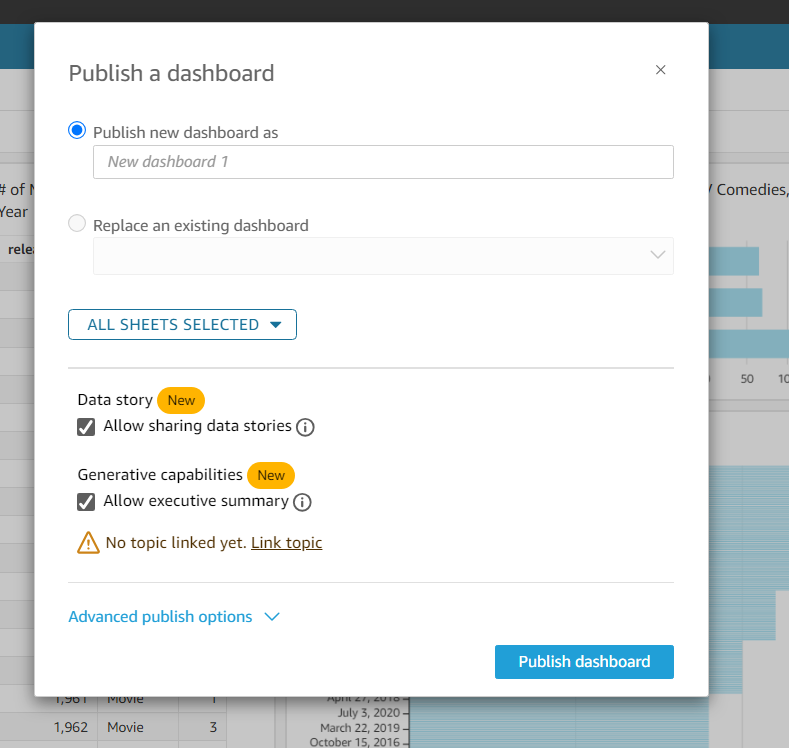
Now, you can share the dashboard with others or keep it for your analysis.
Step 2: Sharing the Dashboard
After publishing, you’ll get a link that you can share with friends or colleagues\
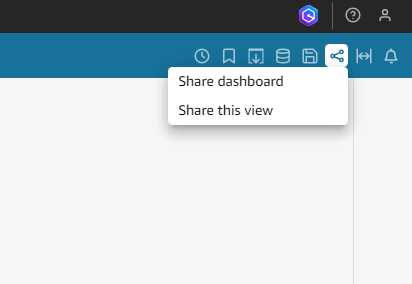
You can also schedule automated email reports from your dashboard if needed.
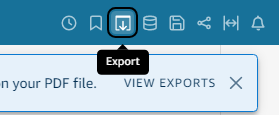
You can also export your data as a PDF. Just click on the export button in the top-right corner, select the generate PDF option, and voila, your dashboard is now a PDF.
warning!! After experimenting, remeber to delete your amazon Quickshift and s3 bucket to avoid billing.
Deleting resources
Deleting Amazon Quickshift:
Return to the home page.
Select the user icon in the top right corner.
Click on Manage QuickSight.
Select Account Settings from the left-hand navigation panel.
Click on Manage at the bottom of the page.
Toggle off account termination.
Type confirm.
Click Delete account.
Deleting S3 Bucket
Select your bucket, then choose Delete.
If you can't delete it because there are objects inside, select Empty bucket.
Type "permanently delete" in the text field.
After that, you can delete the bucket itself.
Congratulations!!🎉 You’ve successfully stored data in an S3 bucket and visualized it using Amazon QuickSight. By following this beginner-friendly guide, you’ve taken an important step toward mastering powerful AWS tools for data analysis. With practice, you'll be able to dive into more complex datasets and create even more detailed and insightful visualizations. Check out network.org for detailed explanations of a wide range of AWS projects, all available for free! Stay tuned to our AWS series as we continue exploring the exciting possibilities of cloud services. Happy analyzing!
Subscribe to my newsletter
Read articles from Keerthi Ravilla Subramanyam directly inside your inbox. Subscribe to the newsletter, and don't miss out.
Written by

Keerthi Ravilla Subramanyam
Keerthi Ravilla Subramanyam
Hi, I'm Keerthi Ravilla Subramanyam, a passionate tech enthusiast with a Master's in Computer Science. I love diving deep into topics like Data Structures, Algorithms, and Machine Learning. With a background in cloud engineering and experience working with AWS and Python, I enjoy solving complex problems and sharing what I learn along the way. On this blog, you’ll find articles focused on breaking down DSA concepts, exploring AI, and practical coding tips for aspiring developers. I’m also on a journey to apply my skills in real-world projects like predictive maintenance and data analysis. Follow along for insightful discussions, tutorials, and code snippets to sharpen your technical skills.