Understanding the Psychrometric
 Gurudath K P
Before we dive into the psychrometric chart, let’s first get clear on what psychometry is. Simply put, psychometry is the study of the thermodynamic properties of moist air.
Now, what are thermodynamic properties? Don’t worry, it’s not as complicated as it sounds. Thermodynamic properties include things like temperature, humidity, enthalpy (which we’ll explain in a bit), pressure, and density. These are all the things that help us understand how air behaves.
I know what you’re thinking: "Wait, I need to understand humidity and enthalpy too!" Let's break it down.
Humidity is simply how much water vapor is in the air. In HVAC, we pay close attention to two terms: humidity ratio and relative humidity. Humidity ratio is the amount of water vapor (or moisture) in the air compared to dry air. It’s like comparing how much water is in a sponge to how much the sponge itself weighs.
Relative humidity is a bit different from the humidity ratio. It’s the amount of moisture currently in the air compared to the maximum amount of moisture the air can hold at a given temperature. Think of it like this: if the air were a cup, relative humidity tells us how full the cup is with water (moisture). If the cup is only half full, the relative humidity is 50%. If it's completely full, we’ve hit 100% relative humidity, meaning the air can’t hold any more moisture!
Note: If you increase the temperature of the air, the cup (or the air’s moisture-holding capacity) gets bigger, meaning it can hold more moisture. However, the actual amount of moisture in the air stays the same. This is why warmer air can hold more humidity than cooler air.
Why is this important? Well, in HVAC, understanding relative humidity helps us control comfort. Too much moisture makes the air feel sticky and heavy (like on a hot summer day), while too little moisture can make the air dry and uncomfortable.
Now, let’s talk about enthalpy. In simple terms, enthalpy is the total heat content of the air, including both the sensible heat (the heat you can feel) and the latent heat (the heat that’s needed to change the moisture in the air, like turning water into vapor).
Think of it like this: if you’re heating up air, you’re not just raising its temperature—you’re also adding energy to the moisture in the air. That extra energy is part of the air’s enthalpy. In HVAC, knowing the enthalpy helps us figure out how much energy is needed to heat, cool, or dehumidify air.

What is the Psychrometric Chart?
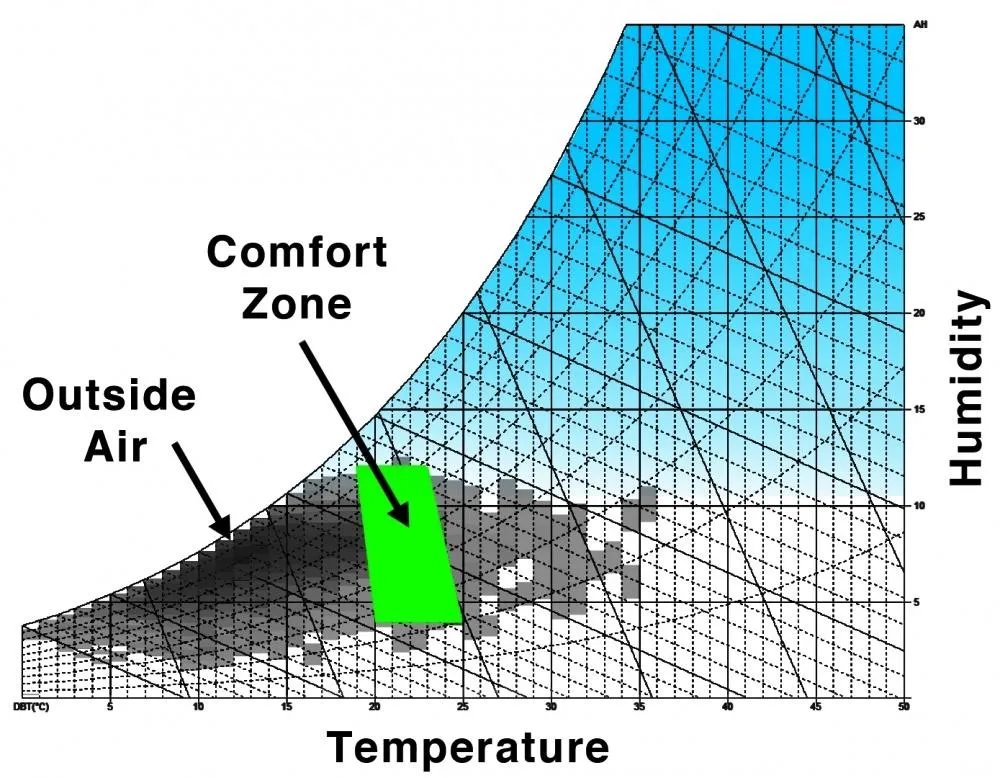
Now that we’ve covered the basics of humidity and enthalpy, let’s talk about the psychrometric chart itself. The psychrometric chart is essentially a graphical representation of the physical and thermal properties of moist air. It looks a bit intimidating at first, with all the lines and curves, but once you break it down, it becomes an incredibly useful tool in HVAC.
The chart allows us to visualize how changes in temperature, humidity, and enthalpy interact. Imagine it like a roadmap for air conditions—where each point on the chart represents a specific state of the air, based on properties like dry bulb temperature, humidity ratio, and enthalpy.
Key Components of the Psychrometric Chart
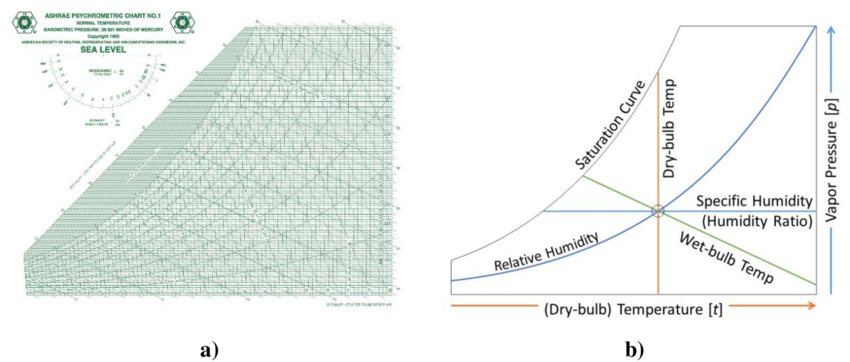
Dry Bulb Temperature (DBT): This is the temperature of the air measured by a regular thermometer. It’s what we usually think of as air temperature. On the chart, this is shown along the horizontal axis.
Wet Bulb Temperature (WBT): This is a bit different from the dry bulb temperature. It’s measured by a thermometer with a wet cloth around its bulb. Wet bulb temperature takes into account both the air temperature and the moisture content. You’ll notice sloping lines on the chart representing the wet bulb temperatures.
Humidity Ratio: This is the amount of moisture in the air compared to dry air, just like we discussed earlier. On the chart, the humidity ratio is represented along the vertical axis.
Relative Humidity (RH): This is the “cup of water” analogy we used earlier. The curved lines running from the bottom to the top of the chart represent different levels of relative humidity, from 0% (completely dry air) to 100% (saturated air).
Saturation Line: The upper curve of the chart is the saturation line, which represents air that’s fully saturated with moisture (100% relative humidity). Any point along this line means the air cannot hold any more water vapor.
Enthalpy: Remember, enthalpy is the total heat content of the air. On the chart, enthalpy lines run diagonally, helping us understand the energy content of the air in different st
Specific Heat: This is the amount of energy required to raise the temperature of 1 kilogram of air by 1°C. In HVAC, we assume the specific heat of air is around 1.005 kJ/kg°C. Knowing this helps us calculate the energy needed to heat or cool the air.
Specific Volume: This represents the volume occupied by 1 kilogram of dry air, measured in cubic meters per kilogram (m³/kg). Warmer air has a higher specific volume than cooler air, and you can observe these changes on the chart through specific volume lines that slope upward to the right.
Dew Point Temperature: This is the temperature at which the air becomes fully saturated with moisture (100% RH), and condensation begins. If air is cooled to the dew point, water vapor will condense into liquid. The dew point is marked by the intersection of the air’s humidity ratio with the saturation line on the chart.
Why is the Psychrometric Chart Important in HVAC?
In HVAC systems, we’re constantly working with air—heating it, cooling it, humidifying it, or dehumidifying it. The psychrometric chart helps us track all of these changes in one place. For example, if we need to cool air while reducing its humidity, we can trace the movement of the air on the chart to see how much energy is required to achieve that.
It’s especially useful when designing air conditioning systems, as it allows us to optimize for comfort, efficiency, and energy use.
Wrapping It Up
The psychrometric chart helps us understand how air works in heating, cooling, and dehumidifying. By learning about things like temperature, humidity, and heat content, we can make spaces more comfortable and energy-efficient.
Thanks for reading, and see you in the next blog!
************************************************************************
Subscribe to my newsletter
Read articles from Gurudath K P directly inside your inbox. Subscribe to the newsletter, and don't miss out.
Written by

Gurudath K P
Gurudath K P
I am an aspiring DevOps engineer with a strong passion for learning and growing in this field. After being inspired by my roommate's journey from mechanical engineering to DevOps, I realized my own affinity for computers and decided to pursue this path towards success. Please guide me on this journey