Network Automation Monitoring -- TIG Stack as docker compose
 pDamasceno
In the last post of this series, we downloaded the images and created the containers to run our monitoring environment. You can check it out here.
Today we are going to create a docker-compose file to make our lives easier to spin up and tear down this network health monitoring environment.
Initial Structure
The initial structure will be the following, as we add more customizable services like dashboards, databases, Netbox and Stackstorm, we will build up.
.
├── docker-compose.yml
├── .dev.env
├── grafana
│   ├── dashboards.yml
│   ├── data
│   ├── datasource.yml
│   └── grafana.ini
├── influxdb
│   ├── config.yml
│   └── data
└── telegraf
    ├── data
    └── telegraf.conf
.dev.env
TELEGRAF_HOST=telegraf

DOCKER_INFLUXDB_INIT_MODE=setup
DOCKER_INFLUXDB_INIT_USERNAME=nhm_user
DOCKER_INFLUXDB_INIT_PASSWORD=nhm_password
DOCKER_INFLUXDB_INIT_ORG=NHM_OU
DOCKER_INFLUXDB_INIT_BUCKET=NHM
DOCKER_INFLUXDB_INIT_RETENTION=1w
DOCKER_INFLUXDB_INIT_ADMIN_TOKEN='PU7Lnli-_2VkRWSqFgGetKnDaWH47QGklH56bL12_VA2hPfKAEmHSoPKUJ31G5b5O2St7LrikT8wm339-4s3pg=='
INFLUXDB_HOST=influxdb

GRAFANA_PORT=3000
GRAFANA_USER=admin
GRAFANA_PASSWORD=admin
GRAFANA_PLUGINS_ENABLED=true
## Influx
On influx we want to make sure we load the proper environment variables to build some useful tables once it start and let’s map the local volumes for persistence and to make our lives easier to edit and build it.
To already adjust our configurations, we only need config.yml file, which we will not change for the time being. It should have been created the same way as the previous post.
### docker-compose.yml
  influxdb:
    image: influxdb:2.7.1
    container_name: nhm_influxdb
    hostname: influxdb
    restart: always
    volumes:
      - ./influxdb/config.yml:/etc/influxdb2/config.yml:ro
      - ./influxdb/data:/var/lib/influxdb2
    ports:
      - "8086:8086"
      - "8088:8088"
    env_file:
      - .dev.env
    healthcheck:
      test: [ "CMD", "curl", "-f", "http://localhost:8086/ping" ]
      interval: 10s
      timeout: 30s
      retries: 5
      start_period: 30s
## Telegraf
On telegraf, the important file is telegraf.conf which will inform telegraf the Plugins we want to be active. It already comes pre-configured by default, but we want to use some special ones, and once we finish building our devices, we’ll make sure to come back here to edit this file.
## Grafana
Here we already have some modifications to do.
We want to make sure to use our Influxdb as datasource, prepare some dashboards (would be a nightmare to have to recreate every time we spin up the environment), and eventually install some plugins.
### grafana.ini
##################### Grafana Configuration Example #####################
#
# Everything has defaults so you only need to uncomment things you want to
# change
# possible values : production, development
;app_mode = production
# instance name, defaults to HOSTNAME environment variable value or hostname if HOSTNAME var is empty
instance_name = ${GRAFANA_HOSTNAME}

#################################### Paths ####################################
[paths]
# Path to where grafana can store temp files, sessions, and the sqlite3 db (if that is used)
data = /var/lib/grafana
# Temporary files in `data` directory older than given duration will be removed
temp_data_lifetime = 24h
# Directory where grafana can store logs
logs = /var/log/grafana
# Directory where grafana will automatically scan and look for plugins
plugins = /var/lib/grafana/plugins
# folder that contains provisioning config files that grafana will apply on startup and while running.
provisioning = conf/provisioning

#################################### Server ####################################
[server]
# Protocol (http, https, h2, socket)
protocol = http
# This is the minimum TLS version allowed. By default, this value is empty. Accepted values are: TLS1.2, TLS1.3. If nothing is set TLS1.2 would be taken
;min_tls_version = ""
# The ip address to bind to, empty will bind to all interfaces
;http_addr =
# The http port  to use
http_port = $GRAFANA_PORT
### datasource.yml
This will make sure to already connect to the sources at creation time
#file version
apiVersion: 1

datasources:
  - name: InfluxDB
    type: influxdb
    access: proxy
    url: http://$INFLUXDB_HOST:8086
    editable: true
    jsonData:
      version: Flux
      organization: $DOCKER_INFLUXDB_INIT_ORG
      defaultBucket: $DOCKER_INFLUXDB_INIT_BUCKET
    secureJsonData:
      token: $DOCKER_INFLUXDB_INIT_ADMIN_TOKEN
### docker-compose.yml
grafana:
    image: grafana_jsonapi
    container_name: nhm_grafana
    hostname: grafana
    restart: always
    ports:
      - "3000:3000"
    volumes:
      - ./grafana/data:/var/lib/grafana
      - ./grafana/datasource.yml:/etc/grafana/provisioning/datasources/datasource.yml
    links:
      - "influxdb"
    depends_on:
      influxdb:
        condition: service_healthy
    user: root
    env_file:
      - .dev.env
Complete file
version: "3.7"

services:
  grafana:
    image: grafana/grafana
    container_name: nhm_grafana
    hostname: grafana
    restart: always
    ports:
      - "3000:3000"
    volumes:
      - ./grafana/data:/var/lib/grafana
      - ./grafana/datasource.yml:/etc/grafana/provisioning/datasources/datasource.yml
    links:
      - "influxdb"
    depends_on:
      influxdb:
        condition: service_healthy
    user: root
    env_file:
      - .dev.env
  telegraf:
    image: telegraf:latest
    container_name: nhm_telegraf
    hostname: telegraf
    restart: always
    command:
      [
        "telegraf",
        "--config",
        "/etc/telegraf/telegraf.conf",
        "--watch-config",
        "poll"
      ]
    volumes:
      - ./telegraf/telegraf.conf:/etc/telegraf/telegraf.conf:ro
    ports:
      - "8092:8092"
      - "8094:8094"
      - "57000:57000"
      - "2022:22"
    links:
      - "influxdb"
      - "webui"
    depends_on:
      influxdb:
        condition: service_healthy
    env_file:
      - .dev.env
  influxdb:
    image: influxdb:2.7.1
    container_name: nhm_influxdb
    hostname: influxdb
    restart: always
    volumes:
      - ./influxdb/config.yml:/etc/influxdb2/config.yml:ro
      - ./influxdb/data:/var/lib/influxdb2
    ports:
      - "8086:8086"
      - "8088:8088"
    env_file:
      - .dev.env
    healthcheck:
      test: [ "CMD", "curl", "-f", "http://localhost:8086/ping" ]
      interval: 10s
      timeout: 30s
      retries: 5
      start_period: 30s
## Initial View
docker compose up -d
Let’s login and take an initial look.


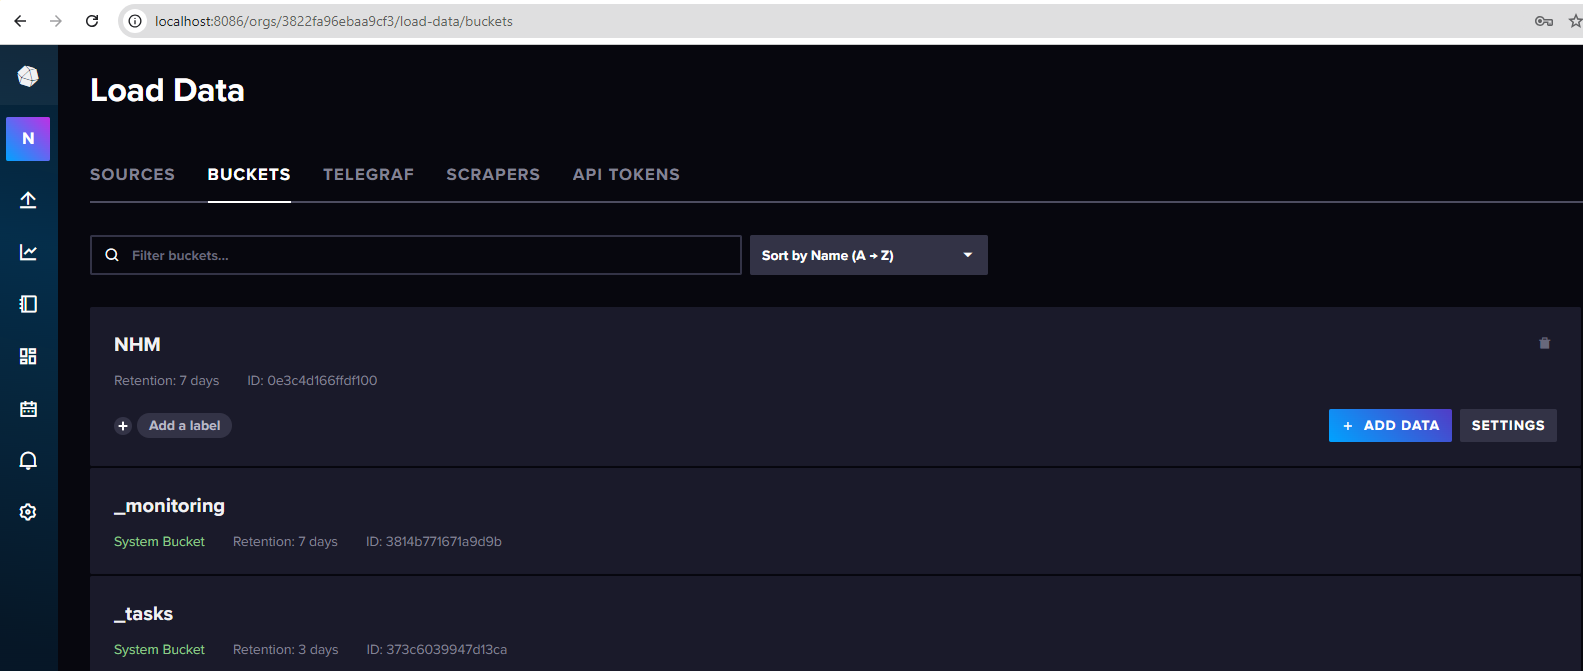
Influxdb spun up already with the bucket NHM created


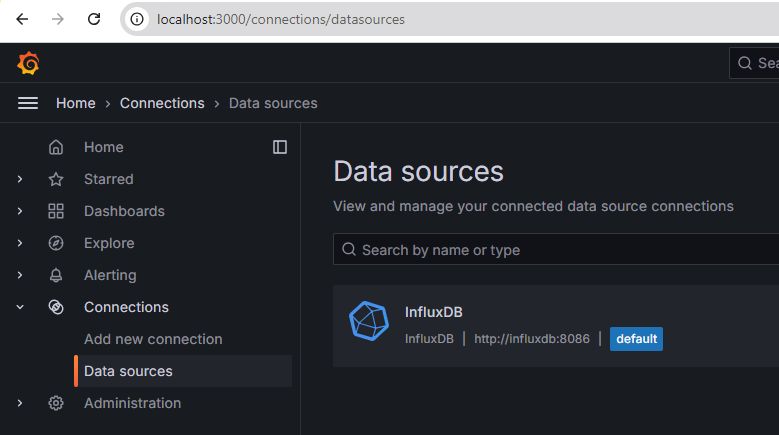
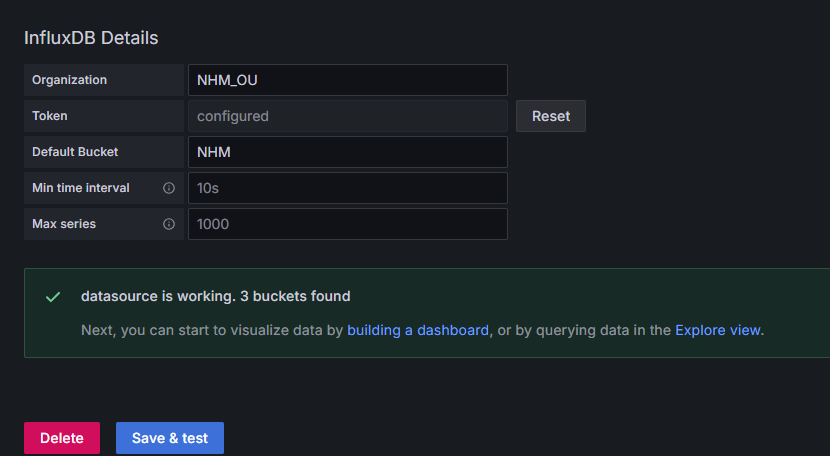
Grafana is also already connected to Influx and is ready to start building some graphs.
What’s next?
Let’s connect to some devices, populate some data in our Netbox environment, start building up our monitoring dashboards and testing telemetry. Stay tuned!
Subscribe to my newsletter
Read articles from pDamasceno directly inside your inbox. Subscribe to the newsletter, and don't miss out.
Written by
